The Marshmallow Test: 3 Stories About 2020 & 2021
Here are 3 stories for your consideration:
Markets Story: Deferring gratification is nurture AND nature.
The Marshmallow Test is one of the most replicated studies in behavioral psychology and all the more notable because it is explicitly designed to assess very young children. Developed by Stanford University researcher Walter Mischel in the early 1970s, here is its basic structure:
- A researcher has a child choose a snack from an assortment of treats.
- The child is then told they can have that item now, or if they can wait a few minutes they will receive 2 treats instead of just one.
- The researcher then leaves the room for 5-10 minutes.
- Some children simply cannot wait; they eat the first treat.
- Others can wait and are rewarded with the second treat when the researcher returns.
In the years after running the first-ever Marshmallow Test study, researchers tracked the first participants’ academic and social progress. Those that had waited for the second treat were much more likely to excel in school and subsequently get good jobs. Those that did not wait saw less positive life outcomes.
As a result, it became established psychological wisdom that some kids are just innately better able to defer gratification. Like natural athletes’ superior physical abilities, they had a gift for seeing the long run and waiting for that second treat. This translated into working harder in school for the eventual payoffs of better grades, which led to acceptance at better colleges, and so forth.
Then a University of Rochester researcher named Celeste Kidd, working in a homeless shelter during the Great Recession, had a novel and hitherto unexplored take on the Marshmallow Test. Perhaps children simply assess the reliability of their environment when they opt for one treat now versus two treats later. A child witnessing the uncertainty of their family’s homelessness would rationally eat the first treat since their world is so unreliable. Kidd crafted a two-part Marshmallow Test that drew the reliability of the researcher into question in the child subject’s mind. Sure enough, these children more often ate the first treat straightaway.
The lesson here is that environment drives the decision-making that underpins delayed gratification. The Marshmallow Test doesn’t just measure innate ability. It also measures the child’s home environment in terms of both its trustworthiness/reliability and how much the adults in his/her life are helping them develop the skill of preferring a greater payoff at a later date.
We see the fingerprints of the Marshmallow Test everywhere in 2020’s capital markets action, an unsurprising finding considering that investing is essentially seeing through the “now” and staying focused on an uncertain “future” reward:
- Like the March 9th, 2009 lows for US stocks, the March 23rd lows this year marked “peak unreliability” in terms of investors’ judgements about their environment. In both cases, fiscal and monetary policy went to work to reestablish market confidence.
The result is that 2020’s market action post-lows played out almost exactly the same as back in 2009. As we close out the year, the S&P 500 is up 67 percent from the lows. On the same day in 2009, the index was up 64 percent.
- Given the lack of modern-day historical comparisons to forecast the virus’ effect on the US economy, policymakers had to go big – really big – on remedies to reestablish and maintain citizens’ perceptions of their reliability in a crisis. The CARES Act was 2x the size of 2009’s ARRA fiscal package. The Fed waded into the corporate bond market for the first time ever.
- There’s a funny quirk in economics called the “Paradox of Thrift”. It reminds us that GDP growth off a cyclical bottom requires consumers to actually shift their behavior from hoarding marshmallows (i.e., cash savings) to eating them again. This requires them to feel their jobs are secure and their personal finances are in decent shape. As with the prior point, policymakers have to do whatever they can to make consumers feel confident the second marshmallow will show up.
Takeaway: creating a sense of economic stability during a global pandemic did not come cheap and the final bill is still unknown, but the Marshmallow Test clearly shows that people must judge their environment as generally reliable before any recovery can take place. Without that confidence, they consume as little as possible and invest only for the return of their capital rather than a return on that capital.
Data Story: The bottom line is the bottom line.
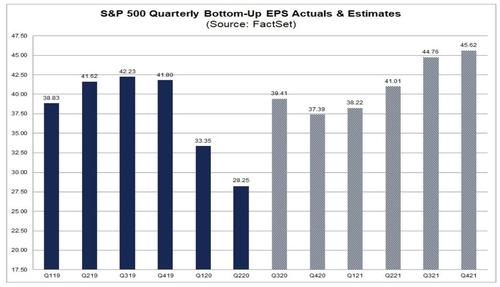
I think everyone reading this note has a favorite one-chart explanation for why US/global stocks did what they did in 2020. This is ours – actual and projected quarterly earnings for the S&P 500 from Q1 2019 through Q4 2021 – courtesy of FactSet’s Earnings Insight Report.
A few thoughts on this data:
#1: That trough in Q2 2020 of $28.25/share annualizes to $113/share. This is not actually anything close to a “recessionary” level of S&P 500 earnings. It is, in fact, pretty much the average of 2013 and 2014’s results ($115/share) albeit much lumpier (Tech earnings strong, everything else pretty meh).
#2: While the $39.41/share for Q3 2020 is still shaded as an estimate, it’s pretty much a done deal and is actually higher than pre-pandemic Q1 2019’s $38.82. There are many reasons why US corporate earnings power is higher now, ranging from lower interest rates to fiscal stimulus to cost cutting to reduced competition from small businesses. Regardless, this is a remarkable snapback and fits exactly with what you see when you pull up an S&P 500 price chart for 2020.
#3: As for which of those bars matters most to stock prices as we go into 2021, it’s strictly Q3 and Q4 2021’s $45-$46/share and all we know for sure is that those numbers are wrong. Remember: these are based on Wall Street analysts’ single-company financial models. In good times, the Street is too high with their numbers. Coming off bad times, analysts are always too low. Their caution at these points is understandable – estimating earnings leverage off a bottom is hard. The uncertainties of the global pandemic make it doubly so going into next year. That’s why even after the companies of the S&P 500 beat their Q3 2020 estimates by an average of 20 percent, Wall Street only increased their Q3/Q4 2021 numbers by 2 percent.
Takeaway: for all the attention paid to monetary and fiscal policy this year, corporate earnings are the real cornerstone at the foundation of the US equity story. Yes, low interest rates and stimulus checks helped, and will do so again in 1H 2021. However, it is the pace of recovery in 2H 2021 and how that flows through 500 companies’ income statements that will determine where the S&P will go next year.
Disruption Story: Undiversified Returns
A few quick observations to start the last chapter of today’s Story Time:
#1: The S&P 500 exits 2020 much less diversified than where it started the year.
- Technology now has a 27.7 percent weighting in the index, up 4.5 points from December 31st, 2019.
- The only other sectors to gain share were Consumer Discretionary (up 3 points to 12.8 percent) and Communication Services (up 40 basis points to 10.8 percent).
You can thank Amazon for the former increase (up 78 percent YTD, now 4.5 percent of the index) and Google/Facebook (each up 30-32 pct YTD, 5.4 pct of the index combined) for the latter.
- Financials had the largest absolute decline in terms of weighting, with a 2.6 point drop to 10.3 percent of the index. Energy had the largest relative decline, from a 4.4 percent weighting to 2.3 percent, and it is now the smallest sector in the entire S&P 500.
#2: The best performing super-cap stock in US markets was not in the S&P 500 until December 21st.
- Tesla is up 730 percent year to date.
- That is more than double Etsy, the best performing S&P 500 stock of the year, which is up 314 percent.
- Tesla is essentially unchanged since its S&P addition at the close on December 18th. It is 1.6 percent of the S&P 500 today.
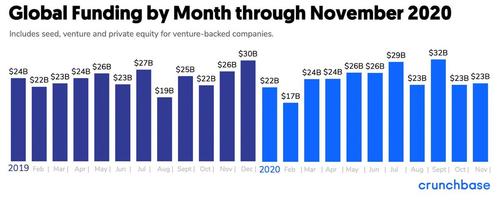
#3: Global venture capital investment in 2020 will be down slightly versus 2019 (-5.7 percent through November, to $246 billion YTD), but the pace of deal flow remains robust.
Here is Crunchbase’s data by month for the last 2 years:
Takeaway (1): these 3 points tell, in reverse order, a story about how disruptive innovation is eating stock indices in much the same spirit as Marc Andreessen’s 2011 observation that “Software is eating the world”. Venture capital is plowing +$250 billion/year into tech-enabled disruption. The best of these investments usually go public. But then, the most widely tracked US stock index will ignore them until they 1) season for a year or so and 2) turn a profit. Once added to the S&P 500, they will join all the other disruptors that have been pulling market cap away from the disrupted for the last decade.
Takeaway (2): even as we embrace disruption as an investment theme, we recognize that Tech + Amazon, Google and Facebook roll up to a 38 percent weighting in the S&P 500 and that is the index’s Achilles heel as we start 2021. If “disruption” treads water all year, the “disrupted” will have to be up 16 percent just to see the S&P 500 rally by 10 percent. If everything goes just right, as we outlined in “Data”, that is certainly possible. But having close to 40 percent of a portfolio in “Tech Plus” – even if it is a widely held passive index – is not a comfortable way to start the new year.
* * *
Sources/Further Reading:
A 2014 Interview with Walter Mischel about the Marshmallow Test: https://www.theatlantic.com/health/archive/2014/09/what-the-marshmallow-test-really-teaches-about-self-control/380673/
Crunchbase data: https://news.crunchbase.com/news/funding-recap-november-2020/
Marc Andreessen’s WSJ piece on software eating the world: https://www.wsj.com/articles/SB10001424053111903480904576512250915629460
Tyler Durden
Thu, 12/31/2020 – 14:00
via ZeroHedge News https://ift.tt/37ZwGE1 Tyler Durden

