The Fed Explains Why Stocks Melt-Up In Overnight Trading
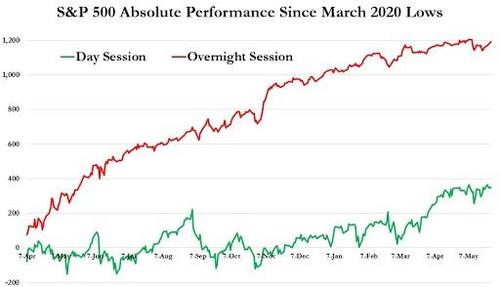
By now everyone has seen some iteration of this chart (most recently discussed here), which shows that whereas stocks are generally flat over longer periods of time during the regular “cash”, or day session, they tend to melt up during the overnight hours when liquidity is far lower and when the “pajama trades” come out and play.
And while there is no single, widely accepted reason for this “overnight drift”, the post-closed meltup phenomenon has been one of the most popular and recurring strategies in equity markets, with many traders selling spoos when the day session begins and then re-buying at the market close in pursuit of scarce alpha.
Today, DataTrek’s Nicholas Colas goes right after the $64 trillion question and asks “why do US stocks so often seem to rally overnight rather than during regular trading hours?” He answers by pointing to an analysis published today by the New York Fed which has some notable observations and makes an interesting conclusion..
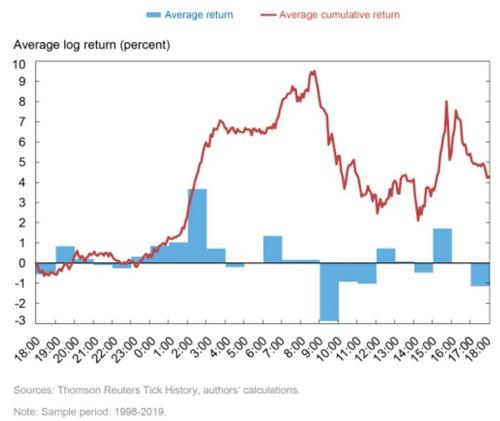
First, here is what the Fed dubs the “Overnight Drift”. The chart below shows average daily S&P 500 futures returns by hour from 1998 – 2019. The time stamps on the X axis are East Coast US time, starting at 6 pm local. As you can see, the largest returns (when the red line goes parabolic) are from 2am to 3am. During regular trading hours (930 to 1600, right side of the graph) average cumulative returns are basically flat.
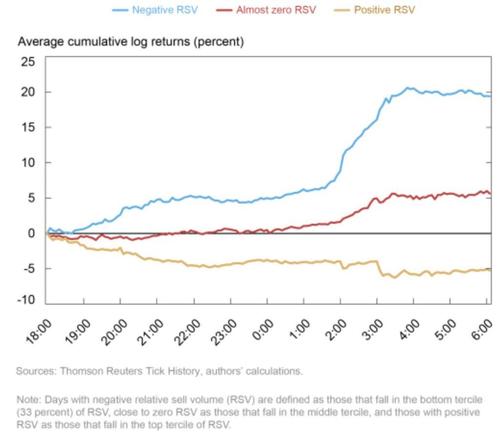
The Fed attributes this “Drift” to US equity market makers absorbing excess supply during selloffs at discounted prices going into the 4:00 pm close, which in turn creates an artificially low S&P closing price. The chart below shows the “Overnight Drift” broken down by days with high “RSV” (Relative Signed Volume, the percent of sell imbalances) versus those with no RSV or negative RSV (lots of buy interest at the close). Sure enough, days with high levels of selling at the close have a more pronounced positive “Overnight Drift”.
Takeaway: to the Fed’s thinking, the Overnight Drift is caused by non-US traders sniffing out artificially discounted closing S&P prices and arbitraging them away (albeit with some risk) before the next trading day in the States. As for a practical takeaway, the first chart we showed you says that on average you’re often better off selling equity positions at the open and putting in your Buy tickets in the middle of the afternoon. Market events can always subvert that approach, of course, but on average it has been a productive rule set to follow.
Sources: Fed Overnight Drift analysis: https://libertystreeteconomics.newyorkfed.org/2021/05/the-overnight-drift-in-us-equity-returns.html
Tyler Durden
Thu, 05/27/2021 – 19:00
via ZeroHedge News https://ift.tt/2SBFryJ Tyler Durden


