Goldman Blows Away Expectations With Blockbuster Trading, Investment Banking Quarter
With most big banks reporting solid earnings (with the possible exception of JPM which had some stumbles and the typical exception of Wells Fargo), all eyes were on Goldman Sachs today which was expected to round out the Q3 big bank reporting with solid numbers. What it reported was nothing short of blockbuster, with the company smashing expectations in virtually every segment.
Here are the big picture highlights:
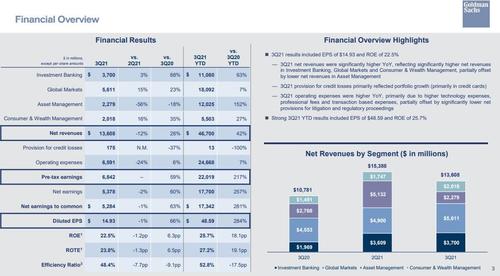
- Net revenue $13.61 billion, smashing estimates of $11.60 billion, and coming above the top end of the estimate range of $10.51 billion to $12.74 billion.
- Revenues were 26% higher than the third quarter of 2020 and 12% lower than the second quarter of 2021. The increase compared with the third quarter of 2020 reflected significantly higher net revenues in Investment Banking, Global Markets and Consumer & Wealth Management, partially offset by lower net revenues in Asset Management.
- EPS $14.93, crushing estimates of $10.11
Drilling down also showed nothing but beats:
- Investment banking revenue $3.55 billion, beating estimates of $2.85 billion; this was the second highest quarterly net revenues on record, “reflecting record quarterly net revenues in Financial advisory and continued strength in Underwriting”
- Trading rev. $5.61 billion, beating estimates of $4.14 billion; The number reflected strong performance in Equities, “including
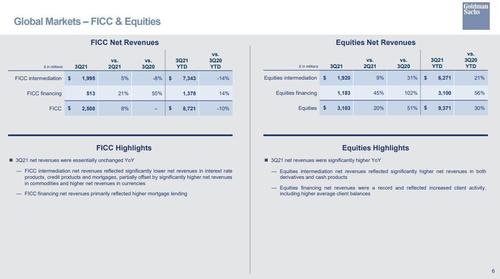
record Equities financing net revenues, and the second highest Fixed Income, Currency and Commodities (FICC) financing net revenues.” - FICC sales & trading revenue $2.51 billion, beating estimates of $1.95 billion; driven by revenue from mortgage lending but offset by lower revenues in FICC intermediation “reflecting significantly lower net revenues in interest rate products, credit products and mortgages, partially offset by significantly higher net revenues in commodities and higher net revenues in currencies”
- Equities sales & trading revenue $3.10 billion, beating estimates $2.21 billion, “reflecting increased client activity (including higher average client balances), and Equities intermediation, reflecting significantly higher net revenues in both derivatives and cash products”
- Net interest income $1.56 billion, beating estimates $1.43 billion
- Compensation expenses $3.17 billion, beating estimates $3.44 billion
Commenting on the earnings, CEO David Solomon said that “the third quarter saw strong operating performance and an acceleration of our investment in the growth of Goldman Sachs. We announced two strategic acquisitions in our Asset Management and Consumer businesses which will enhance our scale and ability to drive higher, more durable returns. Looking forward, the opportunity set continues to be attractive across all of our businesses and our focus remains on serving our clients and executing our strategy.”
Unlike other major banks, Goldman’s provision for credit losses was modest at just $175 million for the third quarter of 2021, compared with $278 million for the third quarter of 2020 and a net benefit of $92 million for the second quarter of 2021. The third quarter of 2021 primarily reflected provisions related to portfolio growth (primarily in credit cards), while the third quarter of 2020 reflected reserve increases from individual impairments related to wholesale loans and growth in credit card loans, partially offset by reserve reductions from paydowns on corporate lines of credit and consumer installment loans. The firm’s allowance for credit losses was $4.17 billion as of September 30, 2021.
Taking a closer look at the various segments, we start with…
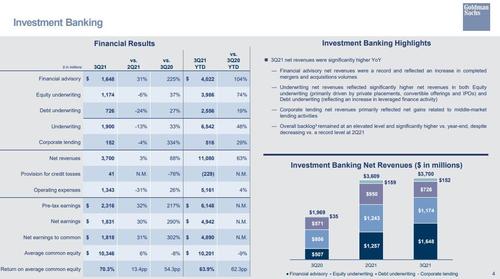
Investment banking, where net revenues were $3.70 billion for the third quarter of 2021, 88% higher than the third quarter of 2020 and 3% higher than the second quarter of 2021. The increase compared with the third quarter of 2020 reflected significantly higher net revenues in Financial advisory, Underwriting and Corporate lending.
The $3.70BN in revenue consisted of:
- Financial Advisory: $1.65BN
- Underwriting: $1.90BN
- Corporate Lending: $152MM
As with other banks, the increase in Financial advisory net revenues “reflected an increase in completed mergers and acquisitions volumes. The increase in Underwriting net revenues was due to significantly higher net revenues in both Equity underwriting, primarily driven by private placements, convertible offerings and initial public offerings, and Debt underwriting, reflecting an increase in leveraged finance activity. The increase in Corporate lending net revenues primarily reflected net gains related to middle-market lending activities.
That said, the firm’s backlog was lower compared with the end of the second quarter of 2021, but remained significantly higher compared with the end of 2020.
* * *
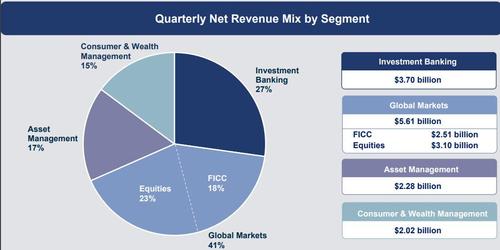
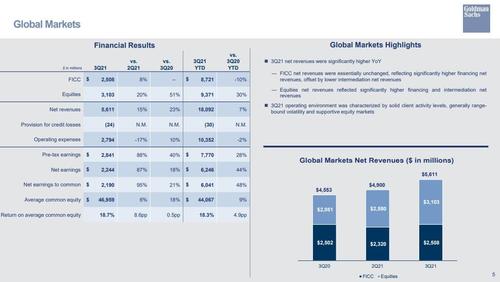
Global Markets generated net revenue of $5.61 billion for the third quarter of 2021, 23% higher than the third quarter of 2020 and 15% higher than the second quarter of 2021.
- Net revenues in FICC were $2.51 billion, essentially unchanged compared with the third quarter of 2020. Net revenues in FICC financing were significantly higher, primarily from mortgage lending. Net revenues in FICC intermediation were lower (at $2.00BN), reflecting significantly lower net revenues in interest rate products, credit products and mortgages, partially offset by significantly higher net revenues in commodities and higher net revenues in currencies. Another $513MM in FICC revenue came from financing.
- Net revenues in Equities were $3.10 billion, 51% higher than the third quarter of 2020, due to significantly higher net revenues in both Equities financing ($1.18BN), reflecting increased client activity (including higher average client balances), and Equities intermediation ($1.92BN), reflecting significantly higher net revenues in both derivatives and cash products.
* * *
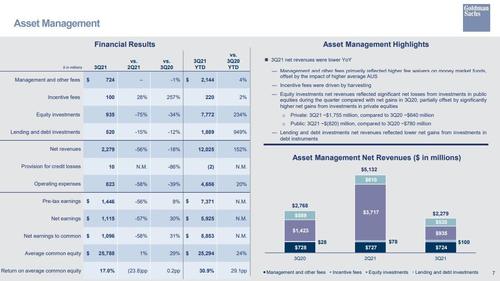
Asset Management revenues were $2.28 billion for the third quarter of 2021, 18% lower than the third quarter of 2020 and 56% lower than a strong second quarter of 2021. The decrease compared with the third quarter of 2020 was primarily driven by significantly lower net revenues in Equity investments ($935MM). In addition, net revenues in Lending and debt investments ($520MM) were lower, while Incentive fees ($100MM) were higher. The decrease in Equity investments net revenues reflected significant net losses from investments in public equities during the quarter compared with net gains in the third quarter of 2020, partially offset by significantly higher net gains from investments in private equities. The decrease in Lending and debt investments net revenues reflected lower net gains from investments in debt instruments. Management and other fees ($724MM) were essentially unchanged, primarily reflecting higher fee waivers on money market funds, offset by the impact of higher average assets under supervision. The increase in Incentive fees was due to harvesting (i.e. selling).
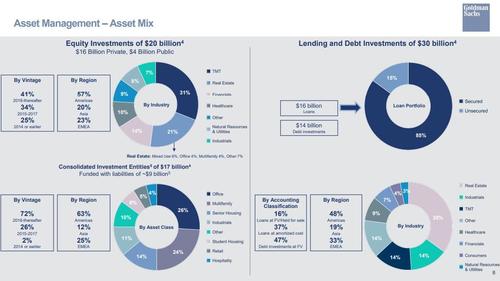
Here is a snapshot of Goldman’s asset mix:
* * *
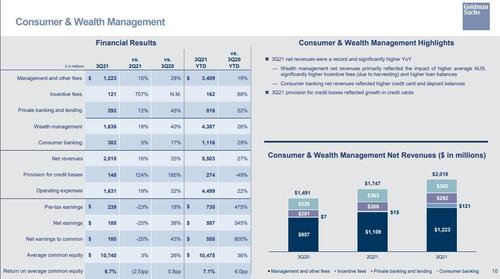
While a far smaller component of the bank’s revenues, Consumer & Wealth Management generated revenues of $2.02 billion for the third quarter of 2021, 35% higher than the third quarter of 2020 and 16% higher than the second quarter of 2021. Net revenues in Wealth management were $1.64 billion, 40% higher than the third quarter of 2020. Management and other fees were significantly higher, primarily reflecting the impact of higher average assets under supervision. Incentive fees were significantly higher, due to harvesting, and net revenues in Private banking and lending were higher, primarily reflecting higher loan balances. Net revenues in Consumer banking were $382 million, 17% higher than the third quarter of 2020, reflecting higher credit card and deposit balances.
Stepping away from revenues, Goldman reported that total operating expenses were $6.59 billion for the third quarter of 2021, 6% higher than the third quarter of 2020 and 24% lower than the second quarter of 2021. The firm’s efficiency ratio for the first nine months of 2021 was 52.8%, compared with 70.3% for the first nine months of 2020.
The increase in operating expenses compared with the third quarter of 2020 was due to higher technology expenses, professional fees, transaction based expenses and market development expenses. These increases were partially offset by significantly lower net provisions for litigation and regulatory proceedings. Compensation and benefits expenses were also slightly higher.
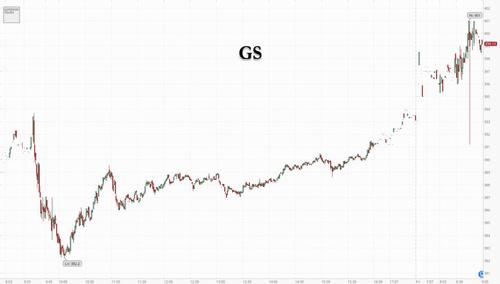
While there was a bit of a mystery surrounding Goldman’s disclosure that “Equity investments net revenues reflected significant net losses from investments in public equities during the quarter compared with net gains in the third quarter of 2020”, the market was clearly content with the overall performance, and especially the surge in Ibanking advisory fees and equity trading, and as a result, Goldman stock jumped in the premarket, topping $400 and not far from its all time high of $420 hit back in August.
Goldman’s Q3 presentation pdf can be found here.
Tyler Durden
Fri, 10/15/2021 – 09:05
via ZeroHedge News https://ift.tt/3j7K1PN Tyler Durden
