Where Are We In The Market Cycle?
Authored by Jesse Felder via TheFelderReport.com,
The following blog post was adapted from a recent Market Comment featured on The Felder Report PREMIUM.
Lately, I’ve started to notice many signs suggesting we are now well past the peak in risk appetites. To begin with, Citi’s panic/euphoria model, developed by Tobias Levkovich (and renamed in his honor after he sadly passed away last weekend), is a terrific visual representation of this phenomenon. In the early part of this year, it soared to a new high, taking out the high put in just over 20 years ago, at the height of the Dotcom Mania. It has since rolled over from that peak although it remains in extreme territory.
“Panic/Euphoria declined but remained in euphoria territory this week, and is generating a 96% historical probability of down markets in the next 12 months at current levels.” https://t.co/dzcN0TVMHX pic.twitter.com/Rc2OobQn2N
— Jesse Felder (@jessefelder) October 5, 2021
The popularity of Robinhood’s trading app is another important indicator. Bloomberg reports, “Robinhood’s app downloads, a proxy for account openings, fell 78% in the third quarter compared with the second, said JPMorgan analysts, citing tracking data from Apptopia… Daily active users plunged 40% during the period.” Animal spirits have clearly sustained a damaging blow in recent months; whether that blow proves fatal, though, will be revealed in time.
‘Robinhood’s metrics of active users and app downloads plunged during the third quarter, according to analysts at JPMorgan Chase & Co. While the company has previously flagged that activity would weaken, the drop seems far worse than expected.’ https://t.co/MbDPYsMbrI
— Jesse Felder (@jessefelder) September 30, 2021
The fact that interest in day trading is plummeting stands in direct contrast to the fact that interest in getting help for stock market gambling addiction is soaring. The Financial Times reports, “Felicia Grondin, acting executive director of the Council on Compulsive Gambling of New Jersey, said… her group’s 1-800-Gambler helpline has received an almost 50 per cent increase in calls related to day trading since the start of the pandemic.” This would seem to suggest we have moved from the party stage to the hangover stage of the mania.
‘Helplines of gambling addiction recovery groups have been ringing with a new kind of caller: day traders.’ https://t.co/uwdG3Qlikt
— Jesse Felder (@jessefelder) October 6, 2021
Perhaps the greatest beneficiaries of the party stage of the mania were Chamath Palihapitiya, self-proclaimed SPAC King and Cathie Wood, manager of the Ark Innovation ETF (ARKK). Palihapitiya has taken full advantage of animal spirits by launching a number of SPACs this year from which he has personally profited to an almost unbelievable degree. Similarly, Wood’s popular ETF has garnered a great deal of speculative assets recently, attracting nearly $10 billion in new money last year alone.
‘Investors pulled $905m from the Ark Innovation ETF (ARKK) contributing to a decline in assets under management of 13% from $22bn at the end of August to $19bn at the end of September.’ https://t.co/GyV4tvHUxC pic.twitter.com/MNzknoYXvA
— Jesse Felder (@jessefelder) October 7, 2021
However, as my brilliant friend, Peter Atwater, pointed out last week, Google searches for “Chamath” and “Cathie” peaked back in January and February of this year, at the very same time that many of these other indicators were in the process of peaking. As for Chamath’s SPACs, SPCE trades 64% below its February peak, OPEN is off 39% from its own peak put in the same month and CLOV is off 74% from its peak set back in June after an SEC investigation was disclosed.
So when was THE peak in investor sentiment?
Google Trends data suggests somewhere between “Chamath” and “Cathie”. pic.twitter.com/SmBkgNgZgY
— Peter Atwater (@Peter_Atwater) October 7, 2021
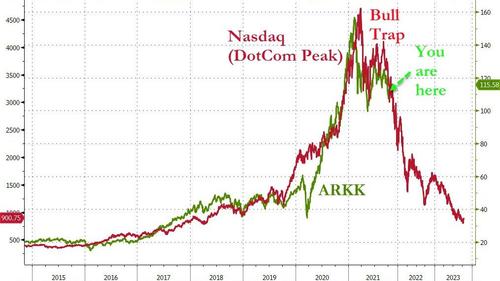
Similarly, investors have switched from shoveling cash into ARKK to pulling out nearly a billion dollars last month alone. And if history is any guide, it’s likely just the beginning. Julian Brigden tweeted a fascinating chart last week comparing the performance of ARKK to the Nasdaq 20 years ago.
So far so good! If we keep following this pattern, #arkk sells off back towards $100 https://t.co/dxf4HT3ea4 Then we get a solid bounce, before the next major leg lower, which takes us towards $60 https://t.co/BLatfeSUW8 pic.twitter.com/9YOk33tKp4
— Julian Brigden (@JulianMI2) October 4, 2021
The resemblance is striking and implies ARKK is on the verge of giving back all of its astounding gains made over the past couple of years.
Perhaps more importantly, it also suggests we now find ourselves in the October 2000 stage of the market cycle and there are some important similarities between then and now to support this thesis. Back then, it was becoming increasingly clear that March of that year represented the blow-off in sentiment. Stocks managed to hold up for another five or six months before officially rolling over into the bear market that saw dozens and dozens of the most popular stocks in the market fall 90% or more.
Where are we in the market cycle? pic.twitter.com/sxfWNvTHvc
— Jesse Felder (@jessefelder) October 13, 2021
Of course, history doesn’t repeat but it may be rhyming right now. In other words, we shouldn’t expect the market to follow the Dotcom Bust script word for word. We should understand, though, that there are a ton of signs pointing to a very specific stage of the broader market cycle. That would be well past the “euphoria” stage, into the “anxiety” stage, headed for the “denial” and “fear” stages which mark the official onset of a bear market.
Tyler Durden
Fri, 10/15/2021 – 08:20
via ZeroHedge News https://ift.tt/3j5fm5w Tyler Durden

