Why Goldman Expects A Huge Market Melt-up In The Coming Weeks
Below we excerpt from the latest Goldman”Tactical Flow-of-funds: October 2H” report by flow trader Scott Rubner who writes that he is “on FOMO Watch” and lays out the argument for a major market breakout in the coming weeks.
October 1H (S&P is +3.03% MTD ) = “We made it through the October __________ scare.” Word bank: Stagflation, China Property, Covid, Tapering, Supply Chain, Energy, Hiking, China, Growth, Higher rates, etc, etc.
Talking Points: (Positioning and Sentiment is UN-STRECHED), really un-stretched.
-
Un-emotional systematic CTA and VC equity re-leveraging given the decline in volatility: Sold -$96B of Equity over the last 1 month.
-
Un-emotional systematic, now covering shorts in fixed income (read positive NDX, which means positive SPX): Sold -$540B of FI over the last 1 month.
-
Discretionary shorting into expiry covering, GS PB.
-
Corporate buyback dry powder is the largest incremental buyer in the market.
-
401k quarterly equity inflows have not slowed
-
Generation I – (Generation Investor), the retail trader hugely pivoted back into secular growth.
-
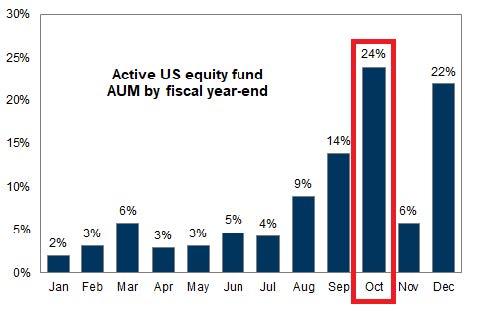
Mutual Fund year end is 10/29 – can’t report cash on the year-end statements?
-
2022 seems very difficult! There is a growing interest to try and catch-up to benchmark gains here in Q4.
-
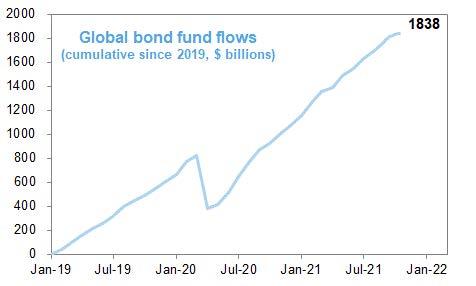
Bond inflows have now slowed to zero and credit logged their first outflows. $ looking for a home?
This is the biggest flow dynamic to know for November, and this kicks off aggressively following back earnings.
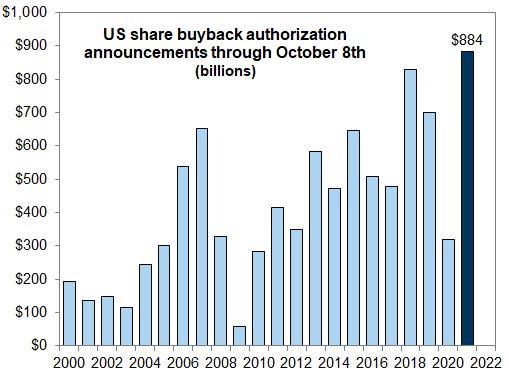
1. US corporates authorized +$884B YTD as of October 8th. This is YTD authorization record and exceeds the tax reform Euphoria of 2018. The Goldman buyback desk estimates FY authorizations will be $965B.
2. The GS buyback desk forecasts $887B worth of buyback executions for 2021. This would be the second highest year on record (after 2018).
3. The breakdown of executions per quarter is as follows: Q1 – $203B (actual), Q2 – $234B (actual), Q3 – $220B forecast, Q4 – $230B forecast.
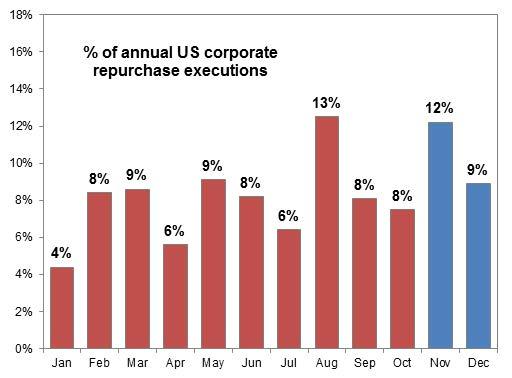
4. In Q4, the GS buyback desk estimates +$230B repurchases, this is broken down by +$70B in October during the blackout window using 10b5-1 plans and +$160B in November and December.
According to GS Research, November is the #1 month for buyback executions, November plus December is the best two month period of the year for executions.
5. 11/1 is the defacto start to the buyback window (65% of corporates are in the open window)
6. 11/8 is the GS official start to the buyback window (90% of corporates are in the open window).
7. There are 42.5 trading days in November and December including major vacation weeks and low liquidity.
8. The $160B of repurchases in the last two months of the year is ~$3.80B per day, every day. This is significantly front loaded into November (and should pace above >$4B).
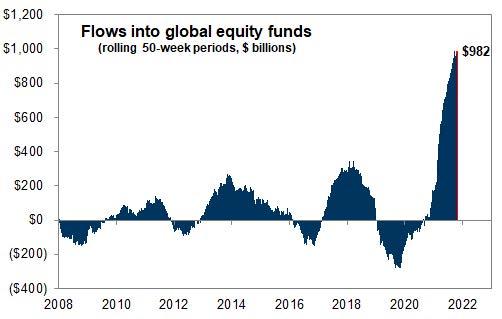
It’s not just buybacks… Equity Inflows – this has been the biggest market dynamic of 2021.
9.There have been +$774.50B global equity inflows YTD, the best year on record by a mile, in the 190 trading days ending on October 6th. This will be roughly $1 Trillion worth of inflows for 2021.
10. This is approximately +$4.10B worth of [retail] demand every single day of 2021.
11. My assumption is that these inflows will not slow (actually increase coming out of bonds), but lets say, same pace.
12. This is $8B worth of equity demand from corporates and retail, all else equal for the 42.50 trading days to close out the year. This before what I am typing below.
13. Bond inflows went to zero this week and logged credit outflows (Investment Grade, High Yield, and EM Debt) – looking for a home?

Melt-up checkdown: This is why I think there is risk now to the upside in November (this may get pre-traded in late October) 14.
Exposure is not high: GS HF PB Gross 177% (28th percentile 1-yr) and Net 62% (23rd percentile 1-yr)
On Wednesday (waiting on Thursday) – US equities on the GS Prime book saw the largest 1-day net buying since late August (+1.1 SDs vs. the average daily net flow of the past year), driven by short covers and to a lesser extent long buys (2 to 1).
Both Macro Products (driven by short covers) and Single Names (driven by long buys) were net bought and made up 74% and 26% of Thursday’s $ buying activity, respectively.
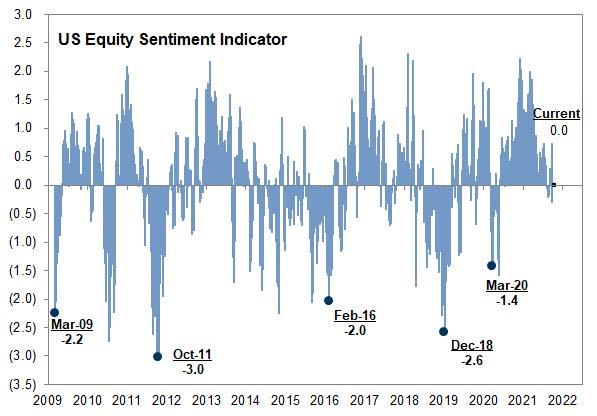
Sentiment = ZZZZs.
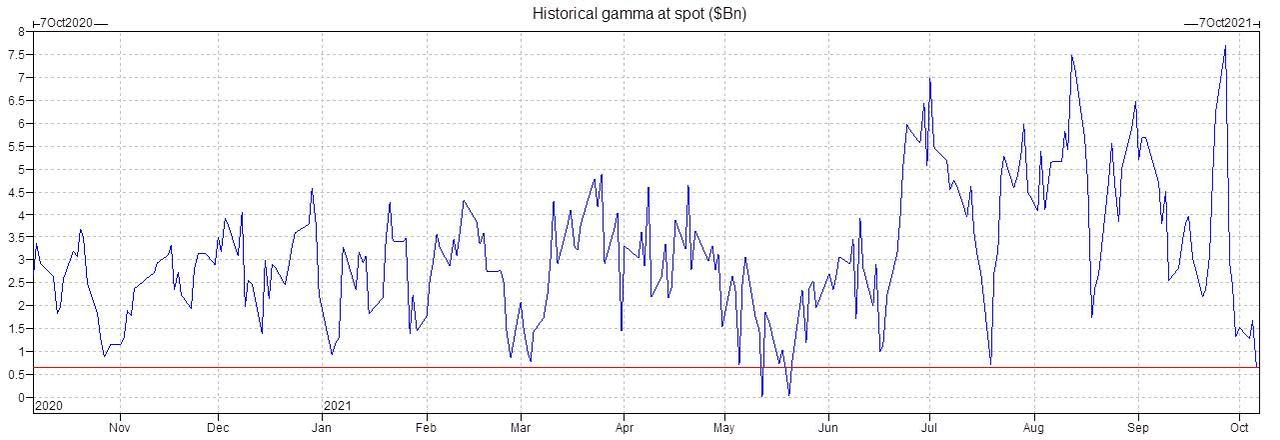
15. Gamma is not long: Current SPX long gamma = $1B vs. A high last week of $7.7B long. This is the 3rd lowest long of the year and a decline of $7B w/w. This has allowed the market move more freely and we really haven’t seen this little long position in the past year. I think dealers go short (finally) after today’s expiry.
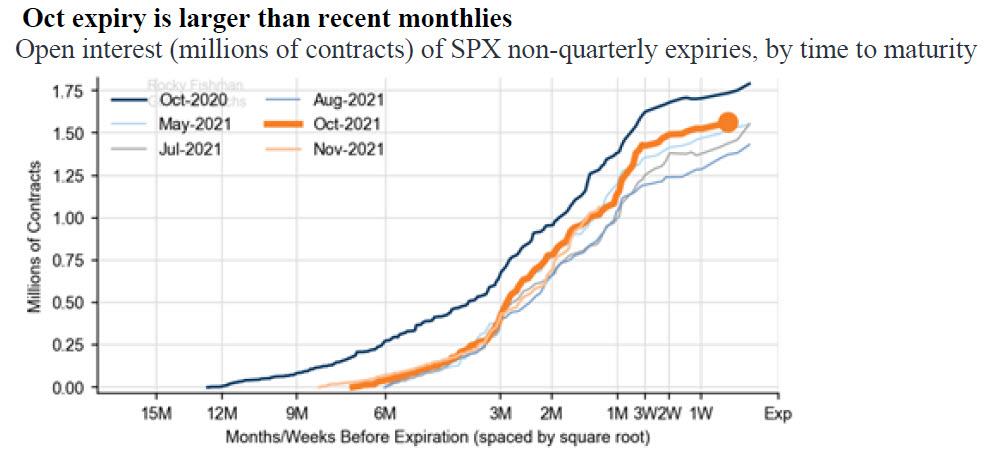
16. OpEx (Option expiry): $2.2 Trillion worth of option notional rolls off Friday and “everyone is looking for weakness into expiry trade.” After today’s expiry, I expect the market to move more freely, especially to the upside.
17. Current CTA positioning in Fixed Income: why do you care? This is an index construction issue. When CTAs short bonds (value > growth)…. when they cover, the whole index can move higher? My most important chart this week.
18. Performance has largely been difficult and 2022 is expected to be difficult. A big bulk of Mutual Fund year-end is at the end of October. Buy stocks w/ cash on sidelines?
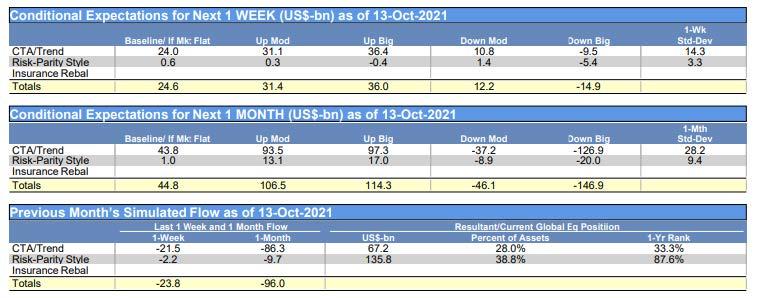
19. Systematic releveraging becomes the focus following the FLIP: Systematic equity strategies have sold $96B worth of equities over the past 1 month.
We have systematic strategies buying $44.8 Billion over the next month and $106.5 Billion if the market is up modestly, which is trending. This would roughly be a $200B swing, this is large.
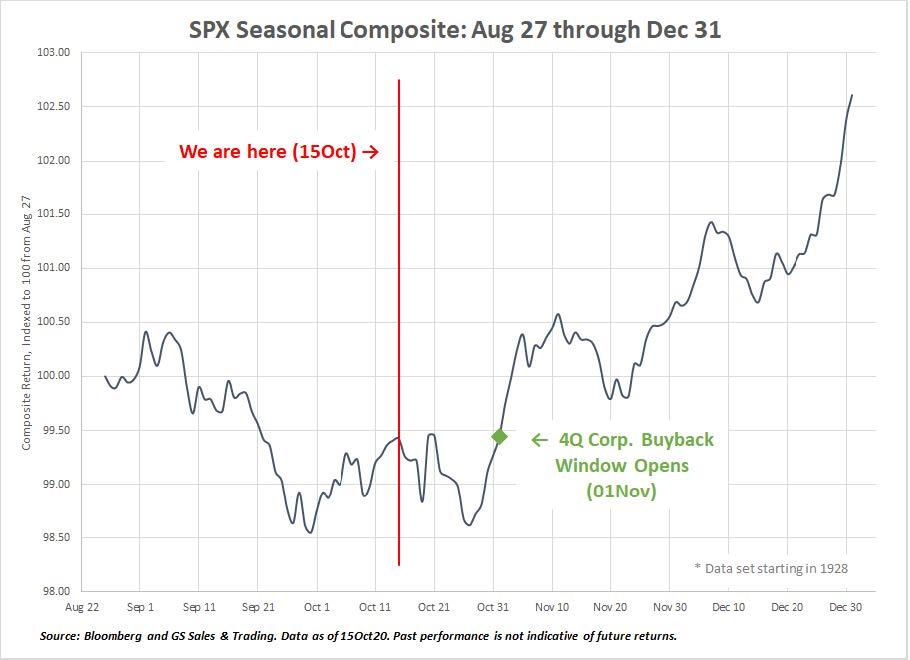
20. And then, there are seasonals which start to really kick in at the end of the month. You are here w/ the buyback window.
- I. Since 2020, there has been +$2.281 Trillion inflows into bonds and cash vs. +$578 Billion inflows into equities. 4x more inflows into Cash and Bonds.
- II. Since 2016, there has been +$4.609 Trillion inflows into bonds and cash vs. +$427 Billion inflows into equities. 11x more inflows into Cash and Bonds.
- III. Since 2011, there has been +$5.205 Trillion inflows into bonds and cash vs. +$748 Billion inflows into equities. 7x more inflows into Cash and Bonds.
I promised myself that I would never use the term “Great Rotation” again, that is the rotation out of bonds into equities, however this movement of capital is the most important dynamic that I am tracking right now. Global Bond funds saw the SMALLEST INFLOWS since Q1 this week. What level higher in bond yields stop this inflow all together (or possibly move to outflows?). Global equities logged another +$13B worth of inflows on the week. No change in tone.
- IV. There is a competition for dip alpha. Why did everyone want the -5% pullpack? Here is the data.
This recent stretch was the 8th longest streak without a -5% dip since 1930, lasting 226 trading days. There have been 34, five percent pullbacks since 1980, 1m, 3m, 6m returns have had positive hit rates of 74%, 82%, and 85% respectively
- V. Retail aggressively defended large cap tech and secular growth this week.
- VI. October Checklist continued below. (Index gamma smallest long of the year, sentiment ticks lower (again), shorts tick higher, systematic to re-lever above 4400, seasonals remain strong, and Q4 performance catch up vs. benchmarks).
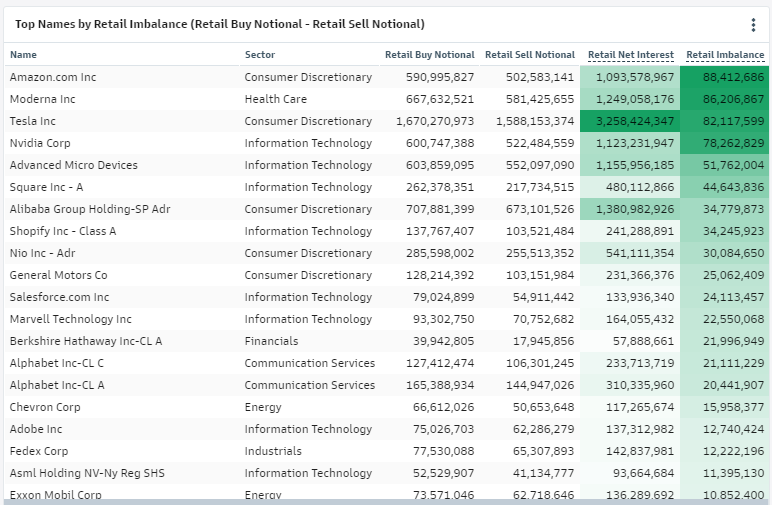
Who was the largest incremental buyer in the equity market this week?
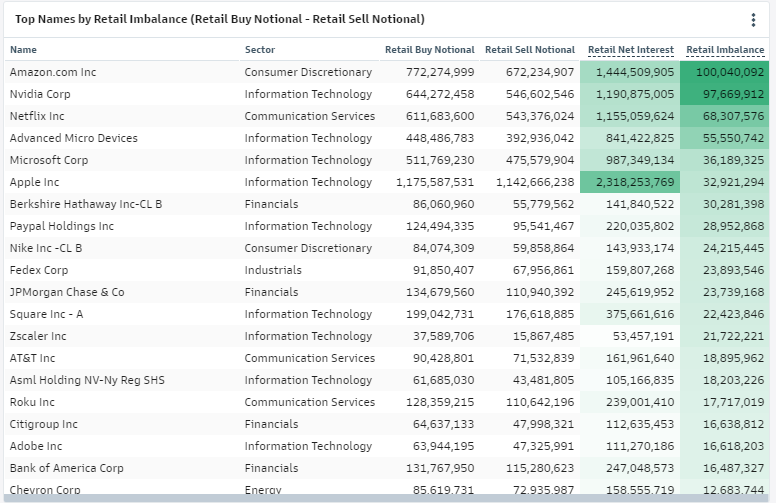
Retail traders made a huge pivot this week and have been buying the dip in large cap tech and secular growth.
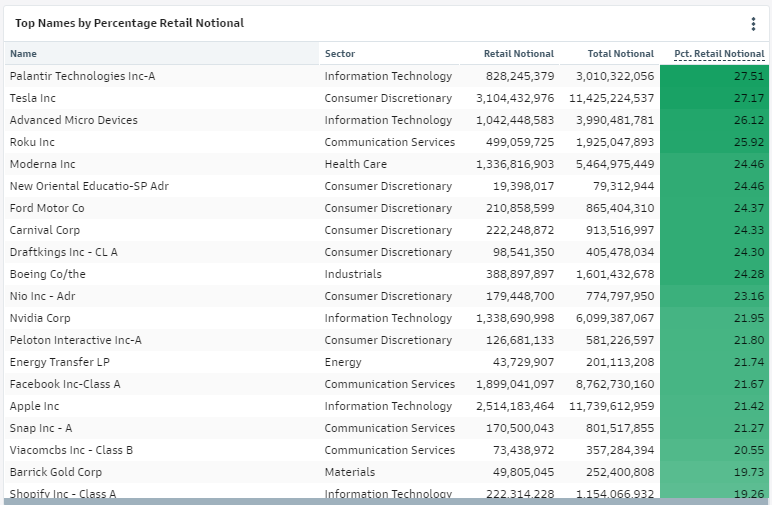
a. US single stock equities with the largest percentage of total volume traded by retail on Thursday October 8th, 2021.

b. US single stock equities with the largest retail net absolute buy skew on Thursday October 8th, 2021.
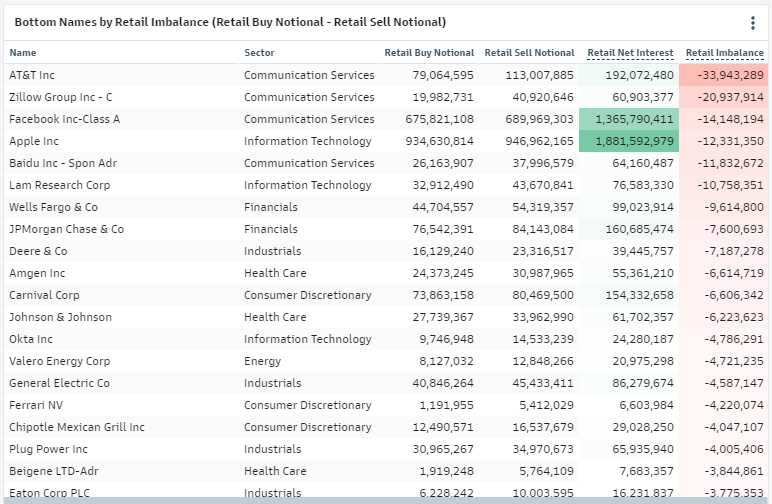
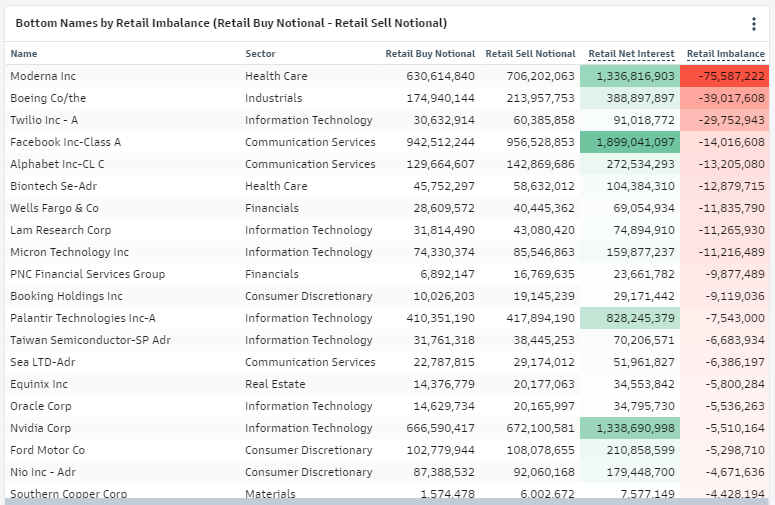
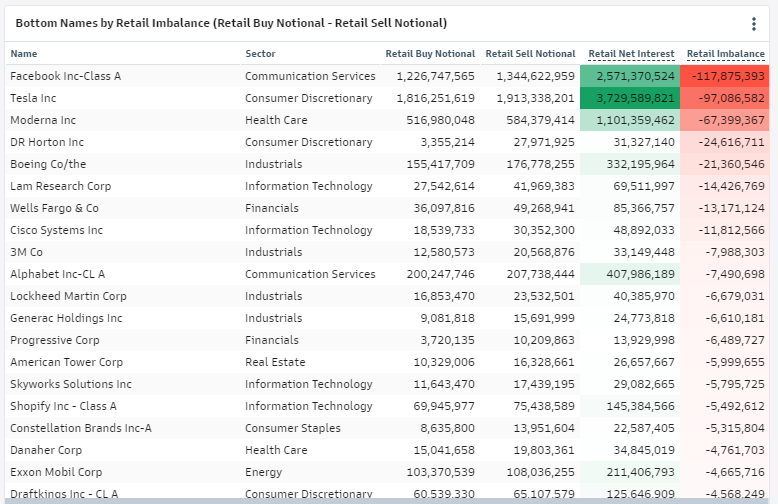
c. US single stock equities with the largest retail net absolute sell skew on Thursday October 8th, 2021.
e. US single stock equities with the largest percentage of total volume traded by retail on Wednesday October 6th, 2021.
f. US single stock equities with the largest retail net absolute buy skew on Wednesday October 6th, 2021.

g. US single stock equities with the largest retail net absolute sell skew on Wednesday October 6th, 2021.
h. US single stock equities with the largest percentage of total volume traded by retail on Tuesday October 5th, 2021.

i. US single stock equities with the largest retail net absolute buy skew on Tuesday October 5th, 2021.
j. US single stock equities with the largest retail net absolute sell skew on Tuesday October 5th, 2021.
Tyler Durden
Sun, 10/17/2021 – 20:35
via ZeroHedge News https://ift.tt/3AQnAEM Tyler Durden