A Tale Of Two QTs
Yesterday’s FOMC minutes confirmed that the Fed is serious about launch an early runoff of their massive, nearly-$9 trillion balance sheet. It reminded DB’s Jim Reid of two very different tales of Fed liquidity reversals over the last 25 years.
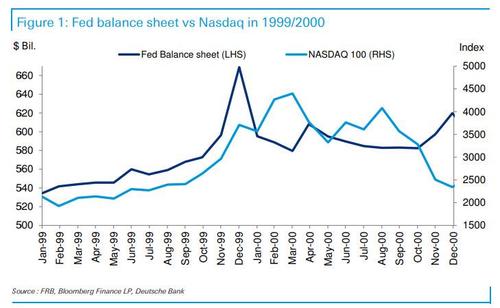
First, there are those who suggest that the last stage of the equity bubble of 1999/2000 and subsequent crash was encouraged by the Fed being petrified by the unknowns of the Y2K. They pumped in a huge amount of liquidity into the financial system in Q4 1999 which saw a big increase in the money supply and the Fed balance sheet, as shown below.
Then, as the Y2K bug failed to materialize, the Fed withdrew all that liquidity however, by then it was too late, they had lit the touch paper for the last stage of the bull market and while there are many potential reasons for the bubble bursting (including record valuations), there is a strong case to be made that the injection of, and then the withdrawing of, large liquidity was a big contributor to the end phase.
In some ways, Reid writes, the increase in the Fed balance sheet from around $570bn to $670bn in Q4 1999 seems quite quaint relative to what we saw post GFC and during Covid. This brings us to the modern day QT, or quantitative tightening, when in October 2017 the Fed started to reduce its balance sheet from around $4.47tn to a low of around $3.76tn at the end of August 2019, at which point a mini freakout and repo crisis took place when markets realized that there was not nearly enough reserves in the system to assure smooth operations for levered financial institutions like hedge funds and commercial banks.
That’s when the Hail Mary that is the covid pandemic emerged, and following the crash of March 2020, the Fed’s balance sheet exploded back up from around $4.15tn to $8.75tn. “Mind boggling numbers compared to 1999” as Reid puts it.
QT from 2017-2019 hardly had any impact on equities overall as can be seen in the second chart but there was a large sell-off in Q4 2018 when Powell commented that rates are a “long way” away from neutral which sparked panic that much more hiking was in stock, until Powell sharply pivoted on continued Fed hikes in January 2019. So, QT and hikes certainly interrupted the long equity bull market. For bonds, they initially sold off during QT but rallied hard in the second half of QT, mainly from when the equity market sold off in Q4 2018, and continuing after the Powell dovish pivot.
So, when we get QT in 2022, Reid asks “will it be more like 1999/2000 or 2018/2019?” Both were tough for markets but on a very different scale. We now have US equity valuations that are only rivalled in history by what we saw in 1999/2000. However, before we get too excited, liquidity is still very high and, as we saw in 2018/2019, it took a year of QT and a series of rate hikes to create major market problems.
Regardless, as Reid concludes, “it seems that the age of ultra, uber, ludicrously loose monetary policy is coming to an end. It’s inevitable markets will be impacted” while the timing is more debatable. In his 2022 Credit Outlook, Reid had a notable H1 widening on the Fed accelerating tightening beyond expectations but only a temporary one while the market adjusts. And while markets may be quick to reacot, the economic problems of tighter policy probably won’t be fully felt for a couple of years, at which point the Fed will likely proceed with the biggest easing cycle in history.
Tyler Durden
Thu, 01/06/2022 – 18:00
via ZeroHedge News https://ift.tt/3n324bI Tyler Durden

