S&P Levels To Watch As “Fed Speakers Lunge Around Like ‘Short Gamma’ Traders”
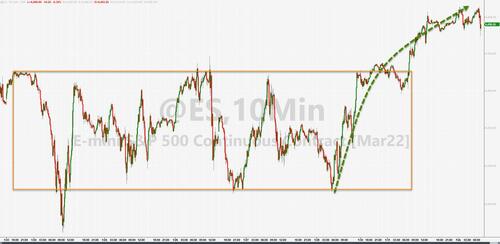
After the epic melt-up into month-end, during which the world and their pet rabbit was forced to cover or roll any and all downside hedges, the question now is what happens next?
Ahead of the now ‘common knowledge’ that Friday’s payrolls print is going to be a disaster (potentially a negative number) – and reassurances from various ‘experts’ that this will be ‘transitory’, Nomura’s Charlie McElligott comments that Fed Speakers are lunging around like “short Gamma” traders:
The Bostic “50bps” mis-headline-ing episode over the wknd having to then be “walked back” yesterday – followed by Fed’s Daly also then having to clarify early comments made just hours before yesterday as well – are stark reminders that the months ahead are going to get ugly w.r.t. Fed speak being over-interpreted as “forward guidance,” when in reality, their commentary is merely a reflection of extremely high inflation – and wages – convexity month-to-month.
I’ll say it again, they have to maintain “max optionality” for each meeting, and it will be completely dependent upon new data – thus, forward guidance beyond March is DEAD.
But in order to gauge where we are, McElligott explains first how we got here:
The story of Equities the past two days is one of a scramble to get Net Exposure back “up” and not get hurt both ways (after getting smacked on the move lower, they don’t want to miss the bounce higher either)—so yesterday saw funds cover Shorts / monetize Hedges and extend repositioning to play “Offense”—but DEFINITELY with a risk that funds are chasing a “mechanical” bid to a certain extent. Thus:
1) an absolutely explosive short-covering rally (reducing dynamic hedges across singles, baskets, ETFs and futures)…
…crunched further by “mechanical” bid from 2) relentless “Long Delta” options expressions (Sell Puts / Monetize Hedges, Buy Calls / RRs) creating futures to BUY
and 3) Vols getting absolutely cratered (VIX term structure sees spot below futs for the first time in 2w),
4) ongoing resumption of large $buyback flows as we roll through earnings’ blackouts—all of which fed into one-another and exacerbated 5) ongoing Dealer “short Gamma” trading then chasing to the upside (albeit now sharply off worst levels and with spot closer now to “Gamma neutral” levels for the first time in weeks)
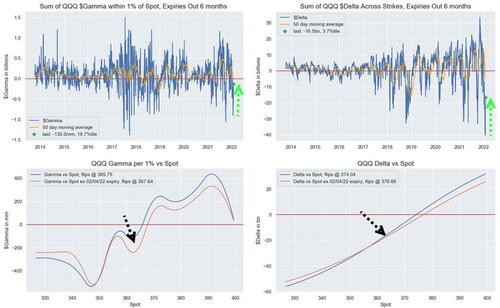
This was particularly obvious in “eye of the Equities storm” Growth / Tech via Nasdaq QQQ options, where already entering the day, Dealers were “max short Gamma vs spot” (ref QQQ @ $352 as of Friday’s close) – which matters massively when the associated Net (short) $Delta was so extreme as well (entering Monday at -$31.1B, 0.5%ile)
This above extreme “short Gamma, max short Delta” dynamic wass pure “fuel for a melt-up,” as Dealers had to chase higher prices to stay hedged, hence dreaded “accelerant flows” which buy into strength—but ESPECIALLY against the backdrop of the ENORMOUS market impact created by the rolling-down in the big QQQ Put Spread over the past 3 days, which net / net bot about ~$3B in Delta and yesterday alone sold ~ $3.5mm Vega; now, look at the move off the prior “extremes” in both $Gamma and $Delta.
So, “real pain” in Downside Puts from capitulation / monetization, where Vols were face-melted and then exacerbated in conjunction with the Spot rally = which meant substantial “Vanna” impact on Dealer covering of short-hedges as those out-of-the-money Puts lost Delta, bleeding & decaying; ultimately, it is forcing owners of downside hedges to close or roll.
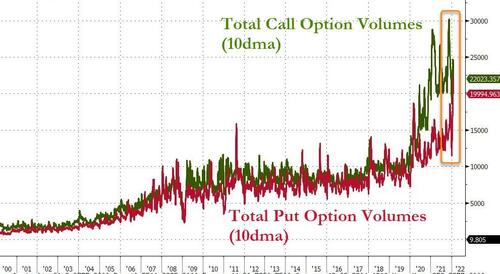
The recent grab into puts (10-day average volume) has collapsed the spread versus calls…
…and helped create the energy for an explosive rally.
Generally speaking, McElligott notes that any and all “dynamic hedges” laid out in previous days were blistered on Monday – look at the 1d returns across the Nomura + Wolfe “Shorting Baskets,” which mind-you have been PHENOMENAL in “doing their jobs” over the past few months and mitigating the destruction in popular “longs”:
-
Unprofitable IPO Basket +8.7% / + 4 z-score (1Yr rel)
-
Short Hit List Basket +8.4% / +3.6 z-score
-
IPO Lockup Basket +6.2% / +3.3 z-score
-
Potential Tax Loss Basket +6.1% / +3.6 z-score
-
Fusion Short Basket +4.7% / +3.8 z-score
-
Highest Short Interest Basket +4.0% / +2.8 z-score
-
Pricing-Power Basket +3.6% / +3.1 z-score
And to be fair, anything that has been hammered per recent market zeitgiest was absolutely RIPPED HIGHER:
-
Unprofitable Tech +10.1%
-
ARKK +9.3%
-
Post-SPAC Merger +9.0%
-
Recent IPOs +7.2%
-
High Realized Vol +6.7%
-
Retail Favorites +5.4%
-
NYFANG+ 5.4%
-
High Options Volume Basket +5.3%
-
Hedge Fund Overweights +4.5%
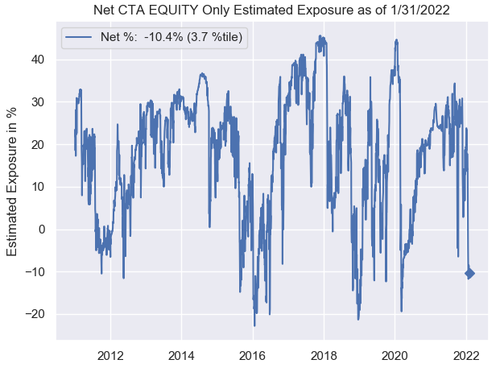
Which, the Nomura strategist notes, has pushed equity indices nearer to “flip long” levels for CTA positioning:
-
Nikkei 225, currently -100.0% short, [27050.0], buying over 27402.32 (+1.30%) to get to -62% , more buying over 29257.07 (+8.16%) to get to 38% , flip to long over 29257.07 (+8.16%), max long over 29257.07 (+8.16%)
-
S&P 500, currently -23.4% short, [4504.25], more selling under 3680.15 (-18.30%) to get to -62% , max short under 3679.7 (-18.31%), buying over 4581.42 (+1.71%) to get to 38% , more buying over 4581.87 (+1.72%) to get to 100% , flip to long over 4581.42 (+1.71%), max long over 4581.87 (+1.72%)
-
Euro Stoxx 50, currently -23.4% short, [4143.0], more selling under 3359.24 (-18.92%) to get to -62% , max short under 3358.83 (-18.93%), buying over 4235.07 (+2.22%) to get to 38% , more buying over 4235.49 (+2.23%) to get to 100% , flip to long over 4235.07 (+2.22%), max long over 4235.49 (+2.23%)
-
Russell 2000, currently -100.0% short, [2024.4], buying over 2079.58 (+2.73%) to get to -62% , more buying over 2311.95 (+14.20%) to get to 38% , flip to long over 2311.95 (+14.20%), max long over 2311.95 (+14.20%)
-
HangSeng CH, currently -100.0% short, [8365.0], buying over 8840.16 (+5.68%) to get to -38% , more buying over 10686.66 (+27.75%) to get to 62% , flip to long over 8841.0 (+5.69%), max long over 10686.66 (+27.75%)
-
NASDAQ 100, currently -23.4% short, [14905.0], more selling under 13072.21 (-12.30%) to get to -62% , max short under 13070.72 (-12.31%), buying over 15759.93 (+5.74%) to get to 38% , more buying over 15761.42 (+5.75%) to get to 100% , flip to long over 15759.93 (+5.74%), max long over 15761.42 (+5.75%)
CTA Trend positioning still largely “short” across Global Equities signals:
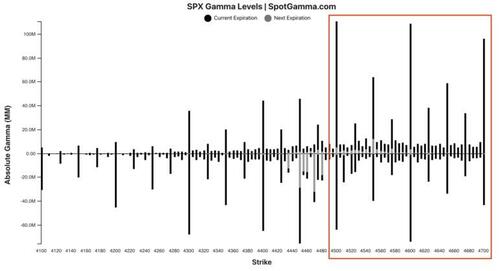
SpotGamma confirms McElligott’s view that this most recent meltup move as primarily short covering (i.e. puts closed = dealers buy back short stock), which makes the rally unstable. Closing above 4500 likely changes the mechanics of dealer flow from negative to positive gamma, which when combined with a decline in implied volatility[IV] could add to an equity tailwind.
4500 is a critical level for the S&P. As you can see in the chart below, at strikes >=4500 the size of the call gamma bars increases substantially. It is call gamma that supplies volatility-suppressing hedging flow and an equity tailwind. In that same light we do see 4500 as something of a resistance area, and the primary equity inflow will need to transition from short covering to real buyers to puncture this area.
However, from an options perspective there does not appear to be anything to materially support the markets below. As it does seem that puts have been closed (or at least “weakened” through time & IV reduction), a subsequent selloff could be more violent, and have a lower, lower bound.
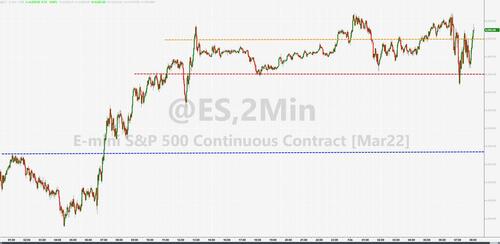
So, 4581 is a key level for the S&P 500 to extend gains; 4500 is the line in the sand; and to the downside triggers, 4480 is the Vol Trigger, and 4437 is the 200DMA.
Tyler Durden
Tue, 02/01/2022 – 11:53
via ZeroHedge News https://ift.tt/B5vYFGCKX Tyler Durden
