Why Is The VIX So Low? A Surprising Answer Emerges In The Market’s Microstructure
One of the most frequent questions tossed around Wall Street trading desks (and strip clubs), and which was duly covered by Bloomberg recently in “Fear Has Gone Missing in Wall Street’s Slow-Motion Bear Market“, is why despite the crushing bear market and the coming recession, does the VIX refuse to rise sustainably above 30, or in other words, why is the VIX so low?
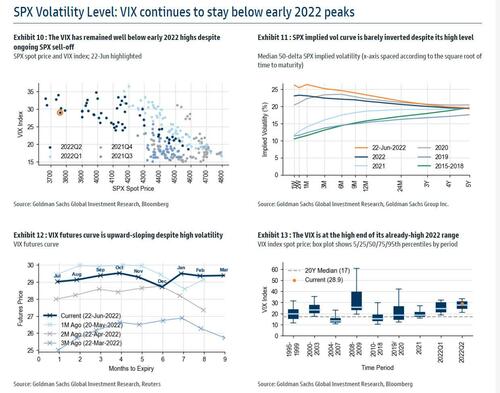
As Goldman’s Rocky Fishman wrote in a recent note “Option Markets Take the SPX Bear Market in Stride” (available to professional subs), “one of the most popular questions we have received is why the VIX hasn’t surpassed its March peak (36) despite the SPX being lower than it was in March and realized vol being higher than it was in March.”
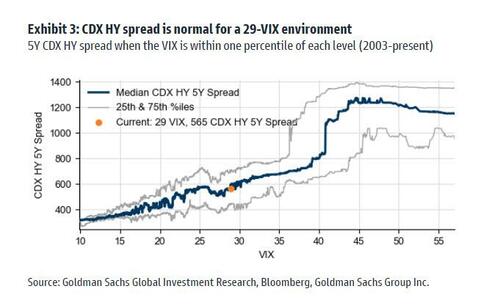
Here, Fishman notes that implied volatility was unusually high in March, and the current VIX level (29) is only slightly low for the current level of realized vol. Furthermore, a VIX around 30 typically happens with the 5Y CDX HY spread above 600, and although it has risen steadily it’s currently in the mid 500’s.
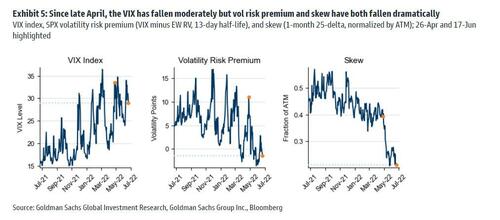
Meanwhile, even as the VIX has fallen moderately since late April, both vol risk premium and skew have both fallen dramatically.
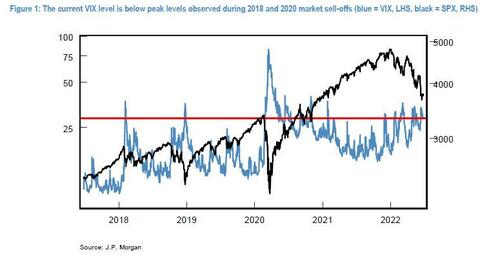
Picking up on this quandary, overnight JMorgan also joined the discussion with its analyst Peng Cheng laying out his own thoughts on why the VIX remains so low (note is also available to professional subs), and similar to Goldman notes that the current bear market, despite being deeper in magnitude, has produced VIX levels well below the peak observed during previous market sell-offs:
However, unlike Goldman which mostly analyzes the VIX in the context of a macro framework, JPM’s Cheng offers observations based on his analysis of market microstructure in both equity and options markets.
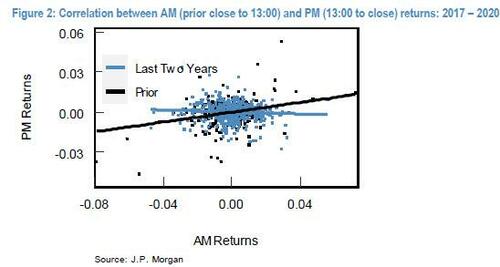
Cheng starts with the previously noted low realized volatility: as the JPM strategist writes, YTD, the SPX realized vol, measured on a close to close basis, is only 25.5, which means that delta-hedged put options would have lost money in the gamma component. From a technical perspective, JPM believes that return volatility is dampened by a lack of intraday price momentum and increasingly frequent occurrences of intraday price reversal. As seen in the next chart, intraday reversal has only started to become noticeable in the last two years. Prior to that, intraday momentum was the dominant market behavior.
This diminishing intraday price momentum has had a non-trivial impact on realized volatility, according to JPM which estimates that if the intraday return correlation remained the same as pre-pandemic, YTD volatility would be close to 28.8, or 3.3 vol points higher than realized.
As an aside, those asking for the reason behind this change in intraday patterns in the last couple of years, Cheng notes that “this is a complex topic” but in short, his view is that it is a result of 1) crowding in intraday momentum trading strategies and 2) a potential shift in option gamma dynamics as discussed below.
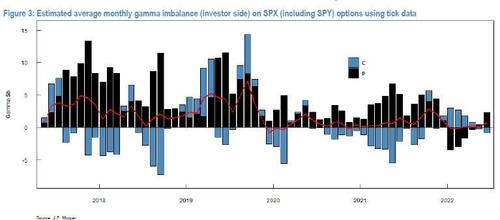
Supply/demand of S&P 500 options: Although the estimation of market level option gamma profile is highly dependent on many factors, including assumptions on open interest, OTC options, and leveraged ETFs, etc., in a report published earlier this year, JPM’s quants presented a more dynamic estimation of the gamma profile by using tick level data. Specifically, they assigned directions to SPX and SPY option trades based on their distance to the best bid/offer at the tick level, rather than the constant assumption of investors being outright long puts and short calls. The updated results are shown below.
Tha chart shows that starting in 2020, the put gamma imbalance has fallen meaningfully. This is the result of investors’ changing preference from buying outright puts to put spreads for protection, in JPM’s view. And year to date, the decline in gamma demand has not improved. Moreover, and echoing what we have said on several recent occasions, JPM notes that judging from the outright negative put gamma imbalance in early 2022, it appears that investors have been monetizing hedges that had been held since 2021 – note the consistently positive and relatively elevated put gamma imbalance throughout 2021, which suggests that protections were put on during this period.
More in the full note available to pro subs
Tyler Durden
Wed, 06/29/2022 – 15:05
via ZeroHedge News https://ift.tt/vkjs1NW Tyler Durden
