Ahead Of Today’s $2.1 Trillion OpEx, Here’s Why Futures Are Sharply Lower
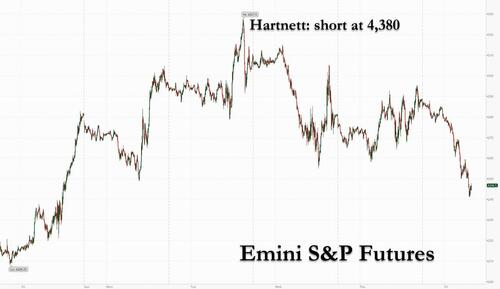
As reported earlier, the week is closing on a very downbeat note, with futures sharply lower – ES down as much as -95bps / NQ -110bps – as focus shifts to the aftermath of this latest meme stock bubble bursting (BBBY -40%), $2T in options rolling off and the back up in yields following hawkish commentary from Central Bank speakers Bullard (calling for 75bps) and George (case for raising rates remains strong).
In Europe, ECB’s Schnabel said the inflation outlook has failed to improve and even if they enter a recession, its unlikely inflationary pressures will abate by themselves, meanwhile the latest PPI print was an absolute shocker, courtesy of the neverending surge in energy prices. Also, as we noted previously, volumes yesterday were the lowest of the year, and outside of expiry, today will not be much different.
What’s behind today’s weakness? Below is a list courtesy of Goldman trader Michael Nocerino (full note available to pro subs)
- Retail Meme Stocks Unraveling – BBBY -40%…Imagine shorts will be coming out of the woodwork – keep an eye on Goldman’s PB data for confirmation.
- Crypto following suit – XBT -7%
- German PPI Came in at Record Highs – 5.3% rise
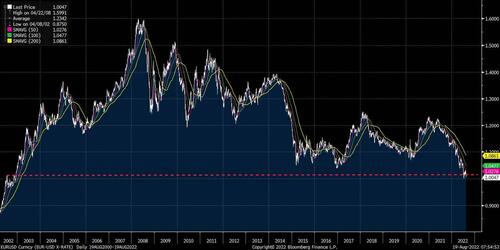
- DXY Strong following suit – EURUSD testing parity…
- Bullard called for 75bps in September – yet mkt still pricing in 50/50 short of a 75bps hike in Sept.
- Yields Higher following suit – 10y at 2.97…
- Large Expiry – $2T in options rolling off – “4300 Magnet In Effect”: Previewing Tomorrow’s $2 Trillion Op-Ex“
EURUSD Continues to Test 2002 Levels…
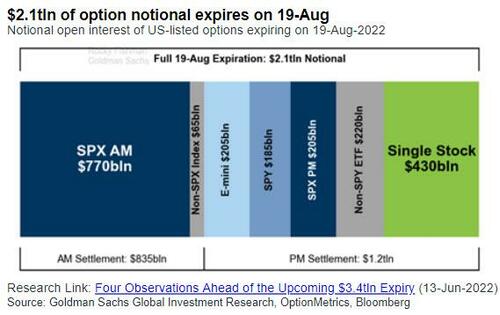
Speaking of today’s monster expiration, here it is by the numbers:
Here’s what our GS options strategists (h/t Rocky Fishman) had broken down as when/what options expire (data ran earlier this week, but gives you a sense) =>
At the 930am SQ settlement:
- $770bn of SPX AM options will expire
- $65bn of non-SPX index will expire (e.g. NDX, RTY, SOX Index, etc)
- Total of $835bn expires at the open
on the 4pm closing settlement:
- $205bn of options on E-minis
- $185bn of SPY options
- $205bn of SPX PM options
- $220bn of non-SPY ETF options
- $430bn of single stock options
- Total of $1.245tn expires on the close
Here is Nocerino’s list of key factors to focus on:
- VOLUMES….Second worst of the year, but if you take out the volume in BBBY, it was the worst of the year. 9.5B shares traded yday vs. ytd avg of 12.23B.
- NOTIONALS…Total traded across all exchanges yesterday was lowest ytd ($380B vs. ytd avg of $612B)
- RUSSIA/CHINA/US…Xi Jinping and Vladimir Putin will attend the G20 summit in Bali in November, raising the prospect of a meeting with Joe Biden at a time of heightened tensions between the world’s military superpowers over Taiwan and Ukraine. FT
- GS DESK FLOWS…We saw HF shorting in macro products and passive L/O demand in energy and tech.
Goldman Prime Broker Update (08/18)
- Overall book modestly net bought (1-Yr Zscore +0.3) ahead of large option expiry today, driven by a 2nd day of risk-on flows with long buys > short sales 2.4 to 1
- Single Stocks and Macro Products both modestly net bought and made up 56%/44% of the $ net buying, driven by long buys and short covers, respectively.
- 7 of 11 sectors were net bought led in $ terms by Info Tech, Financials, Real Estate, and Industrials; Comm Svcs, Energy, Health Care, and Consumer Disc were the most $ net sold
- After 15 straight days of covering, Consumer Disc shorts increased +0.3% yday (still down -12% MoM) driven by Automobiles and Hotels, Restaurants & Leisure names
Month-end Pension rebal update
Still unch’d as we continue to trade in a range…As of yday’s close, Goldman’s model estimates $11bn of US equities to SELL for month-end. Reminder we saw one trigger event occur on Aug 11th in which $13bn of US equities were sold. This brings total estimated rebalancing for Aug to $24bn of EQ to be sold. Quick stats on the remaining $11bn to be sold — $11bn to SELL ranks in the 39th %ile in absolute dollar value over the past 3yrs and in the 65th %ile going back to Jan 2000. $11bn to SELL ranks in the 50th %ile on a net basis (-$70bn to +$150bn scale) over the past 3yrs and in the 21st %ile going back to Jan 2000 (small relative to history).
More in the full note available to pro subs.
Tyler Durden
Fri, 08/19/2022 – 09:24
via ZeroHedge News https://ift.tt/vCjzZLS Tyler Durden


