Treasury Publishes Cash Balance Estimates As It Prepares To Drain $650 Billion To Offset Debt Ceiling
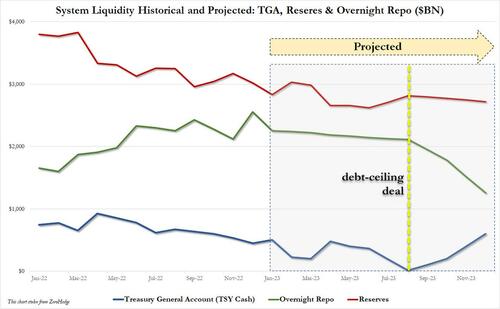
Now that all eyes are on the Treasury General Account (or TGA, also known as Treasury cash parked at the Fed) which is viewed as an offset to Fed tightening – if only until the debt limit D-day is hit some time in August, as a rapid drain in Treasury cash offsets (i.e., adds liquidity) the Fed’s QT which hopes to tighten financial conditions by draining both high-powered (reserves) and low-powerered (overnight repo) money equivalents as it shrinks its balance sheet (as explained in detail in “How The Coming Debt Ceiling Debacle Blew Up The Fed’s QT, And What Happens Next“)…
… today’s quarterly announcement by the Treasury announcing its Marketable Borrowing Estimates was of particular interest as it showed what the most likely Trajectory of treasury cash balances will be over the next two quarters.
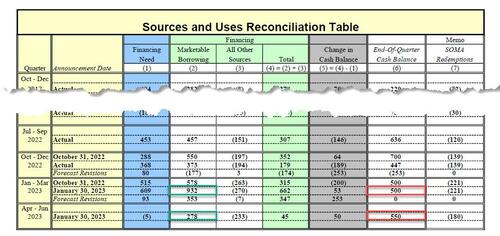
Cutting to the chase, here is the Treasury’s sources and uses table…
… for the January – March 2023 and April – June 2023 quarters, and it shows the following:
- During the January – March 2023 quarter, Treasury expects to borrow $932 billion in privately-held net marketable debt, assuming an end-of-March cash balance of $500 billion. The borrowing estimate is $353 billion higher than announced in October 2022, primarily due to the lower beginning-of-quarter cash balance ($253 billion), and projections of lower receipts and higher outlays ($93 billion).
- During the April – June 2023 quarter, Treasury expects to borrow $278 billion in privately-held net marketable debt, assuming an end-of-June cash balance of $550 billion.
Before digging into these numbers, a quick look at what the Treasury did in the just completed fiscal Q1 2023 quarter:
During the October – December 2022 quarter, Treasury borrowed $373 billion in privately-held net marketable debt and ended the quarter with a cash balance of $447 billion. In October 2022, Treasury estimated borrowing of $550 billion and assumed an end-of-December cash balance of $700 billion. The $177 billion difference in privately-held net market borrowing resulted primarily from the lower end-of-quarter cash balance, somewhat offset by lower net fiscal flows.
With that in mind, what is most notable about the numbers above is that all else equal, the Treasury expects a March cash balance of $500BN, followed by a $50BN build cash build in the Apr-Jun quarter which would be a material difference from assumptions of a rapid cash drain. There is just one problem: both those numbers are now meaningless as the Treasury itself admits in a footnote to the financing estimates…
Treasury cash balance Sources and Uses, footnote 3 which the so-called experts always miss: “The end-of-March and end-of-June cash balances assume enactment of a debt limit suspension or increase”.
— zerohedge (@zerohedge) January 30, 2023
… to wit:
The end-of-March and end-of-June cash balances assume enactment of a debt limit suspension or increase. Treasury’s cash balance may be lower than assumed depending on several factors, including constraints related to the debt limit. If Treasury’s cash balance for the end of either quarter is lower than assumed, and assuming no changes in the forecast of fiscal activity, Treasury would expect that borrowing would be lower by the corresponding amount
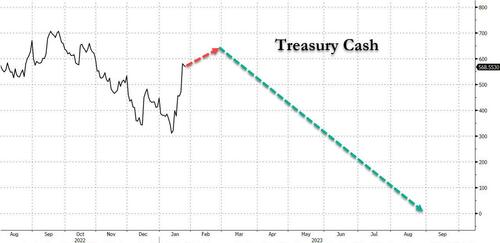
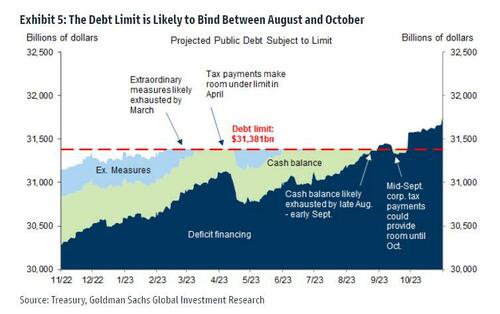
In other words, today’s financing estimates are devoid of any actual debt-limit signal, which – as the case may be – is the $32 trillion elephant in the room. So in lieu of that, we will instead go back to our preliminary analysis and update it for the recent spike in the TGA balance which has surged from $310BN when we looked at it last two weeks ago, to $568BN as of Friday’s print. The jump is thanks to the various extraordinary measures – i.e., replacing non-marketable Treasuries in federal employee retirement funds with instruments that do not count toward the debt limit, or simple IOUs – and according to Goldman there is a total of $300BN or so in measures, meaning that the TGA may hit $650 billion by March. At that point, the Treasury would need to run down its cash balance to shrink bills outstanding. This sequence of events is shown in the chart below…
… and amounts to roughly ~$110 billion in liquidity added by the Treasury and offsetting the Fed’s QT until the September debt ceiling D-Day.
It goes without saying, that should there be no deal after the drop dead date, and we don’t mean a trillion dollar platinum coin…
… then all bets are off.
Tyler Durden
Mon, 01/30/2023 – 17:00
via ZeroHedge News https://ift.tt/8FVU9KG Tyler Durden


