By Peter Tchir of Academy Securities
Milton Friedman made the term “long and variable lag” famous. Everyone involved in markets and the economy has been struggling with the question of “what is the amount of lag” that we currently face on monetary policy. “Conventional” wisdom, as I understand it, is that it takes 3 to 6 months for economic policy to be truly felt. I think that is far too short of a “lag” effect.
I’m going to ignore the fact that there was ongoing stimulus when the Fed started to hike. For example, things like the so-called “Inflation Reduction Act” came out during the hiking cycle. In addition, the Fed was still expanding its balance sheet almost until the time of the first hike. Finally, student loans were in moratorium and there were promises (and attempts, with limited success) of debt forgiveness.
Basically, I will ignore all the reasons why the lag effect was impacted early on. I will instead focus on the reason why it is still taking so long to kick in.
Borrowers Were Smart
What we will try to demonstrate is that borrowers were very smart and that “smartness” is translating into a much longer lag time for monetary policy to kick in than “normal”.
We will focus on the U.S. investment grade bond market as it is what I live and breath and feel most comfortable discussing (and I have good access to information).
I do think that it applies well to all corporate borrowers, especially since we saw private credit markets explode in size.
I expect that if we did a similar analysis on the auto loan market and mortgage market, we would see that consumers also made some very smart decisions in recent years (minimizing the immediate impact of monetary policy).
We will show that in the corporate credit market, issuers took advantage of incredibly low yields to lock in borrowing costs for longer (and in bigger sizes) than we’ve ever seen.
The more you borrowed at low rates (for extended maturities), the longer the monetary policy lag time is going to be as it will take years for the real impact to be felt (i.e., not in 3 to 6 months). This applies to corporations and households and it should not surprise us that 18 months after the first hike (and barely 6 months after the “slowing” of hikes) we aren’t seeing the impact that many expected.
We tried to describe this using the “birthday paradox” in 99 Problems but the Fed Ain’t One. It is also part of the reason why (only recently) we have been warning that The Real Story is Real Yields.
Without further ado, let’s start analyzing the “smartness” and why we have yet to see much of an impact from what seems like an unprecedented cycle of hikes.
IG Borrowers Were Very Smart
The Fed created ZIRP and some of the easiest monetary conditions ever seen. Not only were they growing their balance sheet with Treasuries, but they also figured out (in conjunction with the Treasury Department) how to buy corporate bonds and even fixed income ETFs!
In any case, we will show that corporations responded to this opportunity and that response is why the lag effect is “laggier” than ever.
Average Coupon
While I tend to live in a “mark to market” world, most companies live in an “accrual accounting” world. It might be fun to watch (and trade) the gyrations in bond markets, but the reality is that current yields are largely irrelevant to most borrowers. What matters is the average coupon. For all the following charts we use data based on the Bloomberg Corporation Bond Index.
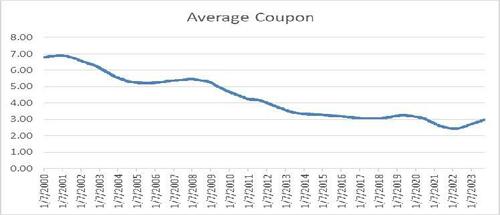
The current average coupon is 2.99%. It is creeping higher (towards 3%), but it is still much lower than current yields are anywhere on the curve.
Historically, that is an incredibly low average coupon. Prior to July 2020 this index wasn’t below a 3% coupon in well over 20 years (2000 is as far back as I went for today’s purposes).
Almost 60% of the time (prior to July 2020) the average coupon was above 4%!
So, even after a series of aggressive hikes, average coupons are still low by historical standards.
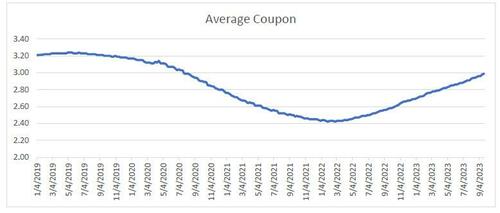
Despite the Fed hiking rates by 5.25% in less than 2 years, the average coupon has only trickled up to 2.99%. The low was 2.42% in January 2020. So, we’ve seen the average coupon increase by less than 60 bps in the almost 2 years since the hiking cycle began. It will continue to go higher as there is no place on the yield curve to hide. The 10-year at 4.57% is at the lowest point on the Treasury curve and that is before adding any credit spread.
The average coupon is impressive, but it only tells part of the story of just how well borrowers (at least corporate borrowers) navigated ZIRP. However, I strongly believe that individuals, small businesses, and leveraged companies did this well too.
Average Maturity
While traders tend to live in a world driven by duration and DV01 (dollar value of a basis point), most people focus on how long they borrowed money for. How long you’ve locked in your debt for is how you manage your roll risk (for better or for worse, though we will demonstrate that corporations did it for the better).
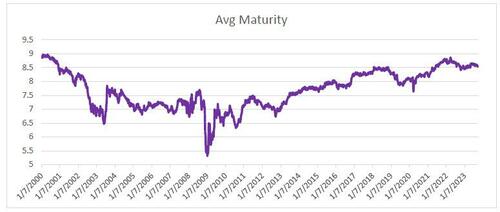
While not quite as high as it was back in 2000, the average maturity is at 8.5, which is longer than average for this index. It climbed steadily, dipped a bit in 2019, and then rose rapidly while curves were inverted and yields were low. It has come down now, presumably because companies are less interested in issuing longer-dated bonds and some (as we will see next) are apparently paying down debt (unlike our government, but that is a story/rant for another day – US Govt Credit Rating).
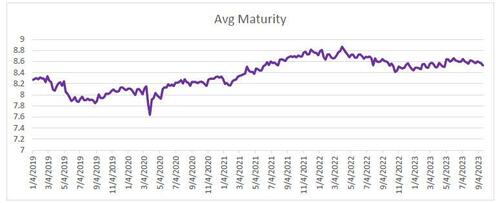
Since April 2020, the average maturity went from 7.6 to almost 9 – an incredibly fast rise.
All else being equal, the average maturity declines over time as bonds come closer to their maturity date (it takes an impressive amount of long-dated issuance to drive that maturity extension). It is still coming down, but from elevated levels.
The fact that investment grade borrowers (and I’m sure consumers and other borrowers) extended their maturities to take advantage of historically low yields and inverted curves means that it will take even longer for today’s current high yields to work their way into the system (i.e., it will make monetary policy effects even laggier).
Debt Issuance
Maybe “net” issuance is the right number to look at, but for now, let’s just see what happened to debt issuance (based on the Bloomberg league table data).
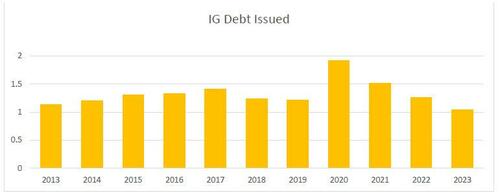
2023 isn’t finished, but IG debt issuance has been reasonably stable. 2020 saw a 57% increase from 2019! While 2021 slowed down a bit, it was the 2nd highest in the past decade (behind 2020) and we still saw 25% more debt issued that year compared to 2019.
While net issuance is probably the correct metric, outright issuance alone is enough to send a strong message that companies took advantage of ZIRP to issue lots of debt! That helps explain why the average maturity increased relatively rapidly (and the average coupon dropped reasonably quickly). Typically, a surge in issuance helps overcome the inertia inherent in broad market indices.
Better Preparation Leads to Longer Lag Times
The more people prepared for a change in the rate environment, the longer it will take for that change to impact borrowers.
It seems clear that companies (and borrowers of all types) locked in lower for longer, which by definition (or maybe it is axiomatic) means longer lag times.
I think that the Fed should be very cautious (more cautious than they already have been) about raising rates as the impact is only beginning to be felt and piling on will cause more trouble down the road (especially if the Fed doesn’t want to cut any time soon, which they don’t).
Smart borrowers need to be accounted for in thinking about lag times and many of you on this distribution list deserve a pat on the back for being so well prepared to mitigate an aggressive Fed!
