Stockman: We Don’t Need Three More Stinkin’ Rate Cuts
Via David Stockman’s Contra Corner
Jerome Powell is not completely the blithering idiot he seems. Actually, playing the role of chairman of our monetary central planning agency would have done that to anyone— even Einstein.
After all, we are talking about monetary Mission Impossible here. There is an infinitely complex and opaque $26 trillion economy in America, which is deeply and intricately interwoven with a $105 trillion global GDP. As such, the US economy operates far, far beyond the reach of any would-be state administrator, planner or economic czar.
In part that’s because the “incoming economic data” on the Fed’s dashboards is unreliable, incomplete, noise-ridden and frequently undecipherable. Likewise, its tools of policy implementation and control are crude, wobbly and generally unfit for purpose.
So the Fed is pleased to pretend it is precisely and scientifically pursuing macroeconomic “goals” with respect to inflation, full employment and general maximization of prosperity, thereby bestowing the greater good on main street America. But that’s a ruse. In fact, what it actually does is to periodically bend over when Wall Street hands it the proverbial bar of soap.
Yesterday occasioned the latest ignominious episode of this monetary whoredom when Powell pivoted on a dime with respect to rate cuts, thereby flushing down the memory hole his own position of just two weeks earlier. As ZeroHedge noted,
One day after the Fed’s bizarre, unexpected pivot, many are struggling to wrap their heads around what happened: what exactly changed in less than two weeks for Powell to go from telling the market it was “premature to conclude with confidence that we have achieved a sufficiently restrictive stance, or to speculate on when policy might ease” to suddenly warning that rate cuts are something “that begins to come into view, and is clearly a topic of discussion out in the world and also a discussion for us at our meeting today.”
Even Powell’s own mouthpiece, WSJ reporter Nick “Nikileaks” Timiraos, was confused remarking sarcastically after the FOMC “what a difference two weeks can make.“
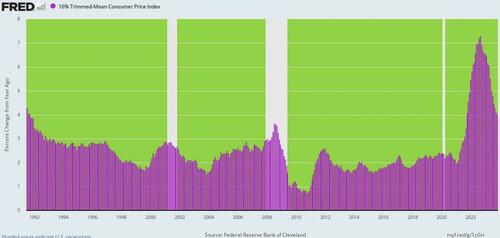
So to reprise Wednesday’s post: Inflation hasn’t been vanquished, real interest rates are still deeply subnormal and $8 trillion of fiat money production since 2008 is more than enough for decades to come. So why is Powell even talking about rate cuts?
Y/Y Change In 16% Trimmed Mean CPI, 1991 to 2023—At 4.0% Still Highest Trend Rate In 32 Years
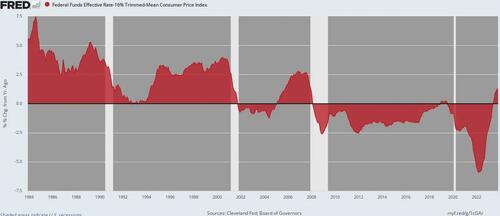
Inflation-Adjusted Fed Funds Rate, 1984 to 2023—Real Rates Were Negative 95% Of The Time Since the Great Financial Crisis
Of course, the inmates at the Eccles Building never run short of economic gibberish when trying to justify the unjustifiable. Yesterday, for instance, Powell warned that if the Fed doesn’t soon start cutting rates and inflation keeps falling, real rates might become too tight, thereby restricting the economy and presumably blocking achievement of its full employment “goals.”
Well, that’s rich. Not one of the FOMC’s 12 current members were onboard before April 2008, meaning that real interest rates have been negative during 95% of their collective time of service. And yet Powell is worried about real rates becoming too tight?
Powell repeated his view that officials could lower rates next year simply because inflation is well on its way to their 2% target. Holding rates steady as inflation falls would lead inflation-adjusted or “real” rates to rise, which the Fed doesn’t want. Officials could lower nominal rates simply to prevent real interest rates from turning too tight.
“You wouldn’t wait to get to 2% [inflation] to cut rates,” Powell said. “It would be too late. You’d want to be reducing” the amount of “restriction on the economy well before you get to 2%.” – Wall Street Journal
As we said, the above mendacity is window dressing. Wall Street wants another run at surging stock prices, and the only way to make that happen in the context of an economy that is dead in the water is through yet another cycle of PE expansion.
And when it comes to PE expansion, in turn, the Pavolovian traders and robo-machines of Wall Street have already surpassed AI learning by a country mile:
-
Lower the rate.
-
Buy the stock.
-
Bank the gains.
-
Done!
-
Rinse!!
-
Repeat!!!
The above is the one and only justification for lowering interest rates early next year, late next year or any other time in the period immediately ahead.
The reason is simple: The only agency through which lower rates from current negligible inflation-adjusted levels could possibly impact growth of GDP, employment, spending and incomes is via inducement of still more borrowing by government and private sector actors alike.
After all, rates cuts are the only tool in the Fed’s threadbare tool kit and causing economic actors to borrow and spend more than they would on their own volition is its only real channel of policy transmission.
But here’s the thing. Has it ever occurred to these Keynesian boneheads that when it comes to the endless accumulation of debt that there may come a state of diminishing returns? Or that more debt today ensures less jam tomorrow? Or that in the basic scheme of economic life there is juxtaposed against income statements and cash flow metrics the matter of balance sheet conditions and their repercussions upon the former?
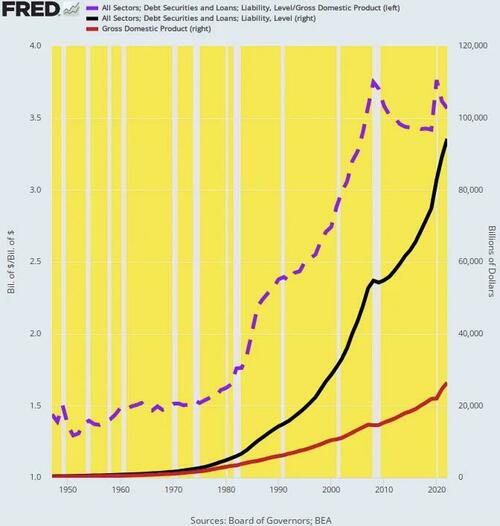
Well, here is the US economy’s total public and private debt (black line) relative to income or GDP (red line) since 1949, with the dashed purple line representing what amounts to the aggregate leverage ratio. As it happened, the latter was stable at about 150% debt-to-GDP from 1950 through 1970, reflecting a historical constant that had dwelled in that range for most of the 100 years after 1870.
Once the dollar was cut loose from its anchor to gold in 1971, however, it was off to the races. Collective income or GDP is now 2,300% higher, while collective debt is up by 5,600%. Accordingly, the US economy’s leverage ratio has soared to 357% as of 2022.
There is far more to this chart than just big numbers, however. The extra two turns of leverage on current national income depicted by the dashed purple line represents $53 trillion of incremental debt burden that would not have existed at the pre-1971 leverage ratio. That is to say, the current aggregate US debt level would be $41 trillion, not $94 trillion.
US Economy’s Debt, Income And Leverage Ratio, 1949 to 2022
So what the Fed’s recurrent bouts of “rate cutting” have actually delivered is temporary gains in borrowing and spending—purchased at the cost of water-logging the GDP with Peak Debt and ever diminishing capacity for growth.
Indeed, a perusal of the chart suggests that the real tipping point was reached on the eve of the Great Financial Crisis in 2007. During the 58 years ending at the first Peak Debt in 2007, real GDP grew by an average of 3.53% per annum. Since then, the gain has been only 1.76% per annum, or barely 50% of its historic rate.
Needless to say, the above outcome is not solely due to the self-evident explosion of government debt. Nor is the GDP growth collapse attributable just to the fact that the overwhelming share of these massive government debt and spending gains have been channeled to the lowest productivity expenditures that exist in the current US economy—namely, military outlays and transfer payments.
The state sector share of the blame for the growth slowdown thus cannot be denied. Yet the Fed’s endless promotion of sub-economic rates also infects the private sectors no less than the elected politicians and the nomenklatura who man today’s sprawling arms of government.
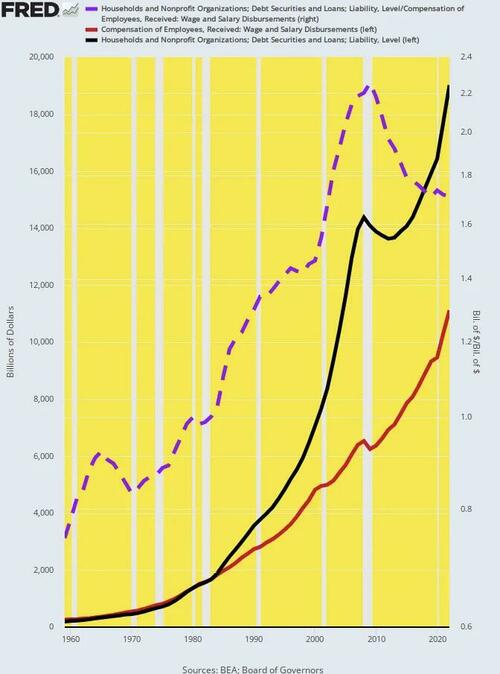
Thus, the household debt and leverage ratio explosion has been even more dramatic than for the US economy as a whole. Between 1960 and 2022, total debt of the household sector has risen from $213 billion to $19.021 trillion or by a staggering 8,830%. That compares to the main source of household income—wage and salary disbursements—which have grown from $274 billion to $11.115 trillion or by just 3,950%.
As a matter of arithmetic, therefore, the household leverage ratio against earned income has jumped from 78% in 1960 to 171% in 2022. And, again, it is self-evident that with 2.2 more turns of leverage, the household sector’s capacity to spend and invest has been severely compromised.
Household Debt, Income And Leverage Ratio, 1960 to 2022
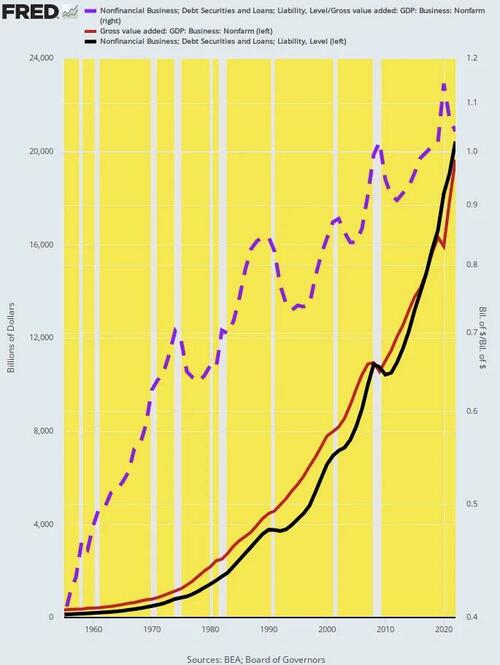
Not surprisingly, the same trends hold with respect to nonfinancial business sector leverage, as well, except that the debt explosion is even more exaggerated. To wit, between 1955 and 2022 US business debt outstanding soared from $131 billion to $20.434 trillion.
That’s right. Business debt (black line) has risen by the staggering sum of 15,500% since 1955. Alas, the means to service all that debt— value added generated by business operations (red line) —rose by only 5,930% during the same 67-year interval.
Again, the math does not lie. The implicit leverage ratio for the US business sector has well more than doubled, rising from 40% in 1955 at the peak of America’s post-war prosperity to 104% in 2022.
Business Sector Debt, Income and Leverage Ratio, 1955 to 2022
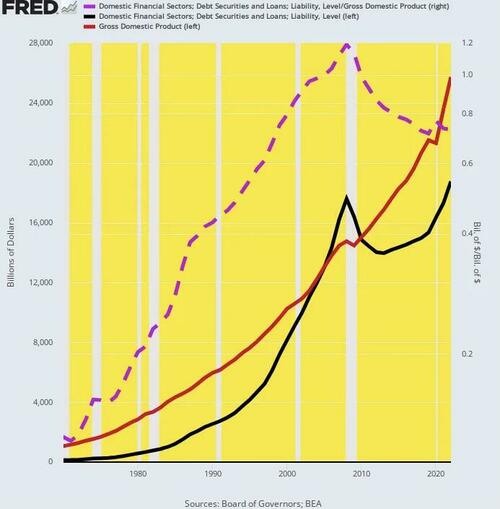
Needless to say, ground zero for the post-1971 explosion of debt and leverage has been the domestic financial sectors. The banks, insurance companies, brokers, GSEs and Wall Street conglomerates have become the ultimate LBO.
Thus, the sector’s outstanding debt level (black line) rose from $140 billion in 1970 to $18.77 trillion in 2022 or by 13,200%. And that was against a backdrop of GDP growth which increased by the aforementioned 2,300%.
So the domestic financial sector’s leverage level exploded indeed, rising from 12% of GDP in 1970 to 73% at present. Of course, the textbooks said the financial sector is supposed to be in the debt intermediation and distribution business. But nearly $19 trillion of debt issuance on its own accounts says otherwise. Loudly.
Domestic Financial Sector Debt, Income And Leverage Ratio, 1970 to 2022
So here we go again with what will surely be even more counter-productive rate cuts and yet another round of financial repression. Yet if the nation’s central bank were actually in the business of promoting the public good, it would recognize that America’s balance sheets are tapped out, and that what it should be doing is stepping aside and defaulting to the free market.
Only the latter can discover the true economic and sustainable level of interest rates, debt and leverage under current conditions. And the sooner Mr. Market gets started on that mission, the better.
In a word, after yesterday’s pathetic capitulation to Wall Street, the only thing left for Powell to do is cancel the thought of three more stinkin’ rate cuts and get out of the way. Now!
In September, officials had projected one more hike this year followed by two cuts next year, taking the fed-funds rate to around 5.1%. On Wednesday, officials projected they would lower it to around 4.6% by the end of 2024, the equivalent of three quarter-point reductions from the current level.-WSJ
* * *
David Stockman’s Contra Corner is the place where mainstream delusions and cant about the Warfare State, the Bailout State, Bubble Finance and Beltway Banditry are ripped, refuted and rebuked.
Tyler Durden
Sat, 12/16/2023 – 11:40
via ZeroHedge News https://ift.tt/EgzN6wC Tyler Durden
