Stagflation Shock: GDP Stuns With Lowest Print In 2 Years, Below Lowest Estimates, As PCE Comes In Red Hot
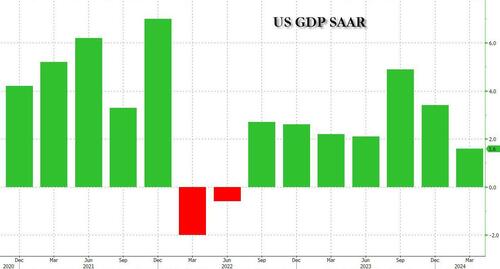
If the Biden admin was to have any hopes of the Fed cutting rates and monetary easing ahead of the election, the tires would need to start falling off the US economy right… about… now… Which is why we didn’t find it at all surprising that moments ago the Biden Bureau of Economic Analysis reported that in Q1, US GDP unexpectedly collapsed to just 1.6%, down more than 50% from the Q4 print of 3.4%, the lowest print since Q2 2022 when the US underwent a brief technical recession (one which the NBER never admitted of course), and a huge miss to the 1.6% estimate.
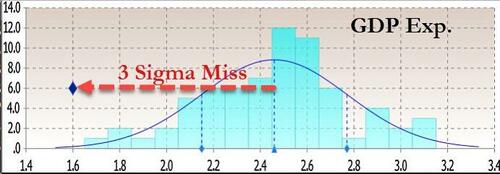
Almost as if on purpose, the GDP printed below the lowest estimate (that of SMBC Nikko) which was at 1.7% (the highest forecast was 3.1% from Goldman Sachs which was off by the usual 50%), and was a 3-sigma miss to estimates.
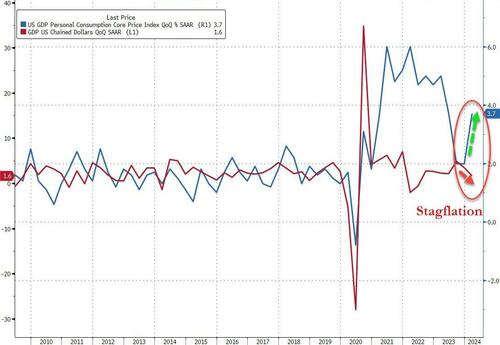
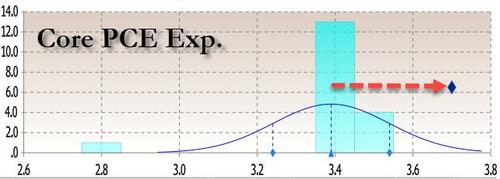
But while a collapse in the US economy is just what the “soft landers” wanted, the huge GDP miss was just half the story because at the same time, the BEA reported that the GDP Deflator (price index) came in at 3.1%, hotter than the 3.0% expected and almost double the 1.6% in Q4. Worse, the all important core PCE for Q1 soared from 2.0% to 3.7%, blowing away estimates of 3.4% (we will get a more accurate core PCE print tomorrow for the month of March) and suggesting that the US is about to not only not pass go, and overshoot soft-landing island completely, but crash-land straight into a stagflationary recession…
… unless the Fed does something, although what it can do – with inflation rising and growth slowing – is anyone’s guess.
Taking a closer look at the absolute data, the BEA said that the increase in the first quarter primarily reflected increases in consumer spending and housing investment that were partly offset by a decrease in inventory investment. Imports, which are a subtraction in the calculation of GDP, increased.
- The increase in consumer spending reflected an increase in services that was partly offset by a decrease in goods. Within services, the leading contributors to the increase were health care as well as financial services and insurance. Within goods, the leading contributors to the decrease were motor vehicles and parts as well as gasoline and other energy goods.
- The increase in housing investment was led by brokers’ commissions and other ownership transfer costs as well as new single-family housing construction.
- The decrease in inventory investment was led by decreases in wholesale trade and manufacturing.
Compared to Q4, the deceleration in GDP in Q1 reflected decelerations in consumer spending, exports, and state and local government spending and a downturn in federal government spending. These movements were partly offset by an acceleration in housing investment. Imports accelerated.
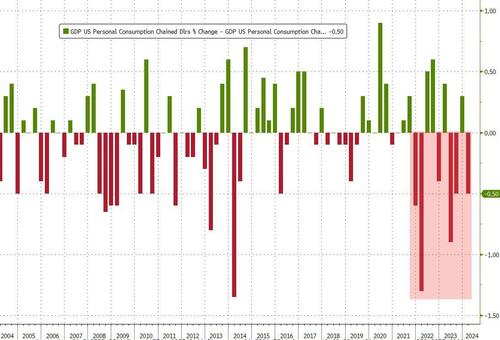
Digger deeper into the data, we find that it was once again the slowdown in consumption that was the biggest culprit, with Personal Consumption rising 2.5%, a big drop from the 3.3% in Q4 and below the 3.0% expected. Taking a step back we find that consumption has now missed on 6 of the past 10 prints.
As discussed extensively here, while the consumption missed, it was still positive, and reflects the latest drop in the savings rate, to 3.6% in the first quarter from 4% in the fourth quarter of last year, as consumers continue to drain their bank accounts and max out their credit cards. Economists have been wondering how long that can go on, but so far it shows no signs of abating. The (until recently) relentless rise in equity prices may be playing a role here.
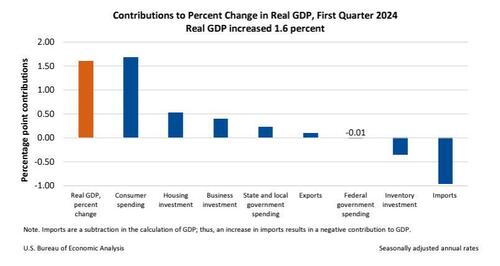
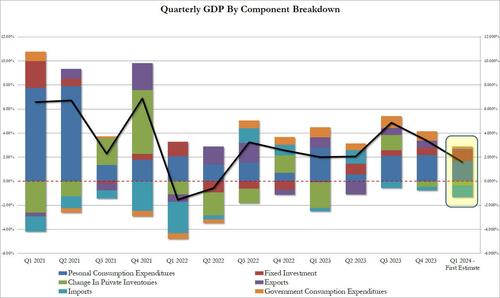
In terms of actual components we find the following picture:
- Personal Consumption added 1.68% to the bottom line GDP print, or more than 100% of it. This was down notably from 2.20% in Q4.
- Fixed Investment rose modestly, to 0.91% of the bottom line contribution, up from 0.61% in Q4.
- The Change in Private inventories continued to detract from GDP for the 2nd quarter in a row, reducing the bottom line GDP print by 0.35%, a modest improvement from the -0.47% in Q4.
- Net trade was a big delta, and after contributing 0.25% to the Q4 3.4% GDP print, in Q1 it subtracted 0.86% from the actual print.
- Finally, government continues to be a contribution but in Q1 it added just 0.21%, a big drop from the 0.79% in Q4 and the lowest since Q2 2022 when it reduced GDP by 0.29%.
And visually:
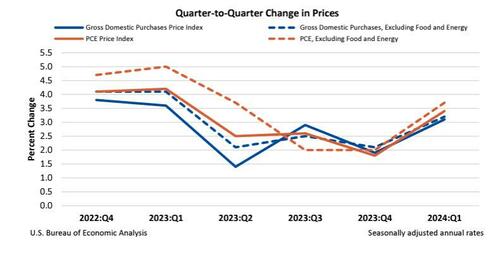
That was the GDP side of things, what about the inflation/PCE? Well, this is where things get really bad, because after PCE came in hot in Q4, it came in even hotter in Q4, as GDP prices, the prices of goods and services purchased by U.S. residents, increased 3.1% in Q1 after increasing 1.9%, and above the 3.0% estimate. Excluding food and energy, prices increased 3.2% after increasing 2.1%.
Turning to the all important PCE, Personal consumption expenditures prices increased 3.4% in the first quarter after increasing 1.8% in the fourth quarter. And the punchline: excluding food and energy, the all important core PCE price index increased 3.7% after increasing 2.0%, and coming far hotter than the 3.4% estimate; in fact it came in above the highest estimate!
This, according to Fed-whisperer Nick Timiraos, implies that the March core PCE number which is reported tomorrow, must be higher than +0.22, closer to +0.3% (which is precisely where the estimate is), and would imply upside revisions to Jan and Feb.
Commenting on the report, Fitch economist Olu Sonola writes that “the hot inflation print is the real story in this report. If growth continues to slowly decelerate, but inflation strongly takes off again in the wrong direction, the expectation of a Fed interest rate cut in 2024 is starting to look increasingly more out of reach.”
The bottom line: while a sharp slowdown in growth would have been just the “bad news is good news” the market was desperately hoping for, throw in the unexpected surge in prices and suddenly the threat of a full-blown stagflationary shock is once again front and center… at least until tomorrow, when we wouldn’t put it past this admin to come out with another fabricated core PCE print which makes no sense and somehow comes in well below the 0.3% MoM estimate.
Tyler Durden
Thu, 04/25/2024 – 08:51
via ZeroHedge News https://ift.tt/eYFHQKz Tyler Durden
