“Democracy Is On The Ballot”: California Democrats Seek To Prevent Voters From Approving New Taxes

“Democracy Is On The Ballot”: California Democrats Seek To Prevent Voters From Approving New Taxes

Authored by Jonathan Turley,

“Democracy is on the ballot.”

That mantra of President Joe Biden and other Democrats has suggested that “this may be our last election” if the Republicans win in 2024. A few of us have noted that the Democrats seem more keen on claiming the mantle of the defenders of democracy than actually practicing it. Democrats have sought to disqualify Donald Trump and dozens of Republicans from ballots; block third party candidates, censor and blacklist of those with opposing views; and weaponize the legal system against their opponents.

Most recently, in California, democracy is truly on the ballot and the Democrats are on the wrong side.

California has always prided itself on the ability of citizens to vote on changes in the law directly through referenda and ballot measures. That is precisely what citizens are attempting to do with a measure that would require voter approval of any tax increase, including a two-thirds vote for some local taxes. It is called the Taxpayer Protection Act and it is a duly qualified statewide ballot measure slated for the November 2024 ballot.

The state Democrats are apoplectic over the prospect of citizen control over revenue and taxes.  What was a quaint element of democratic empowerment is now challenging a core vehicle of Democratic power. So Gov. Gavin Newsom and other Democratic leaders have taken the issue to the state Supreme Court to demand that citizens be denied the right to decide the issue.

In oral arguments, the attorney supporting the challenge explained to the justices that citizens are simply not equipped to deal with the complexities of taxation and should not be allowed to render such a decision.

In a prior decision, Associate Justice Mariano-Florentino Cuéllar wrote that:

“Whether the context involves taxation or not, all of these cases underscore how courts preserve and liberally construe the public’s statewide and local initiative power. Indeed, we resolve doubts about the scope of the initiative power in its favor whenever possible and we narrowly construe provisions that would burden or limit the exercise of that power.”

Half of the Court seemed to be inclined to deny the public the right to decide the question.

The Court, however, may wait until after the election to render a decision on the limits of democracy in California.

Tyler Durden
Sat, 06/01/2024 – 19:50

via ZeroHedge News https://ift.tt/Jpfyx2N Tyler Durden

Trump’s ‘Coal Country’ Could Supply Nation With 40% Of Lithium Demand 

Trump’s ‘Coal Country’ Could Supply Nation With 40% Of Lithium Demand 

America’s transition to a decarbonized economy demands massive base metals and rare Earth minerals. Currently, China dominates the rare Earth mineral market. However, initiatives are already underway by the US federal government to sever reliance on the Chicoms and boost domestic mining and refining abilities. 

One unlikely area where 40% of the nation’s lithium supply could be sourced from is ‘Trump’s coal country,’ otherwise known as good ole’ Appalachia. 

According to Justin Mackey, a research scientist at the National Energy Technology Laboratory and PhD student at the University of Pittsburgh, wastewater from oil/gas rigs across the Marcellus Shale formation could supply the nation with 40% of its lithium needs. 

“This is lithium concentrations that already exist at the surface in some capacity in Pennsylvania, and we found that there was sufficient lithium in the waters to supply somewhere between 30 and 40 percent of the current US national demand,” Mackey told CBS News

Mackey said there are lithium mining operations in the US. But he told local media outlet Pittwire, “This is different. This is a waste stream, and we’re looking at a beneficial use of that waste.” 

He said finding lithium in water recycled in hydraulic fracking wasn’t difficult, adding, “If you can extract value out of materials, and specifically lithium from this, then you reduce the cost of remediating and handling this waste.” 

The researcher said future wastewater extractions of lithium from oil/gas rigs in neighboring states, such as West Virginia, Western Maryland, and Ohio, could spark an “economic boom for the region.”

Trump country has been economically decimated over the last several decades amid de-industrial trends. Death and despair, along with big pharma, helped ignite an opioid and pill epidemic that has killed tens of thousands, if not more. 

Could Trump’s coal country be primed for revitalization trends and capitalize off decarbonizing trends? If so, then the land across the region could become increasingly more valuable over the coming decade.

Tyler Durden
Sat, 06/01/2024 – 19:15

via ZeroHedge News https://ift.tt/IqdZQ2W Tyler Durden

Strong Indian Purchases Push Asia’s Crude Imports To One-Year High

Strong Indian Purchases Push Asia’s Crude Imports To One-Year High

Authored by Tsvetana Paraskova via OilPrice.com,

Record-high crude imports in India have pushed Asia’s oil arrivals in May to the highest level in a year, per data compiled by LSEG Oil Research and cited by Reuters columnist Clyde Russell.

Asia, the key crude oil importing region and a gauge of oil demand trends, is set to welcome in May 27.81 million barrels per day (bpd) of crude oil volumes, nearly 1 million bpd higher than the April imports, per the LSEG Oil Research data.   

Most of the 920,000-bpd growth in Asia’s estimated crude oil imports this month has been thanks to a 710,000-bpd surge in volumes shipped to India, which is back to importing increased volumes of cheaper Russian crude oil.

India is estimated to see its crude imports jump to a record-high of 5.26 million bpd in May, up by 710,000 bpd from 4.55 million bpd of crude imported in April, according to the data compiled by LSEG Oil Research.

While India is leading Asia’s crude imports higher, China is again showing signs of weaker import demand. The world’s top crude oil importer is expected to haul in 10.72 million bpd of crude in May, down from the 10.93 million bpd imports in April and the lowest per-day volumes since January, Reuters’ Russell notes.

The stronger Indian economy compared to China and the renewed appetite from Indian refiners for Russian crude – after hesitation earlier this year when stricter U.S. sanctions on Russia’s oil trade were enforced – have been pushing Indian fuel demand and crude imports higher in recent weeks.

For example, India is estimated to have boosted its imports of Russian crude to a nine-month high in April, per data Reuters has obtained from industry and shipping sources.

Moreover, India’s crude oil demand has been growing this year despite consistently higher prices, suggesting that it is more resilient to price rises than some expected. 

Tyler Durden
Sat, 06/01/2024 – 18:40

via ZeroHedge News https://ift.tt/HNjhpeb Tyler Durden

Global Cocoa Shortage Much Worse Than Previously Forecasted As Prices Surge

Global Cocoa Shortage Much Worse Than Previously Forecasted As Prices Surge

The International Cocoa Organization has admitted that the global cocoa shortage will be significantly larger than previously forecasted. Cocoa prices in New York have rebounded in recent weeks, inching above the $9,330 per ton mark to close the week. 

First reported by Bloomberg, ICCO forecasted demand will exceed production by 439,000 tons, driven mainly by higher cocoa grinding in consuming countries. This is the second estimate for the current October-September year and is much larger than the February forecast for a deficit of 374,000 tons. 

“Currently available data reveal that cocoa grinding activities have so far been unrelenting in importing countries despite the record cocoa price rallies,” the ICCO, adding, “As the 2023-24 season progresses, it is certain the season will end in a higher deficit than previously expected.”

After the ‘great cocoa’ run-up in New York in the first 3.5 months of the year, through the first half of April, from $4,000 a ton to over $12,000 (a record high), prices crashed into May, down 44%. But in the last nine trading sessions, prices have surged to $9,330, or about 39%. 

The ICCO has increased its estimate for global cocoa grindings to 4.86 million tons, up from the initial forecast of 4.78 million tons, and increased its production projection by 12,000 tons to 4.46 million tons.

The revised forecast has likely captured the attention of Andurand Capital Management’s Pierre Andurand, who has been bullish on cocoa prices this year. 

Earlier this month, Andurand joined Bloomberg’s Odd Lots hosts Tracy Alloway and Joe Weisenthal to discuss the cocoa trade. 

Weisenthal asked the hedge fund manager: 

So what did your analyst see? Or how was your analyst able to see something in the supply and demand situation that he felt, and you felt, was not being identified by the analysts who cover this closely?

Andurand responded:

I think it’s mainly an understanding of how much prices have to move to balance the market. You know, sometimes people can trade that market for like 20 years. They’ve been used to a range of prices and they believe, okay, the top of the range is the high price for example.

But they don’t really ask themselves what makes that price, right?. And sometimes taking a step back can help. I mean what makes the price is mainly the fact that in the past you would have the supply response if prices were going up. But if now you don’t get the supply response, or the supply response takes four or five years, then you need to have a demand response.

And a lot of people look at prices in nominal terms. So you hear people saying ‘Oh, we are at all time high prices in cocoa, but that’s because they look at prices in nominal terms. [The] previous high in 1977 was $5,500 something dollars a ton of 1977 dollars, which is equivalent to $28,000 a ton of today’s dollars.

So we are still very far from previous highs. And so you have to look at a bit more history and understand in the past how prices reacted to a shortage, how long it took to recover the product shortage to actually solve itself. And what’s different today.

So there’s a ratio that we look at that most people look at, it’s actually the inventory to grindings ratio. So it’s a measure of inventory to demand, what we call grinding is basically industrial companies that take the cocoa beans and they want to make chocolate with it. So it’s a process and some of them make the end product chocolate directly. Some of them sell back the product to other chocolate makers.

And so basically a typical grinder would take cocoa beans and make cocoa butter and powder with it. And the prices of both those elements also went up even more than cocoa beans, which means that actually we probably had some destocking everywhere in the chain.

So it looks like demand, when we look at the chocolate makers, the end demand for chocolate didn’t go down at all, it looks to be flat on the year. Grindings look to be down three, three and half percent this year, despite the fact that the end demand is the same in volume, which means that they’ve been destocking cocoa beans actually.

And so we had destocking everywhere — at the end chocolate level, at the cocoa beans, at the cocoa butter and cocoa powder level. So we had this destocking everywhere on the chain and now we have the largest deficit ever on top of two previous years of deficit. And it looks like next year we will have a deficit.

So we’re in a situation where we might actually run out of inventories completely. I mean this year we think we will end up with an inventory to grinding ratio — so inventory at the end of the season — of 21%. For the last 10 years we’ve been between 35% and 40% roughly. At the previous peak in 1977 we were at 19% and that’s what drove us to $28,000 a ton, of todays’s dollars.

If we have another deficit next year, then we might go down to 13%. So I don’t think it’s actually possible. That’s when you really have real shortage of cocoa beans, you can’t get it and that’s when the price can really explode. And so understanding that you have to slow down demand and we know that demand can’t really be slowed.

So that’s when you can have an explosion [in price]. And remember that these commodity futures, you need to have, they’re actually physically settled. So if somebody wants to take delivery, they have to converge with the price of the physical. If you have no physical, somebody wants to take delivery, the price can go anywhere.

So it’s a dangerous commodity too short, right? If you have no physical against it. And actually sometimes we read news that the funds have been pushing cocoa prices. It’s actually completely untrue because the funds have been selling since February. They actually went from a length of 175,000 lots, so that’s 1.75 million tons of cocoa lengths, I think it was around like September last year in average, or a bit earlier, to 28,000 lots to 280,000 tons at the moment.

So they sold more than 80% of their length actually. And the people who’ve been buying the futures from the funds, it’s producers because they’re producing a lot less than they expected.

So what has been happening in the cocoa market is that you had a reduction of what we call the open interest, where both the longs would use their length and the shorts would use their shorts. And then we get into a market where you have less liquidity because you have less exposure, you have less longs and less shorts, and then the volatility increases.

So in the past when people were comfortable being, let’s say, having a 100 lots position now because it moves more than 10 times more than in the past, we’re going to have like a 10 lots position, right? So the market became more — due to the fact that we had a massive move and we have a massive deficit, so everybody’s reducing their positions and because of the increased volatility, we have less activity. And that’s what makes the point more volatile as well.

Andurand reaffirmed his $20,000 price target for later this year or next year… 

Tyler Durden
Sat, 06/01/2024 – 18:05

via ZeroHedge News https://ift.tt/0SGrJUl Tyler Durden

What A China-Taiwan Conflict Could Mean For Semiconductors, Gold

What A China-Taiwan Conflict Could Mean For Semiconductors, Gold

Via SchiffGold.com,

American-made weapons will soon be bound for Taiwan, American lawmakers are telling Taiwanese President Lai Ching-te, sending shockwaves of uncertainty through electronics and metals markets this week.

In a pointed “celebration” of Lai’s recent inauguration, Chinese military aircraft and warships have been conducting large-scale drills around the island. China considers Taiwan a strayed member of its territory and hasn’t ruled out the use of force to assert its claim.

“China will surely be reunified,” Chinese President Xi Jinping said in his New Year’s address. “Compatriots on both sides of the Taiwan Strait should be bound by a common sense of purpose and share in the glory of the rejuvenation of the Chinese nation.”

Michael McCaul, U.S. House Foreign Affairs Chairman, told Fox that the recent Chinese demonstrations are the most “provocative” yet. If China attacked Taiwan, McCaul predicted during his visit to the region, “it would make Iran shooting into Israel look like child’s play.”

“I think right now, we will probably lose,” he said.

One likely victim of such a conflict would be Taiwan’s semiconductor industry, which holds about 70% of the world market share. Total industry value is expected to set a record this year at $630 billion—but that could change if China invades Taiwan and, as McCaul warns, “the island doesn’t have the capacity to defend itself” or its industry.

“Everybody that has phones, cars—we have advanced weapons systems—everything’s dependent on semiconductors and this island, over time, because we’ve offshored [manufacturing],” McCaul told Fox News Digital. “And the shutdown of what’s happening [in Taiwan], semiconductors, would really shut down the world.”

Changes in the market for semiconductors mean changes in the market for many base metals, including silicon, germanium, and gallium, all of which are critical components for semiconductor manufacturing. Gold is also a key component of the production process because of its anti-tarnishing properties.

With a semiconductor shortage could come other electronics shortages, squeezing markets for everything from refrigerators to cell phones to electric vehicles. There’s precedent for such a shakeup, which occurred during the semiconductor shortage of the COVID-19 pandemic—and back then, the economic pandemonium didn’t stop short at consumer electronics.

“The recent semiconductor shortage isn’t some far-off issue—it affects everyday citizens around the globe,” the Council on Foreign Regulations reported last year. “Supply-chain challenges can yield price hikes for consumers and lost jobs for manufacturers. Companies laid off thousands of workers [during the COVID shortage] because the United States lacked chips.”

Such a drop in semiconductor production might initially appear to signal a decrease in demand for component metals, like gold. That seems to be the market’s immediate intuition, as shown by mildly ebbing gold prices following the Chinese drills—but a major complicating factor is quickly becoming apparent. China, already one of the world’s largest gold consumers, is busy buying up the precious metal at record rates. The country’s aggressions toward Taiwan will likely continue to drive precious metal prices upward, signaling a second precious metals boom when coupled with the rising market uncertainty and inflation that inevitably follow conflict.

“China is unquestionably driving the price of gold,” Ross Norman, chief executive of MetalsDaily.com, told the New York Times. “The flow of gold to China has gone from solid to an absolute torrent.”

Some experts suggest the move to amass precious metal stores could signal preparation for larger Chinese military involvement in Taiwan and increasing avoidance of ties with the U.S. dollar, which may be sanctioned in response to Chinese aggression. In short: China is betting on gold, not the dollar.

“There is absolutely no question that the timing and the sustained nature of [China’s gold] purchases are all part of a lesson that [the Chinese] have drawn from the Ukraine war,” Jonathan Eyal, associate director of the UK’s Royal United Services Institute, told the Telegraph. “The relentless purchases and the sheer quantity are clear signs that this is a political project which is prioritized by the leadership in Beijing because of what they see is a looming confrontation with the United States.”

“If [China] get[s] much closer to bullying Taiwan and countries start to move their investments out of China, [the gold reserves] will give them a bit of padding to be able to ride through some of the difficulties,” added Sir Iain Duncan Smith, co-chair of the UK Interparliamentary Alliance on China.

Meanwhile, the President has signed an aid package with $8 billion earmarked for Taiwan and the surrounding region, a move that aggravated US-China relations and will encourage economically painful sanctions on both sides. Such spending could also pull the trigger on domestic inflation, resulting in the continued weakening of the U.S. dollar even as the Chinese economy is strengthened by its gold reserves.

This type of monetary policy is why some economists, including Danial Lacalle of the IE Business School in Madrid, are sounding alarm bells at governmental inflation employed as a “policy, not a coincidence.” In this environment, Lacalle warns, it’s a bad idea to bet on inflated currency when choosing investments.

“Staying in cash is dangerous; accumulating government bonds is reckless; but rejecting gold is denying the reality of money,” Lacalle said.

Tyler Durden
Sat, 06/01/2024 – 17:30

via ZeroHedge News https://ift.tt/yBw0dE3 Tyler Durden

US Drivers Overwhelmingly Prefer Gasoline Cars To EVs

US Drivers Overwhelmingly Prefer Gasoline Cars To EVs

Authored by Tsvetana Paraskova via OilPrice.com,

Americans continue to be fans of gasoline-powered vehicles and prefer them to electric vehicles (EVs) and hybrids, a new study by KPMG has shown.

Assuming all costs and features are the same, just 21% of consumers prefer an EV, the inaugural KPMG American Perspectives Survey found.

The survey assessed the views of 1,100 adults nationwide to understand their outlook on their personal financial situation and the U.S. economy and their attitudes to energy and automobiles, among other issues.  

Asked which type of vehicle they want to purchase, assuming costs and features are equal, 38% said standard gas-powered vehicle, 34% picked hybrid, and only 21% an EV. Standard gasoline vehicles are the top preference in the Midwest and Northeast, with 40% and 37% of people preferring them to other types of cars, respectively.

In addition, consumer expectations for EV charging times during road trips showed a major gap between U.S. consumers and the perception of auto industry executives about consumer preferences, the KPMG survey found.

A total of 60% of consumers want charging in 20 minutes or less compared to 41% which is what auto executives believe.

The survey found that fewer consumers are likely to pay for self-driving features and entertainment, compared to safety, Wi-Fi, and a charging locator.  

Many U.S. consumers resist buying electric vehicles because of politics—Republican voters are likely to have negative opinions about EVs and wouldn’t buy such a car even when they can afford it.

Most conservative respondents in a Morning Consult poll for The Wall Street Journal view electric cars unfavorably, with 41% saying their opinion is ‘very unfavorable’ and another 20% ‘somewhat unfavorable.’

Just 31% of people who identified themselves as conservative said they had a favorable view of EVs. This compares with 66% of respondents who identified themselves as liberals and have a favorable opinion of electric cars.

Tyler Durden
Sat, 06/01/2024 – 16:20

via ZeroHedge News https://ift.tt/vqnOcG8 Tyler Durden

Bubble Symmetry: Could The NASDAQ Drop 60% And Round-Trip To 2,500?

Bubble Symmetry: Could The NASDAQ Drop 60% And Round-Trip To 2,500?

Authored by Charles Hugh Smith via OfTwoMinds blog,

The prospect of a 60% or 80% decline in the NASDAQ index is only horrifying if we stay invested in the index all the way down.

Speculative bubbles are interesting because they’re never bubbles in real time; they’re only recognized as bubbles after they’ve popped, as we sort through the wreckage of the aftermath. Speculative bubbles are equally interesting for their uncanny display of bubble symmetry and scale invariance, two traits of manias.

In bubble symmetry, the decline phase is the mirror-image of the manic boost phase, in both time and amplitude. For example, the NASDAQ’s dot-com bubble rose from around 1,100 in early 1997 to a peak above 5,000 in early March 2000, a rise of about 3,900 over three years.

The bubble-pop phase lasted about three years and covered a decline / round-trip back to around 1,100: a decline of about 77%. The first chart below shows the remarkable symmetry of the bubble’s ascent and collapse.

Scale invariance refers to the similarity of a 600 point bubble that arises in six months to a 6,000 point bubble that arises over 6 years: if we add a zero to the number of months (time) and the number of points (amplitude), the bubbles retain the same characteristics. Put another way, a speculative mania that lasts a week shares the same characteristics of a speculative mania that lasts a month and one that lasts a year.

Pulling back to look at the NASDAQ index from 1990 to the present, what’s striking is the modest scale of the dot-com bubble of 1997-2002. What looked like an almost unimaginably lofty peak in 2000 (5,048) now looks like a pipsqueak bubble compared to the current heights (17,032).

Also noteworthy is the time it took to reclaim the heights of the dot-com bubble. Almost 17 years passed before the index definitively topped its 2000 high of 5,048. But if we measure the purchasing power of $5,000 in 2000 and adjust for officially measured inflation from 2000 to 2018, the index had to top $7,360 to match the 2000 peak, a number it did not reach until early 2018–18 years after the peak.

Given that the index crashed back to 6,879 in March of 2020, it can be argued that the index didn’t definitively surpass the 2000 high until 2020, fully 20 years after the dot-com peak. That is a soberingly lengthy passage of time to recover the full value of cash invested at the very top of the bubble.

Now let’s project bubble symmetry on the current NASDAQ bubble. This is a FRED (St. Louis Federal Reserve) chart which doesn’t use nominal price but sets the value of the index on 2/5/1971 at 100. The basics of time duration and amplitude are essentially identical with the nominal price chart.

If the index follows the symmetry of the 2000 bubble, then we can anticipate a 60% decline by 2028 to the 2020 lows around 6,800. The full retracement of the bubble would occur by about 2032-33 with a decline to the base of the bubble, around 2,500–an 85% drop from the 2024 peak.

I’ve laid out a classic A-B-C-D pattern with a proposed narrative that tracks 1) systemic inflation and 2) the decay to zero of the Federal Reserve and Treasury’s ability to “save” the stock market with financial alchemy. I’ve made the case for sustained, systemic inflation here many times, and also made the case for diminishing returns on pumping newly issued currency into the financial system to artificially boost equities.

The prospect of a 60% or 80% decline in the NASDAQ index is only horrifying if we stay invested in the index all the way down. Those with no stake in the index will be mere observers. Since 93% of all stock ownership is concentrated in the top 10% households in the U.S., and the bottom 90% have relatively little invested directly or indirectly via pension funds and retirement funds, the full weight of this decline–which history suggests is inevitable–will fall on whomever believes such a decline is impossible and a turnaround is, well, just around the corner.

Those of us who lived through the 2000 bubbles experienced a trial run of all the emotions and market actions to come: the euphoria of easy, ever grander profits, the anxiety of the first decline, and then the swings from relief to fear as sharp recovery spikes wiped out those betting on a further decline before dropping to new lows.

If inflation is now systemic, then we can anticipate the hope-anxiety cycle will follow the “inflation is tamed / inflation is roaring back untamed” narrative. So the current peak of the happy narrative priced to perfection collapses when inflation doesn’t vanish, then recovers sharply when inflation temporarily recedes, and the the next leg down occurs when the next wave of inflation soars to new debilitating heights.

There are of course counter-arguments: stocks rise in inflationary eras, etc. There were counter-arguments in 2000 as well; many saw the first decline as a “buy the dip” opportunity, after $80 dot-com stocks fell to $40. That they would subsequently fall to $4 or $2 was not anticipated by the herd. That is of course the way bubbles pop: in fits and starts, always offering hope that the dreadful destruction of “wealth” will reverse.

We don’t control macro-dynamics or markets’ response to these dynamics. We can only choose to be observers or participants, that is, choose our exposure to risk.

*  *  *

Become a $3/month patron of my work via patreon.com. Subscribe to my Substack for free

Tyler Durden
Sat, 06/01/2024 – 15:10

via ZeroHedge News https://ift.tt/T2V6iOU Tyler Durden

General Dynamics’ New 155-Millimeter Shell Factory Opens As War Cycle Kicks Into Higher Gear

General Dynamics’ New 155-Millimeter Shell Factory Opens As War Cycle Kicks Into Higher Gear

General Dynamics’ new 155-millimeter artillery shell factory in Mesquite, Texas, is set to produce 30,000 shells per month, according to a New York Times report. This will provide crucial support to the Ukrainian Armed Forces on the first and second lines and bring the US Army closer to its 100,000 shell target goal by 2025. However, this goal remains far behind Russia’s current 155mm shell production capacity of 250,000 rounds per month.

On Wednesday, National Security Council spokesperson John Kirby told reporters the new Mesquite shell factory “will significantly increase our country’s ability to manufacture parts that are used to produce artillery ammunition.”

Kirby said construction at the Mesquite factory began last year with funds allotted by the $95 billion security supplemental passed by Congress last month “to stand up new production lines as part of a national effort to significantly increase the number of artillery shells that we produce every month.”

At full capacity, the factory will produce 30,000 155mm shells a month. The latest data from NATO’s secretary-general showed that Ukraine fires between 4,000 and 7,000 shells per day. The West is currently depleting 155mm stockpiles, along with other crucial weapons. 

Shell factories in Scranton and Wilkes-Barre, Pennsylvania, currently produce about 36,000 155mm shells per month. Once the Mesquite plant reaches its full capacity of 30,000 shells per month, the US Army will be closer to achieving its goal of 100,000 shells per month by 2025. 

The Biden administration’s disastrous foreign policies have resulted in a chaotic world. From Eastern Europe to the Middle East, these conflicts, some of which are broadening, have resulted in the US dangerously depleting weapon and ammunition stockpiles.

To correct this, the US and other Western nations have been ramping up defense spending as the war cycle kicks into a higher gear. This has sparked a bull market in defense stocks, as there is no end in sight to conflicts resolving this year. 

Tyler Durden
Sat, 06/01/2024 – 14:35

via ZeroHedge News https://ift.tt/6svUp5G Tyler Durden

Why Consumers Are Angry About The Economy In Five Pictures

Why Consumers Are Angry About The Economy In Five Pictures

Authored by Miked Shedlock via MishTalk.com,

Today the BEA released April data on inflation-adjusted income and spending. Let’s discuss the charts.

Data from the BEA and BLS, chart by Mish

Personal Income and Wages Key Points

  • DPI stands for Disposable Person Income. Disposable means after taxes.
  • Real means inflation adjusted.
  • Income includes wages, dividends, rent and all sources of income.

Workers who don’t receive dividends or rental income view the world as shown by the red lines. Those who have no assets are renters.

Index of Hourly Wages and Multiple Jobholders

One reason Disposable Personal Income is up: People need to work multiple jobs just to make ends meet.

This is also reflected in the blue line in the lead chart.

Personal Income Four Ways

Personal Current Transfer Receipts

The above chart introduces Personal Current Transfer Receipts (PCTR). PCTR is income for which no goods were produced and no work performed.

PCTR includes Medicare, Medicaid, disability payments, food stamps, rent assistance, and Social Security.

PCTR is included in Disposable Income in all of the above charts.

The green line in the above chart shows Real DPI minus PCTR. Please compare the green line to the red line.

PCTR as a Percentage of Real Personal Income

Hoot of the Day

One of the reasons people are angry is the inflation-causing free money ran out. People increasingly have to work multiple jobs to make ends meet.

CPI Up 0.3 Percent With Rent Still Rising Steeply

Rent rose another 0.4 percent in April. Food and beverages were flat with food at home declining but food away from home rising.

CPI data from the BLS, chart by Mish

Key CPI Points

  • Rent is up at least 0.4 percent for 32 consecutive months.
  • The CPI weighs rent much higher than PCE. That’s why the CPI is up 3.6 percent from a year ago and PCE only 2.7 percent.
  • All of the preceding income charts would look much worse if adjusted by the CPI rather than the PCE price index.

Please read those points again. The first three income charts are worse than they look if adjusted by the CPI.

For discussion and additional CPI charts, please see CPI Up 0.3 Percent With Rent Still Rising Steeply

Rent of primary residence, the cost that best equates to the rent people pay, jumped another 0.4 percent in April. Rent of primary residence has gone up at least 0.4 percent for 32 consecutive months! 

Home Prices Hit New Record High, Don’t Worry, It’s Not Inflation

The Case-Shiller national home price index hit a new high in February. Economists don’t count this as inflation.

This is a bonus image.

Case-Shiller national and 10-city indexes via St. Louis Fed, OER, CPI, and Rent from the BLS

On May 2, I sarcastically commented Home Prices Hit New Record High, Don’t Worry, It’s Not Inflation

That chart is one month stale now. We hit another new record in March.

The Fed’s Preferred Inflation Measure, PCE, Shows No Further Progress

More weakening: Real (inflation-adjusted) Income and spending was negative in April. The PCE price index remained flat at 0.3 percent for the month and 2.7 percent for the year.

Chart from the BEA, annotations by Mish

Earlier today I noted The Fed’s Preferred Inflation Measure, PCE, Shows No Further Progress

This post contains four charts related to personal income and outlays discussed above.

Anger Synopsis

Consumers are angry, and it’s reflected in the polls. I have been discussing the reasons for angry consumers all year.

But Biden and most economists still don’t get it. They think the economy is doing well. Tell that to renters looking to buy a home, stuck with rent going up month after month.

People Who Rent Will Decide the 2024 Presidential Election

On April 20, I wrote People Who Rent Will Decide the 2024 Presidential Election

Who Are the Renters?

The answer is younger voters and blacks.

The Apartment List 2023 Millennial Homeownership Report shows Millennial homeownership seriously lags other generations.

Generation Z homeownership is dramatically lower still.

And according to the National Association of Realtors, the homeownership rate among Black Americans is 44 percent whereas for White Americans it’s 72.7 percent.

That’s the largest Black-White homeownership rate gap in a decade.

Will the Conviction of Trump Matter?

I doubt it. People will vote with their pocketbook.

For discussion of the political side, please see Trump Found Guilty – a Travesty of Justice for America

If you are not interested in politics, please ignore that link and focus on the rest of this post.

Returning to the economy, inflation will finally come down when rent abates but there will be a price. The price is recession.

I expect a recession this year. It will not surprise me at all if a recession started in 2024 Q2, perhaps April.

Tyler Durden
Sat, 06/01/2024 – 14:00

via ZeroHedge News https://ift.tt/vU4Z2A0 Tyler Durden

Electricity Demand May Cure Debt Concerns

Electricity Demand May Cure Debt Concerns

Authored by Lance Roberts via RealInvestmentAdvice.com,

The future of electricity demand for everything from electric cars to Bitcoin mining to artificial intelligence may also be the cure for our debt concerns.

Before you dismiss that statement, let me explain.

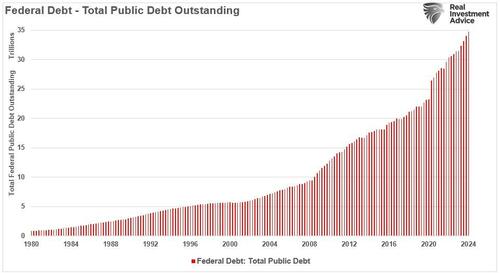
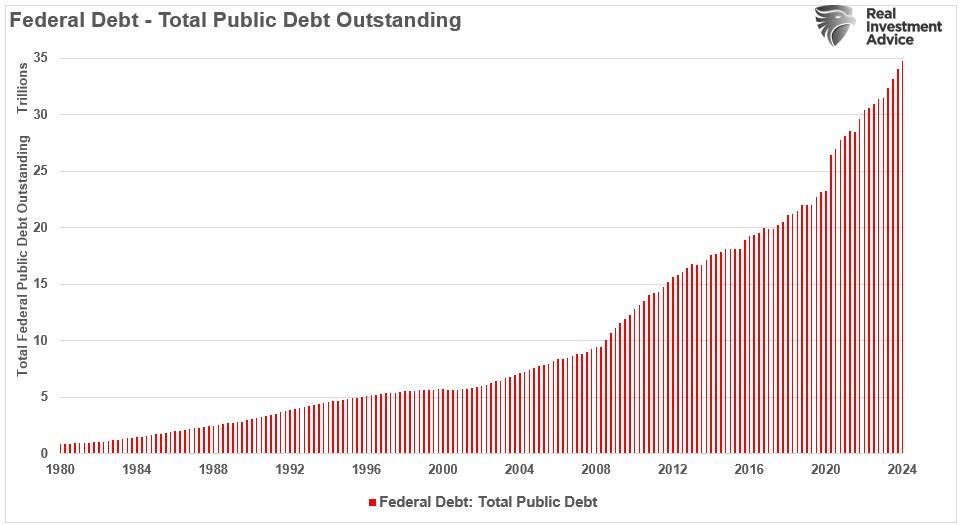
One of the bears’ primary arguments against the financial market and the economy’s health is what is perceived as the surging increase in Government debt. That increase in debt supports their frantic calls for the “end of the dollar,” economic disruption, and essentially the demise of the U.S. as a global power. Looking at the increased Government debt in a vacuum, you can understand the concern.

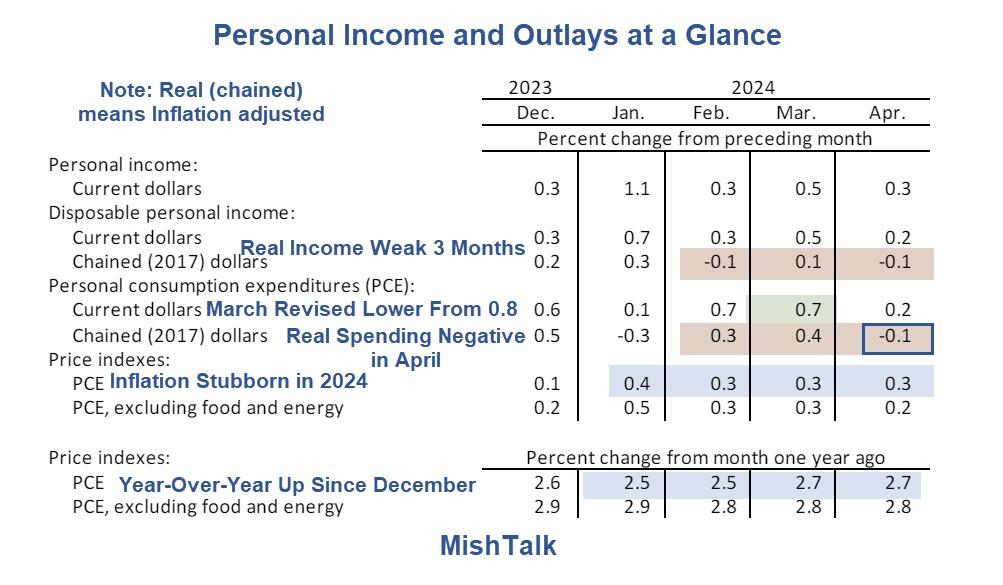
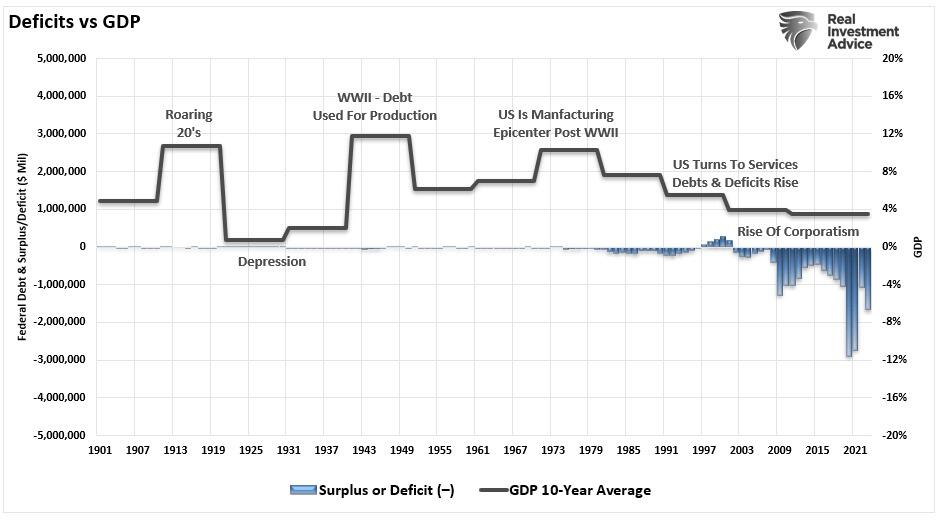
Of course, the increase in federal debt results from excess government spending, particularly since the pandemic-related shutdown. We see the surge in the federal deficit, the largest since the financial crisis and the most significant deficit outside of a wartime economy.

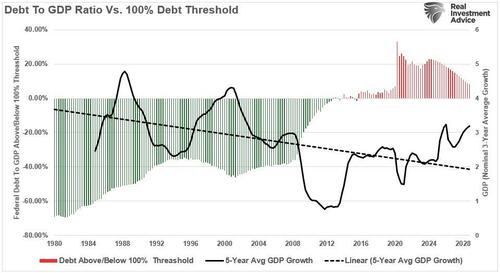
It is also notable that economic growth has slowed markedly as both debts and deficits have increased. That decrease in economic growth is an essential point of our discussion.

In “40-Years Of Economic Erosion,” we discussed the difference between productive and unproductive debt. To wit:

The problem is that these progressive programs lack an essential component of what is required for ‘deficit’ spending to be beneficial – a ‘return on investment.’ 

Country A spends $4 Trillion with receipts of $3 Trillion. This leaves Country A with a $1 Trillion deficit. In order to make up the difference between the spending and the income, the Treasury must issue $1 Trillion in new debt. That new debt is used to cover the excess expenditures but generates no income leaving a future hole that must be filled.

Country B spends $4 Trillion and receives $3 Trillion income. However, the $1 Trillion of excess, which was financed by debt, was invested into projects, infrastructure, that produced a positive rate of return. There is no deficit as the rate of return on the investment funds the “deficit” over time.

There is no disagreement about the need for government spending. The disagreement is with the abuse and waste of it.

John Maynard Keynes’ was correct in his theory that in order for government ‘deficit’ spending to be effective, the ‘payback’ from investments being made through debt must yield a higher rate of return than the debt used to fund it.

Currently, the U.S. is ‘Country A.”

Read that carefully, as electricity demand may provide that needed change to the debt dynamic.

Electricity Demand To Surge

As noted, the United States power grid has lacked sufficient investment to handle the increasing burdens of electricity demand in previous years. It isn’t just a growing population that needs more housing, mobile phones, laptops, and computers. However, adding electric vehicles, bitcoin mining, and artificial intelligence will overwhelm the current electricity supply in the U.S.

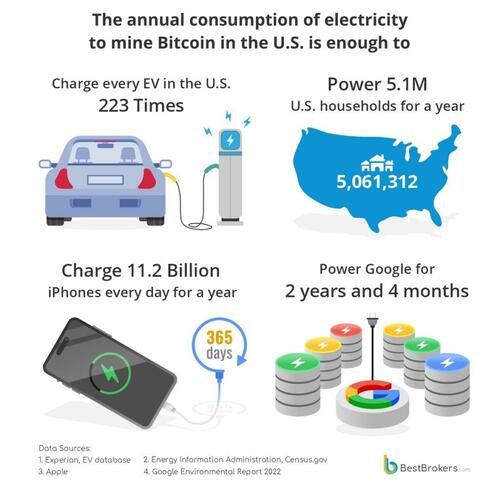
For example, bitcoin mining demands an extreme amount of electricity. As noted by Paul Hoffman in Bitcoin Power Dynamics:

“The daily consumption of 145.6 GWh for Bitcoin mining in the U.S. is about 1.34% of the total daily power consumption in the country. Despite the small percentage this is still an enormous amount of electricity, keeping in mind that the U.S. is a heavily-industrialized country consuming a lot. When we extrapolate this daily consumption to a year, we get 53,144 GWh.”

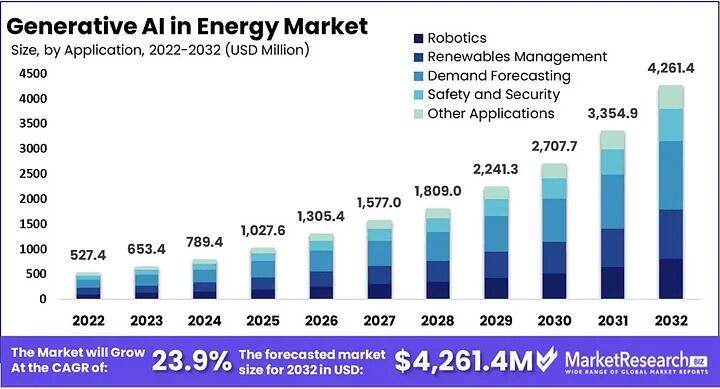
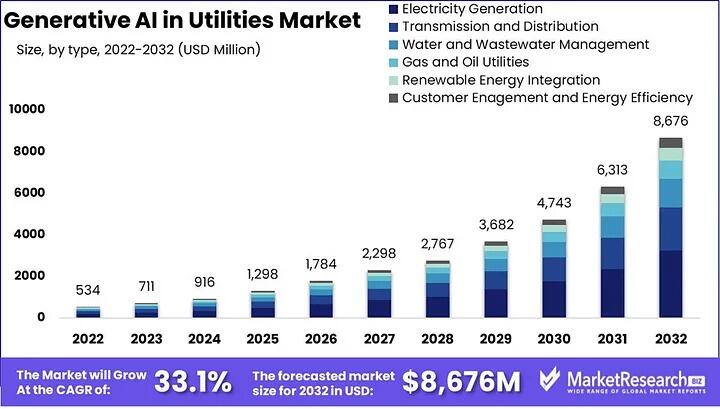
Bitcoin mining is a relatively small industry with a large footprint on electricity demand. However, “generative artificial intelligence (AI)” is a different beast. According to S&P Global Commodity Insights, the electricity needed for AI remains unclear, but the technology will lead to a significant net increase in US power consumption. Medium recently had some charts detailing that growth.

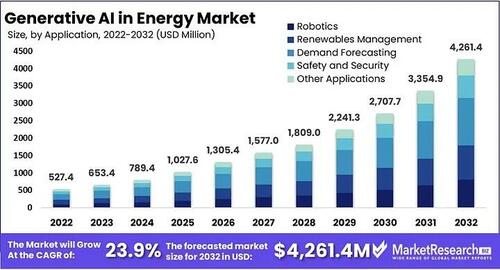
“AI energy demand is projected to surge from approximately $527.4 million in 2022 to a substantial $4,261.4 million by 2032, with a robust compound annual growth rate (CAGR) of 23.9% from 2023 to 2032.” – Medium.

“Simultaneously, the Utility Market is expected to experience even more significant expansion, increasing from $534 million in 2022 to a substantial $8,676 million by 2032, driven by a remarkable CAGR of 33.1% from 2023 to 2032.”
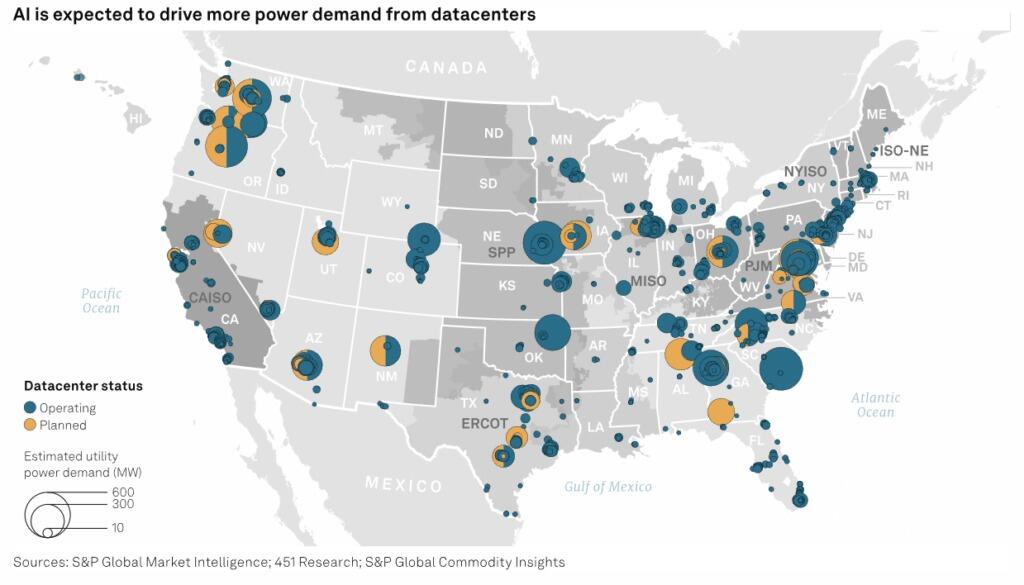
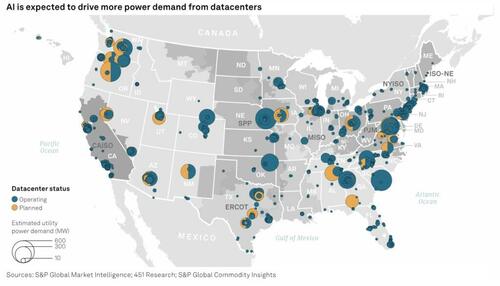
As S&P points out:

“Power demand from operational and currently planned datacenters in US power markets is expected to total about 30,694 MW once all the planned datacenters are operational, according to analysis of data from 451 Research, which is part of S&P Global Market Intelligence. Investor-owned utilities are set to supply 20,619 MW of that capacity. To put those numbers into perspective, consider that US Lower 48 power demand is forecast to total about 473 GW in 2023, and rise to about 482 GW in 2027.”

So, what does this have to do with the debt?

Growing Our Way Out

We have used deficit spending for decades to fund social welfare programs. Those programs have a long-term negative multiplier on economic growth. However, the future requires building an electricity infrastructure, which is a different dynamic. However, using deficit spending for projects with a “return on investment,” such as power production (geothermal, nuclear, tidal) or broadband, which users pay a fee to consume, is valid. This is because the long-term revenue generated by these projects repays the debt over time. Furthermore, these projects are labor intensive, creating demand for jobs, commodities, and capital expenditures.

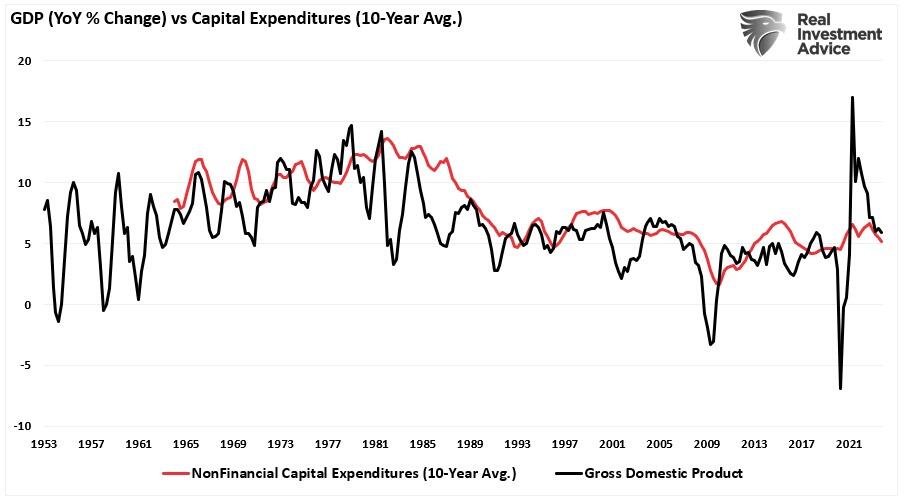
Since 1980, capital expenditures (CapEx) have dropped as economic growth slowed. The chart shows the 10-year average annual change in CapEx vs. GDP. If economic growth (primarily consumption) is slowing, then the demand to expend CapEx is also reduced. This is because corporations seek out cheaper alternatives such as offshoring, productivity increases, and wage suppression.

However, building infrastructure is very labor-intensive, and CapEx is labor—and investment-intensive. Those dynamics change the economic growth dynamic.

While corporations increase capital investment to build the power supply, the Government will likely enter the fray with further infrastructure-focused spending bills. This is because AI is a critical component of ensuring the defense and national security of the United States. However, instead of issuing debt to spend on domestic welfare programs, the debt used in infrastructure will create economic growth through labor creation.

The chart below assumes we will continue to issue debt at the average quarterly pace since 2021. However, instead of wasting money, we focus on productive investments while maintaining all current spending programs and obligations. Assuming some conservative growth estimates resulting from the investments, the “debt to GDP” ratio will begin declining in 2026 and revert to more sustainable levels by 2030.

Conclusion

While the bears constantly ring the alarm bell about the current level of debt and deficits, the more dire economic consequences they forecast may fail to come to fruition.

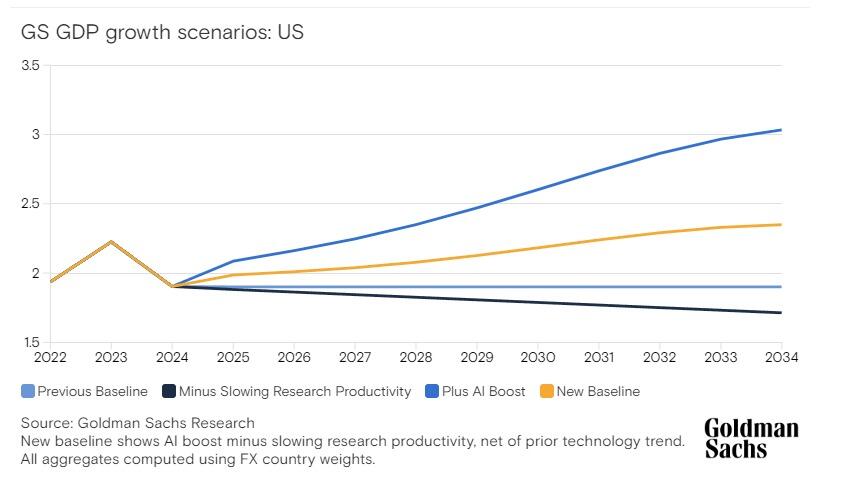
As noted by Goldman Sachs:

“Generative artificial intelligence has the potential to automate many work tasks and eventually boost global economic growth. AI will start having a measurable impact on US GDP in 2027 and begin affecting growth in other economies worldwide in the following years. The foundation of the forecast is the finding that AI could ultimately automate around 25% of labor tasks in advanced economies and 10-20% of work in emerging economies.”

They currently estimate a growth boost to GDP from AI of 0.4 percentage points in the US.

Increases in productivity, productive capital investment, and increased labor demand for the infrastructure buildout (which will also result in higher wages) should provide the economic boost needed.

Will it solve all of the current socio-economic ills facing the U.S.? No. However, it may provide the growth boost necessary to revitalize economic growth and prosperity in the U.S., which we have not seen since the 1970s.

It may also just be enough to keep the demise of the U.S. from occurring any time soon.

Tyler Durden
Sat, 06/01/2024 – 11:40

via ZeroHedge News https://ift.tt/OpoFtLN Tyler Durden