Goldman: “Keep Pressing” NatGas Shorts Amid Weakest October Demand In 61 Years
Mild weather across the Lower 48 has capped natural gas demand, keeping futures locked in a bearish sideways trend, unable to breach the $3 per million British thermal units level.
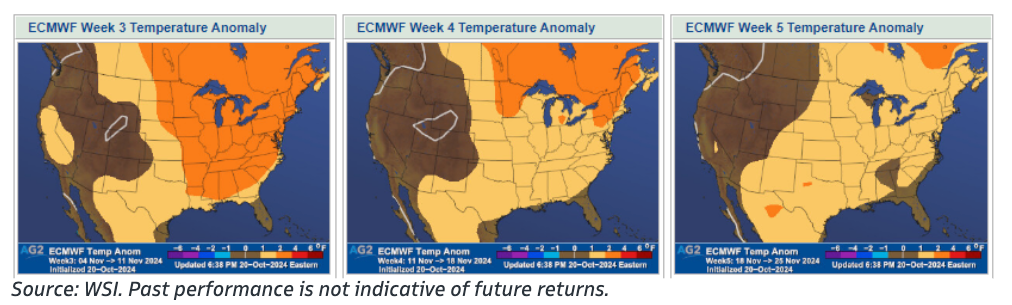
Goldman’s Thomas Evans published a note on Monday about the US NatGas market, pointing out that October’s unusually warm weather in the Lower 48 has led to the third-lowest Heating Degree Days (HDDs) for October since 1963.
“The big picture since the start of last week is that not much has changed except that we’ve rolled one week forward with warmer forecasts for start of November, and price has sold off to keep pace with the HDD shedding.
…
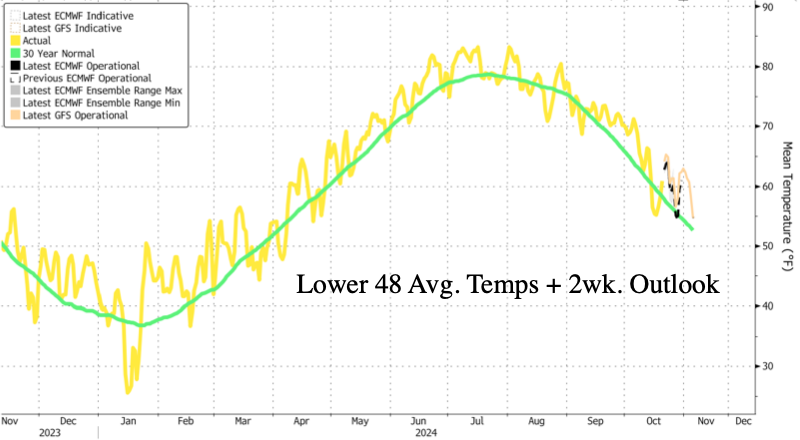
We gained some HDDs in overnight runs with a secondary trough digging into the East, but it is still really warm – we’re looking at the third lowest HDDs for October since 1963. This warmth (in the East) could extend into the first half of November – the long range European models keep the warmer bias:
Looking at forecasts for this winter, Evans expalined to clients:
Nevertheless, as with last week, we could argue that we haven’t really learned anything new for December to March. We still don’t know anything about (proper) winter weather, and we still don’t know anything about winter production – although we seem to be asking producers not to give us more gas until at least December (and we dropped 2 gas rigs last week).
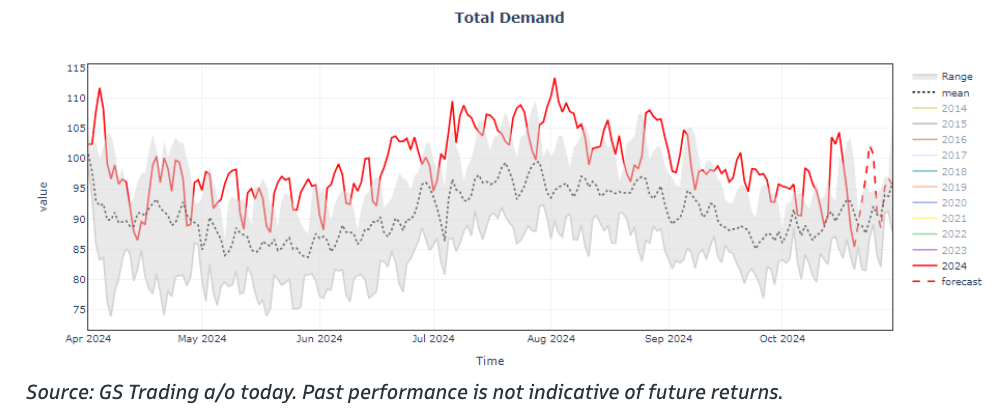
Total Demand should recover through the end of the month:
In NatGas markets, he advised clients on how to trade through December:
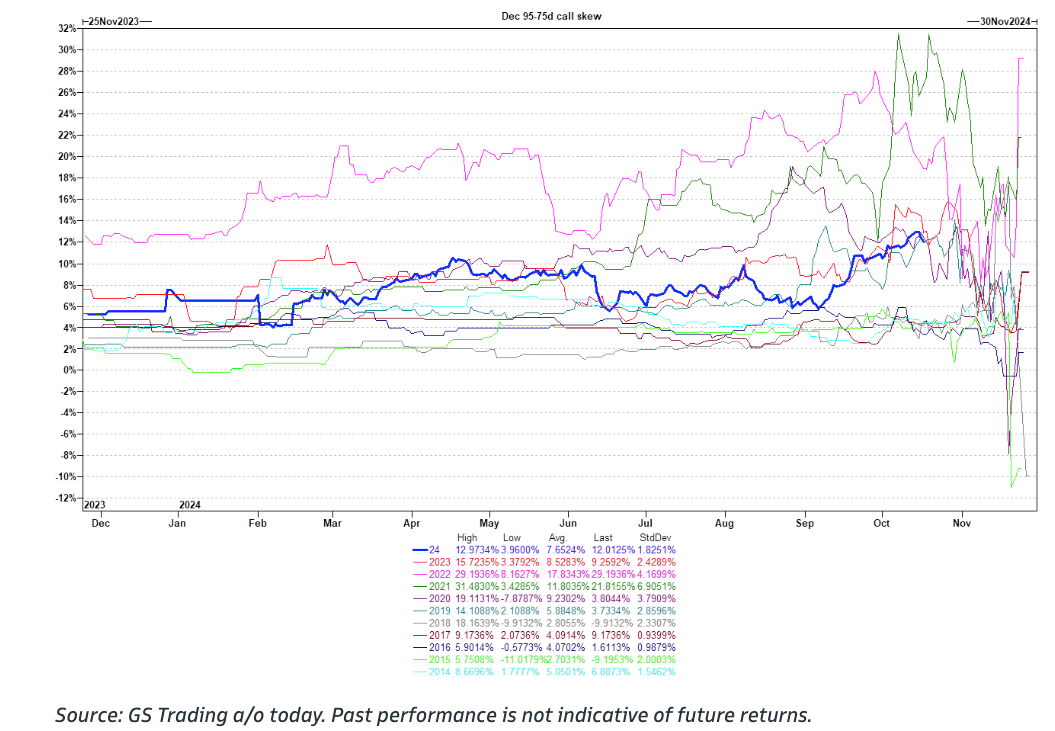
Given how well the bear trend has worked for November, folks may keep pressing shorts into December – if we roll warm this will work, however CTAs look max short here and our metereologists assure us that there’s little statistical follow through from a warm Nov start into Dec (“the warmest November on record (2001) rolled into the 7th warmest December on record. However, the 2nd warmest November (2016) rolled into a colder than 30-year normal December instead – CWG”). Selling December $2.25 puts to own $3.25/$3.75 call spreads doesn’t seem crazy, especially as Z 95-75d call skew looks a little rich:
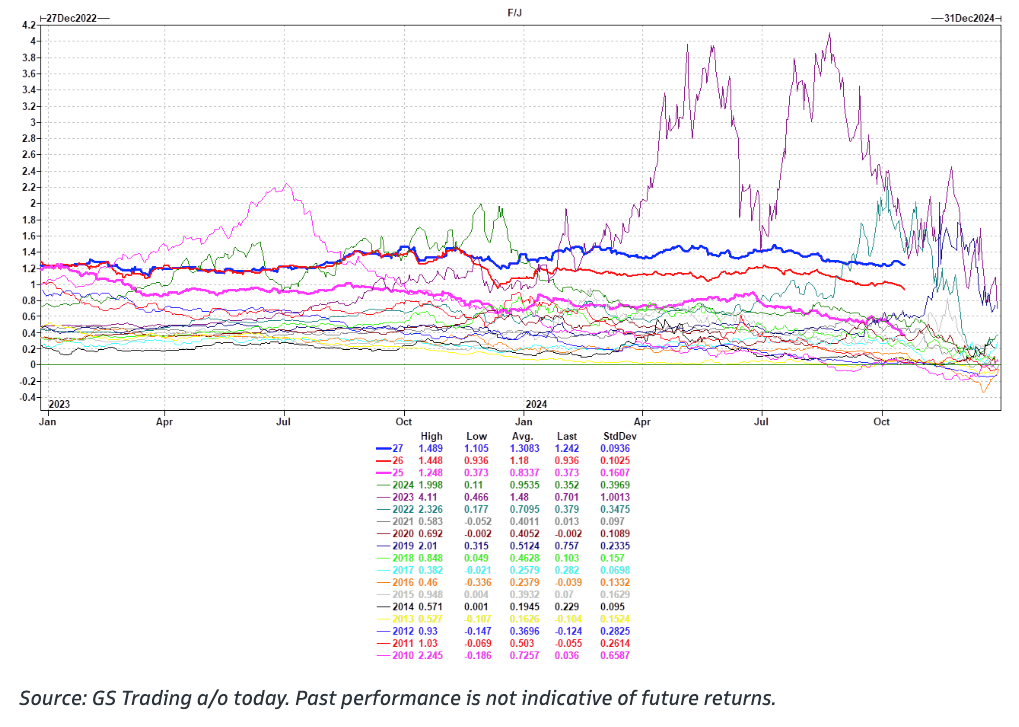
The January/April spread is now just 2c over where we expired last year, and last year we had a big November flush of production, a warm start to November, and a very warm December. In fairness the spread was pricing weaker in mid-December ’23 before indications of SSW causing a PV intrusion started to crop up near the end of the month, lending strength to the January into expiry. Nevertheless, it still feels a little early to write off so much deliverability risk premia.
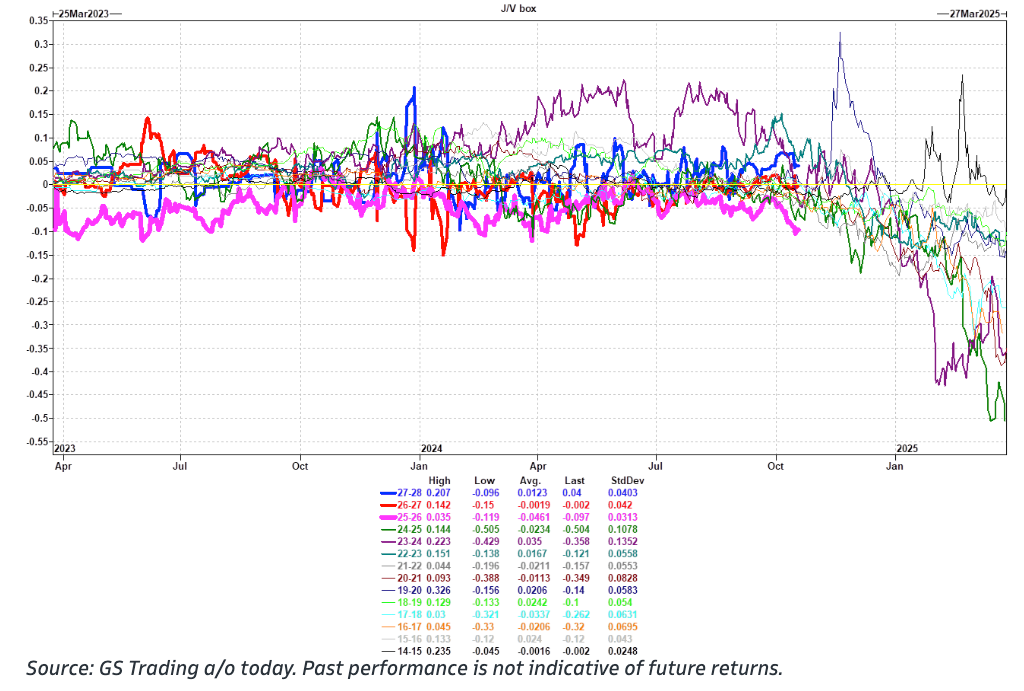
If you do think that winter is over and gas is doomed – or that any pop in weather will get flooded with production, then you’ll be worried about cash pricing next shoulder season. You might just generally worry about cash pricing in the shoulder season given continued solar and battery deployment – if so then the April/Octoberspread might be a better sell than the January/April. We like it as a box vs the J/V 26 – we’ll need to be calling for Haynesville growth into X5H6, and JV26 might actually be tight, and if April/October25 rallies, you probably get a bit of a sympathy move in April/OctoberV26 to protect you (while being limited to the downside given you’re sat on the other side of November25/March26. Although we’ve done some of the work a little early, these boxes have tended to roll down. Early blue maps probably hurt the trade, but there are better ways to get long gas in front of it (see above).
A separate but recent note from the Energy Information Administration and the Natural Gas Supply Association forecasted colder winter weather trends for the Lower 48.
“We assume this winter will be colder than the last winter across much of the country, especially in the Midwest,” the EIA said.
NGSA wrote that November-March will be 7% colder than last year. Based on more frigid temperatures, the group projects around a 14% increase in residential and commercial demand and a 7% increase in industrial demand.
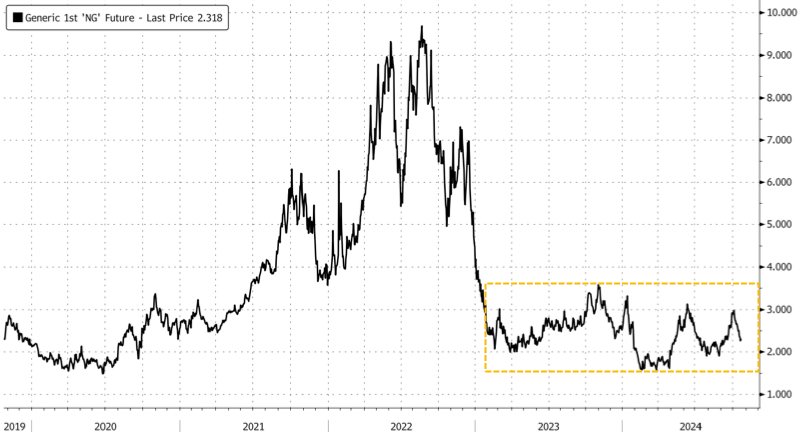
NatGas futures trading in New York has been range-bound for nearly two years, primarily because of lower demand and abundant NatGas supplies.
The latest data from Bloomberg shows that the average temperatures for the Lower 48 are sliding down the 30-year trend line.
Winter is ahead.
Tyler Durden
Mon, 10/21/2024 – 14:05
via ZeroHedge News https://ift.tt/IYegOAN Tyler Durden