Musk Derangement Syndrome: European Censors Warn They May Level Fines Based On All Of Elon’s Businesses

Musk Derangement Syndrome: European Censors Warn They May Level Fines Based On All Of Elon’s Businesses

Authored by Jonathan Turley,

I have previously written about the European Union’s (EU) effort to use its infamous Digital Services Act (DSA) to force companies like X to censor Americans, including on postings related to our presidential election. This is a direct assault on our free speech values, and yet the Biden-Harris Administration has not raised a peep of objection. Now, the EU is threatening to set these confiscatory fines with reference to revenue from companies other than X, including Space X.

The EU has warned Musk that it is allowed to hit online platforms with fines of as much as 6% of their yearly global revenue for refusing to censor content, including “disinformation.” The inclusion of companies like Space X is ridiculous but perfectly consistent with the effort of the EU to use the DSA to regulate speech in the United States and around the world.

The EU is arguing that as a “provider” Musk’s entire business portfolio can be included in the fine calculation.

It is ridiculous and chilling. Musk’s other companies have nothing to do with the platform policies of X. It is simply an unhinged coercive measure designed to break Musk.

X has objected:

“X Holdings Corp. submits that the combined market value of the Musk Group does not accurately reflect X’s monetization potential in the Union or its financial capacity, In particular, it argues that X and SpaceX provide entirely different services to entirely different users, so that there is no gateway effect, and that the undertakings controlled by Mr. Elon Musk ‘do not form one financial front, as the DMA presumes.’”

However, the abusive calculation is precisely the point. The EU censors are making an example of Musk. If they break, no company or executive could hope to defy them.

They are being cheered on in this effort by an anti-free speech movement that includes America politicians and pundits.

One of the lowest moments came after Elon Musk bought Twitter on a pledge to restore free speech protections, Clinton called upon European officials to force Elon Musk to censor American citizens under the DSA. This is a former democratic presidential nominee calling upon Europeans to force the censorship of Americans.

She was joined recently by another former democratic presidential nominee, John Kerry, who called for government crackdowns on free speech.

In my new book on free speech and various columns, I write about the DSA as one of the greatest assaults on free speech in history. As I wrote in the book:

“Under the DSA, users are ’empowered to report illegal content online and online platforms will have to act quickly.’ This includes speech that is viewed not only as ‘disinformation’ but also ‘incitement.’ European Commission Executive Vice President Margrethe Vestager has been one of the most prominent voices seeking international censorship. At the passage of the DSA, Vestager was ecstatic in declaring that it is ‘not a slogan anymore, that what is illegal offline should also be seen and dealt with as illegal online. Now it is a real thing. Democracy’s back.’”

The pressure on Musk’s other companies has also been ramping up in the United States. Recently, the California Coastal Commission rejected a request from the Air Force for additional launches from Vandenberg Air Force Base. It is not because the military agency did not need the launches. It was not because the nation and the community would not benefit from them. Rather, it was reportedly because, according to one commissioner, Musk has “aggressively injected himself into the presidential race.”

It is all part of Musk mania and the need for the anti-free speech movement to break the only executive who has defied the pressure from this alliance of media, academic, corporate, and government officials.

As I have discussed previously, there is a crushing irony in all of this. The left has made “foreign interference” with elections a mantra of claiming to be defending democracy. Yet, it applauds EU censors threatening companies that carry an interview with a targeted American politician. It also supports importing such censorship and blacklisting systems to the United States. When you agree with the censorship, it is not viewed as interference, but an intervention.

Anti-free speech advocates like Clinton are now going old school. After trying to convince Americans to embrace censorship and blacklisting, they are now praising governments like Brazil and the EU for directly imposed speech regulations on American citizens.

The question is where is the Biden-Harris Administration and Congress. You have a foreign government forcing the censorship of speech of American citizens. We routinely impose reciprocal trade barriers on countries for interfering with our markets. Yet, when a government seeks to curtail political speech in the United States, our leaders are silent.

*  *  *

Jonathan Turley is the Shapiro Professor of Public Interest Law at George Washington University and the author of “The Indispensable Right: Free Speech in an Age of Rage.”

Tyler Durden
Wed, 10/23/2024 – 08:45

via ZeroHedge News https://ift.tt/Hdn82y5 Tyler Durden

Media Trots Out Disgraced Black Figures To Shame Black Men Into Voting For Harris

Media Trots Out Disgraced Black Figures To Shame Black Men Into Voting For Harris

When Democrats start losing the black vote they used to roll out Al Sharpton and Jesse Jackson to frighten them into submission.  Today, they call in Barack Obama or Michelle Obama to reel black voters back into the fold.  But what happens when the old false leadership ploy doesn’t work?

The DNC and the establishment media are in a panic this month over polling data which indicates a shrinking support base for Kamala Harris among minority groups.  Some journalists are in denial.  MSNBC and others argue that the black voter crisis is “overblown.”  They note that recent polls show black men still supporting Harris at 70%, but compare this number to 2020 when 79% of black men voted for Biden.  In 2016, 82% voted for Hillary Clinton, and in 2012 89% voted for Barack Obama.  

A trend seems to be developing here, and it does not bode well for the political left.  The Democratic Party has long treated minorities as their political property, consistently claiming to be their champion while viciously attacking any minority voters that leave the plantation.  The steady decline in minority support for Democrats suggests an awakening is in progress, or maybe a rebellion.

In response, the media and Democrats have reverted to shaming tactics, calling black men misogynistic for not clamoring to vote for Harris.  Black men say it’s not about her gender, it’s about her policies and her consistent failures.  However, the leftist political machine refuses to listen.  They have become so indignant that they’re trotting out any black figure they can find to browbeat black men, including disgraced figures. 

Kamala Harris went on a “No really, I’m a Christian…” campaign this week, visiting two black churches in Atlanta including the church of Pastor Jamal Bryant.  Bryant argued that real men would vote for Harris because real men support women.  His comments ring a bit hollow considering his own life choices.

The media also recruited election denier, race hustler and defeated Georgia candidate for governor, Stacey Abrams, who admonished black men as sexist and racist for not coming out in greater numbers for Harris.

This is the same line of attack used by Barack Obama in his recent statements that “the brothas” were not doing their part to keep Harris in power. 

The continuing narrative suggests a coordinated DNC campaign – Meaning, they have actively decided that shaming black men is the best strategy they have. 

If that doesn’t work, a new Harris ad campaign is aimed at frightening black men with threats that women won’t date them if they don’t vote Democrat.  It’s also designed to convince women to follow through on the threat.

The Democrats are confident in their ability to retain the black female demographic in 2024, but it’s men of all races that the leftists have a problem convincing.  Leftist politicians refuse to admit that they were wrong to embrace the woke feminist narrative that masculinity is “toxic” and that men must be “reeducated” from childhood to act less like men and more like women.  While this propaganda campaign was specifically aimed at straight white men, they obviously did not count on straight black men joining the fight against intersectional feminism.   

The messaging smells of desperation.

Tyler Durden
Wed, 10/23/2024 – 08:30

via ZeroHedge News https://ift.tt/ohUeIvM Tyler Durden

US Futures Slide For A Third Day As Dollar, Yield Storm Higher On Trumpflation Trade

US Futures Slide For A Third Day As Dollar, Yield Storm Higher On Trumpflation Trade

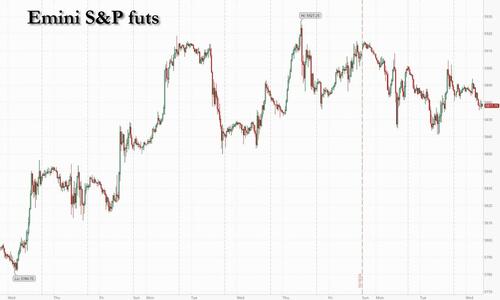
US equity futures are lower for the third day in a row on a busy earnings day with yield and the dollar both extending gains as the prospect of a Trump presidency sparking more inflation and leading to less aggressive rate cuts continued to weigh on markets. As of 8:00am ET S&P and Nasdaq futures are down 0.3%, with megacap tech names mostly lower: NVDA -0.4% and TSLA -0.6%. SBUX fell -5.3% as it missed revenue expectation; MCD is -6.0% lower given the E. Coli headlines. Global stocks trade mostly lower ex China with attention remaining on the micro before NFP next week and the Election/FOMC the week after. Bond yields are 2bp higher pushing the 10Y as high as 4.24%, the highest since July 26. USD surges while the yen plunges as low as 153 as yields on Japan’s 40-year notes reached the highest in 16 years. Commodities are mixed: base metals are higher, oil and precious metals are lower: oil fell 1.0%. Today, key macro data includes Existing Home Sales and Fed Beige Book. We will have a busy earnings schedule across sectors, including BA, IBM, KO, T, TMUS, TSLA, and VRT.
In premarket trading, Tesla was down 0.6% ahead of earnings this afternoon, while Boeing shares were trading marginally higher after another disastrous quarter. In other single stocks, Enphase Energy was down more than 12% as the solar equipment maker forecast disappointing revenue for the fourth quarter. McDonald’s (MCD) drops 6% after a severe E. coli outbreak tied to the restaurant chain’s Quarter Pounders sickened dozens of people in the US and killed one. Vertiv (VRT) fall 7% after the electrical power equipment company issued a fourth-quarter sales forecast that trailed Wall Street expectations. The company also reported a slowdown in order growth from the previous quarter. Starbucks (SBUX) drops 4% after pulling guidance for 2025 after sales plunged for a third consecutive quarter. Here are the other notable premarket movers:

  • Alto Neuroscience (ANRO) slides 63% after saying a Phase 2b study of its treatment in patients with major depressive disorder didn’t meet the primary endpoint.
  • AT&T (T) rises 2% after the company gained more mobile subscribers in the third quarter than analysts expected.
  • CoStar (CSGP) drops 5% after the real estate services company cut its full-year sales forecast.
  • Enphase Energy (ENPH) drops 15% after the solar-equipment maker’s 4Q revenue forecast and 3Q disappointed. Analysts flagged weakness in Europe, with Piper Sandler describing demand there as “dismal.”
  • JinkoSolar (JKS) rises 6% along with other US-listed Chinese solar names after news that the US Commerce Department is considering reducing tariffs on the sector circulated in local media.
  • Qualcomm (QCOM) declines 3% as Arm Holdings is canceling a license that allowed Qualcomm to use Arm’s intellectual property to design chips
  • Stride (LRN) soars 27% after the company’s first-quarter revenue and forecast for the second quarter surpassed estimates.
  • Texas Instruments (TXN) rises 3% after the chipmaker reported third-quarter results that beat expectations.

The broader risk-off tone comes as investors pare back bets on rapid policy easing, given signs that the US economy remains robust and concerns about higher inflation as a Republican sweep looks increasingly likely. Most Fed officials speaking earlier this week signaled they favor a slower tempo of rate reductions.

The bond moves have made earnings seem like a “bit of a sideshow,” said James Athey, a portfolio manager at Marlborough. “Shifting growth, the Fed and election expectations have created a bit of a perfect storm for a Treasury market which was a little over its skis in terms of rate cut expectations just a month or so ago.”

The debate about the speed and scale of the Fed’s monetary easing continued, with Bank of America Corp. Chief Executive Officer Brian Moynihan urging Fed policymakers to be measured in the magnitude of interest-rate reductions.
The International Monetary Fund, meanwhile, lowered its global growth forecast for next year and warned of accelerating risks ranging from wars to trade protectionism, even as it credited central banks for taming inflation without sending nations into recession.

“Of course Tesla is still one of those stocks which has the potential to get people off their seats,” Athey said. “Discounting any volatility even at the index level after they report would be foolish. Boeing remains in a bad way and so it’s hard to see material good news coming there.”

In Europe, the Stoxx 600 was down 0.2% as losses in consumer products and basic resources are offset by gains in autos and personal care names. Personal care stocks outperform, led by Reckitt Benckiser’s gains after reporting a smaller drop in like-for-like sales than feared. Consumer products are among lagging sectors, weighed down by L’Oreal’s post-earnings rout which tumbled on lower organic sales growth/China challenges. Among individual moves, Deutsche Bank dropped as analysts noted higher-than-expected provisions. Volvo Cars (-3.5%) beat but cut guide and Heineken (+2%) organic sales in-line w/ Americas region o/p.  Here are the other notable European movers:

  • Spanish energy stocks rise after Expansion reports that Spain’s government is considering a reduction of the 1.2% windfall tax on domestic revenue of large energy firms.
  • Lloyds shares rise as much as 2%, hitting their highest level since January 2020, after the UK bank posted pretax profit that beat expectations in the third quarter.
  • Heineken shares advance as much as 2% after the brewer reported third-quarter organic sales growth that analysts said was in line with company-compiled consensus.
  • Reckitt Benckiser shares rise as much as 2.1% after the personal care products maker reported a milder drop in like-for-like sales than feared.
  • European chipmakers gain as Texas Instruments says demand for automotive chips remains strong in China, and some end markets like personal electronics are seeing a continued cyclical recovery.
  • Handelsbanken shares rise as much as 6.6% after the Swedish lender reported strong results for the third quarter, according to analysts, including a beat in net interest income.
  • DWS shares gain as much as 2.4% after the German asset manager’s net inflows and profit beat estimates thanks to drivers such as reduced costs and higher management fees.
  • L’Oreal shares fall as much as 3.6% after the beauty firm’s third-quarter sales growth disappointed amid weakness in China and a significant miss in the dermatological segment.
  • Deutsche Bank shares decline 3% after the German lender reported earnings that analysts say are underwhelming with provisions seen as the “weak spot.”
  • Akzo Nobel shares fall as much as 5.7%, the most since April, after the paint producer lowered its profit forecast for the full year due to rising costs and weaker demand.
  • Telecom Italia shares fall as much as 3.2%. The Italian finance police executed a search warrant at the office of one of its managers earlier for alleged bribery between private individuals.
  • U-Blox shares slump as much as 10% to the lowest level since March 2022 after the Swiss semiconductor company reported third-quarter results at the lower end of guidance and slightly below market expectations, according to Vontobel.

Earlier in the session, Asian stocks hit their lowest level in a month as a weakness in tech heavyweight TSMC and the dollar’s strength offset a rally in Hong Kong shares. The MSCI Asia Pacific Index moved in a narrow range before retreating 0.4%, as TSMC dragged while Meituan and Toyota advanced. The cautious trade comes as some key US companies’ downbeat news led to flat trading in US stocks and the prospect of a slower pace of Federal Reserve rate cuts weighs on risk sentiment. “Asian markets are lacking direction at the moment,” said Matthew Haupt, a fund manager at Wilson Asset Management. Investors are “watching for any clues to the health of the US labor market and likely Fed policy settings later in the week,” he said.

In FX, the dollar also adds to its recent gains with the Bloomberg Dollar Spot Index climbing 0.2%. The yen is the clear underperformer among in the G-10 space, falling more than 1% against the greenback and taking USDJPY to 153 and above the 200 DMA in the process.

In rates, treasuries are cheaper again across the curve, underperforming bunds where German 2-year yields are richer by 7bp on the day. US yields are 1bp-2bp cheaper across maturities, with 10-year around 4.22%, the highest since July and trailing bunds in the sector by 2.5bp; Canadian yields are little changed ahead of the rate decision Euro-zone front-end shifts to lower yields as swaps price in around 45% chance of a 50bp rate cut at ECB’s final meeting this year on Dec. 12. Bank of Canada rate decision at 9:45am New York time is expected be a 50bp rate cut to 3.75%.  Gilts are also under pressure but there has been a bid in German shorter-dated bonds as traders add to their ECB rate cut bets. German 2-year yields are down 6 bps. Yields on Japan’s 40-year notes reached the highest in 16 years.

In commodities, oil prices decline, with WTI falling 1% to $71 a barrel as a US industry group signaled a rise in nationwide crude inventories, and the Biden administration renewed efforts to secure a cease-fire in the Middle East. Gold was steady after climbing to a fresh record. Gold hit another record high, rising above $2750 as traders seek safety amid jitters over the US election and ongoing conflict in the Middle East. Speaking of, Secretary of State Antony Blinken headed to Saudi Arabia to push for a broad truce after urging Israel to avoid creating “greater escalation.”

Looking at today’s calendar, we get September existing home sales at 10am and the Fed Beige book at 2pm. Fed speaker slate includes Bowman (9am) and Barkin (12pm)

Market Snapshot

  • S&P 500 futures little changed at 5,887.50
  • STOXX Europe 600 down 0.1% to 519.66
  • MXAP down 0.2% to 187.87
  • MXAPJ up 0.3% to 604.88
  • Nikkei down 0.8% to 38,104.86
  • Topix down 0.5% to 2,636.96
  • Hang Seng Index up 1.3% to 20,760.15
  • Shanghai Composite up 0.5% to 3,302.80
  • Sensex up 0.2% to 80,353.83
  • Australia S&P/ASX 200 up 0.1% to 8,216.01
  • Kospi up 1.1% to 2,599.62
  • German 10Y yield little changed at 2.32%
  • Euro down 0.1% to $1.0784
  • Brent Futures down 0.8% to $75.44/bbl
  • Brent Futures down 0.8% to $75.44/bbl
  • Gold spot up 0.3% to $2,757.17
  • US Dollar Index up 0.25% to 104.33

Top Overnight News

  • China’s stimulus efforts aren’t enough to bolster domestic demand according to Treasury Sec Yellen and the IMF. RTRS
  • Arm will end a license that allowed Qualcomm to use its IP to design chips, escalating a legal dispute. Qualcomm shares fell. BBG
  • Bill Gates privately said he has backed VP Harris with a USD 50mln donation: NYT.
  • European Central Bank policymakers have begun to debate whether interest rates need to be lowered enough to start stimulating the economy, ending years of economic restriction, conversations this week with half a dozen sources indicate. RTRS
  • Volvo Car shares dip in Eurozone trading after the company trimmed its sales guidance for the year given “accelerating weakness in the market” (it now sees sales up 7-8% vs. the prior 12-15%). RTRS
  • Blackstone CEO Steve Schwarzman said the US is likely to avoid a recession regardless of who wins the presidential election, as both candidates have policy proposals that appeal to growth. BBG
  • Paul Tudor Jones warns of a large slump in bond markets after the election due to massive fiscal risks. CNBC
  • Walmart will start offering home prescription deliveries in as little as 30 minutes as it and Amazon take aim at CVS and Walgreens. FT
  • Amazon is shutting down a service dubbed Amazon Today that offered same-day delivery from brick-and-mortar retailers. CNBC
  • McDonald’s plunged premarket after an E. coli outbreak tied to its Quarter Pounders killed one person and sickened dozens, mainly in Colorado and Nebraska. It said slivered onions may be the cause. Starbucks slid after it pulled next year’s guidance following another slump in same-store sales. BBG
  • Fed’s Daly (voter) commented on X that the economy is in a better place, inflation has fallen substantially and the labour market has returned to a more sustainable path, while she added that risks to goals are now balanced which is a significant improvement from two years ago. Furthermore, she stated that work to achieve a soft landing is not fully done and they are resolute to finish that job, but noted it cannot be all they are after and ultimately must strive for a world where people aren’t worried about inflation or the economy.
  • Former President Trump said he would make car interest payments fully tax deductible if they are domestically built.

A more detailed look at global markets courtesy of Newsquawk

APAC stocks were ultimately mixed with the upside capped following the inconclusive performance on Wall St amid a lack of fresh macro drivers, recent upside in yields and ongoing geopolitical tensions. ASX 200 traded rangebound with strength in consumer stocks offsetting the underperformance in tech and energy. Nikkei 225 was the laggard as it failed to benefit from a weaker currency and a surge in Tokyo Metro shares on its debut. Hang Seng and Shanghai Comp advanced with risk appetite supported as participants digested earnings releases and after the PBoC upped its liquidity effort, while a Chinese policy think tank called for the issuance of CNY 2tln in special treasury bonds to establish a stock market stabilisation fund.

Top Asian News

  • Chinese policy think tank CASS called for Beijing to issue CNY 2tln of special treasury bonds to set up a stock market stabilisation fund, according to 21st Century Business Herald.

European bourses, Stoxx 600 (-0.1%) began the session on a mixed footing, but sentiment continued to slip as the morning progressed, with almost the entirety of European indices in modest negative territory. European sectors are mixed; Optimised Personal Care tops the pile, assisted by post-earning strength in Reckitt Benckiser. Consumer Products is weighed on by poor earnings in L’Oreal. Key European earnings: Volvo Car (-3.2%) Q3 Revenue (SEK) 93bln (exp. 89.65bln), Adj. EBIT 5.7bln (exp. 4.78bln); sees FY Retail Sales +7-8% (prev. guided +12-15%). Roche (+0.1%) Q3 (CHF): Sales 15.14bln (exp. 14.93bln). FY Outlook confirmed. Deutsche Bank (-2.8%) Q3 (EUR) PBT 2.26bln (exp. 2.1bln), Revenue 7.5bln (exp. 7.3bln). FY Guidance: Confident in Revenue guide of “around” 30bln (exp. 29.44bln).

Top European News

  • ECB policymakers are beginning to debate whether rates will have to go below neutral level in the current easing cycle, according to sources cited by Reuters.
  • UK Chancellor Reeves is expected to impose national insurance on employer’s pension contribution in the Budget, according to The Times.

FX

  • USD is continuing to out-muscle peers as the US yield environment in the run-up to next month’s Presidential election continues to provide support. Accordingly, the DXY has gained a firmer footing on a 104 handle and ventured as high as 104.36.
  • EUR is softer vs. the USD with EUR/USD extending its move onto a 1.07 handle in the wake of dovish ECB source reporting which has raised the possibility of the Bank aiming for a terminal rate below neutral.
  • GBP is flat vs. the USD with Cable stuck below the 1.30 mark. BoE Governor Bailey & Breeden are due to speak today, though remarks from members on Tuesday failed to materially move the Pound.
  • JPY’s bruising run has continued into today’s session with US yields and domestic Japanese political risks continuing to drag USD/JPY higher. Currently sitting well above 152.00 at a 152.72 peak.
  • Antipodeans are both softer vs. the USD after Tuesday’s attempted recovery with antipodeans remaining at risk of a Republican clean sweep.
  • CAD is relatively steady vs. the USD and tucked within Tuesday’s 1.3813-38 range in the run-up to today’s BoC rate decision. Expectations are for a 50bps rate cut, and with markets pricing a 50bps cut at 97%.

Fixed Income

  • Bunds are lower by a handful of ticks, but ultimately reside within a contained range, holding around 20 ticks above Tuesday’s 132.58 WTD trough. Potential support could also be attributed to reports that officials are debating whether rates will need to go below the neutral level this cycle. German paper was unreactive to a well-received 10yr auction.
  • Gilts are softer than EGBs and were ultimately unmoved by a fairly well-received 2027 outing. Gilts are currently at a 96.40 WTD trough, matching the Oct. 15th low ahead of speak from BoE’s Bailey.
  • USTs are trading somewhere between Bunds and Gilts in terms of magnitudes, with USTs finding themselves under modest pressure ahead of 20yr supply though as it stands action is relatively even across the curve. At a 111-03+ trough which marks a marginal new WTD base.
  • UK sells GBP 4bln 3.75% 2027 Gilt Auction: b/c 3.29x (prev. 3.33x) & average yield 4.082% (prev. 4.068%), tail 0.6bps (prev. 0.3bps).
  • Germany sells EUR 3.303bln vs exp. EUR 4bln 2.60% 2034 Bund Auction: b/c 2.30x (prev. 2.0x), average yield 2.31% (prev. 2.08%) & retention 17.43% (prev. 17.69%).

Crude

  • Crude is trading on the backfoot, amid a lack of catalysts but as eyes remain on Israel regarding its retaliation against Iran, in which the focus will fall on the targets and the magnitude of the attack for its escalation factor. Brent’Dec trades towards the bottom of a narrow USD 75.47-76.05/bbl parameter.
  • Precious metals are mixed. Spot gold continues to print fresh all-time highs against the backdrop of a tense geopolitical landscape whilst silver trims some of Tuesday’s gains.
  • Base metals are mostly lower and giving back some of yesterday’s upside. 3M LME copper just about remains above USD 9,500/t.
  • Kazakhstan’s Kaztransoil shipped 145,000T oil to Germany; plans to supply 133,000T to Germany in October.
  • Private inventory data (bbls): Crude +1.6mln (exp. +0.3mln), Distillate -1.5mln (exp. -1.7mln), Gasoline -2mln (exp. -1.2mln), Cushing -0.2mln.

Geopolitics

  • Israel begins strikes on Lebanese port city of Tyre, via Reuters citing witnesses.
  • “Sources for Sky News Arabia: Russia will help Iran to counter the planned Israeli strike in some form”, according to Sky News Arabia; “Russia will help Iran without risking harm to its relations with Israel”. “Israeli sources to Sky News Arabia: We do not rule out the idea of Russia helping Iran in countering the Israeli strike”. “Israeli sources to Sky News Arabia: Russian assistance may be by giving Iran early warning and instructions to protect potential targets.”. “Israeli sources to Sky News Arabia: Russian assistance to Iran may include the detection of attacking aircraft and electronic jamming”
  • “US asked European countries to develop a vision to support the Palestinian Authority”, according to Sky News Arabia sources; “Arab countries hold new talks on ensuring the implementation of the new peace plan”. “Arab countries hold new talks on ensuring the implementation of the new peace plan”
  • Israel’s army completed its preparations to attack Iran and it seems that it will be within days, according to Israel’s Channel 12 citing two sources.
  • Israeli PM Netanyahu said in a meeting with US Secretary of State Blinken that there is a need to lead to a security and political change in the north, which would allow Israel to return its residents safely to their homes. Netanyahu added that the killing of Hamas leader Sinwar may have a positive effect on the return of Israeli hostages, the achievement of all the goals of the war, and the day after.
  • US Secretary of State Blinken, in meeting with Israeli PM Netanyahu, underscored the need to capitalise on Israel’s action to bring Sinwar to justice by securing a hostage release and ending the conflict in Gaza. Furthermore, Blinken sought during his meeting with Israeli PM Netanyahu to soften the response to Iran, according to Al Jazeera citing Israel’s Channel 13.
  • US Secretary of State Blinken and Israeli PM Netanyahu discussed the concrete steps to capitalise on the death of Hamas leader Sinwar, a senior US official told Reuters. Blinken made it clear that Israel’s humanitarian aid steps so far have not been sufficient and Israeli leaders committed to act upon US requests laid out in Blinken’s letter on the need for more humanitarian aid. Furthermore, Blinken will no longer go to Jordan on Wednesday but he will be traveling to Saudi Arabia.
  • White House said Israel must respond to the Iranian attack and it will not review what they will do, according to Al Jazeera.
  • Pentagon said it cannot provide information regarding the Israeli attack on Iran and it is consulting with partners in the region in order to de-escalate, according to Al Jazeera.
  • Israel’s army confirmed the killing of late Hezbollah leader Nasrallah’s presumed successor Hashem Safieddine.
  • Israel will continue to attack Hezbollah even after the end of the operation in Lebanon until it withdraws behind the Litani, according to Sky News Arabia citing comments by Galant to Blinken.
  • IDF spokesman said the Israeli Air Force intercepted a drone in Syrian airspace launched from the east. It was also reported that Israeli military said it intercepted two UAVs that crossed into Israel’s waters in the area of Eilat, while Islamic Resistance in Iraq announced it targeted Israel’s Eilat with drones.
  • Palestinian media reported continuous aerial and artillery shelling on different areas in the northern Gaza Strip, as well as heavy Israeli shelling on Rafah in the southern Gaza Strip, according to Asharq News.
  • Iranian President says they seek to prevent the expansion of conflict within the region, while Israel has shown “it is only looking for conflict”, via Al Arabiya.
  • Iraqi media reports that the US’ air defence system and radar in the Koniko gas field, Syria, were hit by a missile attack on Tuesday night, via IRNA.
  • US Secretary of State Blinken says they fully reject any Israeli reoccupation of Gaza.
  • North Korean leader Kim inspected strategic missile bases, according to KCNA.

US Event Calendar

  • 07:00: Oct. MBA Mortgage Applications, prior -17.0%
  • 10:00: Sept. Existing Home Sales MoM, est. 0.5%, prior -2.5%
  • 10:00: Sept. Home Resales with Condos, est. 3.88m, prior 3.86m
  • 14:00: Federal Reserve Releases Beige Book

Central Bank speakers

  • 09:00: Fed’s Bowman Gives Opening Remarks
  • 12:00: Fed’s Barkin Speaks About Community Colleges
  • 14:00: Federal Reserve Releases Beige Book

DB’s JIm Reid concludes the overnight wrap

Only two weeks until the big day. One that I’ve been looking forward to for what seems an exceptionally long time. Yes, the kids will go back to school after an extended 2-week half-term. As predicted last week my wife was already fed up with them last night after one day of holiday yesterday. The twins are so noisy! I’m off to Center Parcs with them all for a long weekend on Friday so I won’t be spared.

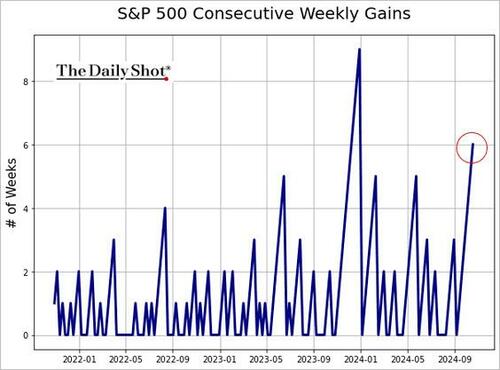
With two weeks to go today until the election, markets have started the week a bit more nervously than during the last 6 where the the S&P 500 has gone up each week for only the second time since the pandemic. Yesterday it started the week -0.18% but with bigger sell-offs elsewhere and extending into the Asian session this morning. The sell-off was much more pronounced among sovereign bonds though, with the 10yr Treasury yield (+11.3bps) reaching its highest level (4.20%) since late July, shortly before the weak payroll report, the Japanese mini-crash and the associated brief market turmoil. Moreover, the move was primarily driven by higher real yields, with the 10yr real yield (+10.2bps) moving up to 1.88%, which is its highest level since the end of July. Overnight, 10yr USTs are another +1.4bps higher as we go to print.

There were several factors behind the move but none that particularly dominated yesterday. In the background there has been a rising concern about debts and deficits, particularly ahead of the US election. Indeed, the IMF pointed out in their recent Fiscal Monitor that global public debt is forecast to exceed $100 trillion this year, and rise further in the medium term, so this is a growing issue as policymakers gather for the IMF/World Bank Annual Meetings in Washington this week. Moreover, our US economists have pointed out that irrespective of who wins the presidency or congress, they could see deficits in the 7-9% area over 2026-28, which is a level unprecedented outside of major wars or massive economic shocks like the GFC and Covid-19.
In addition to the long-end moves, expectations of Fed easing continue to drift lower, with Fed funds pricing for next March (+8.0bps to 4.05%) moving back above 4% for the first time since the start of August, after having fallen to below 3.4% in late September. This came as Fed speakers continued to express preference for gradual easing moving forward, with Kansas City President Schmid favouring “modest” reductions while Minneapolis Fed President Kashkari was “forecasting some more modest cuts”.

Another factor behind the bond selloff were growing inflation risks, and yesterday saw Brent crude oil prices (+1.68%) pick up again to $74.29/bbl. That comes amidst growing focus on Israel’s expected retaliation against Iran’s missile strikes earlier this month, which is still yet to materialise. But oil prices were reacting to several weekend developments, including the drone strike on the private home of Israeli PM Netanyahu that we mentioned yesterday. Indeed, foreign minister Israel Katz said over the weekend that there was “no doubt that another red line has been crossed here”. Meanwhile, although the classic safe haven of gold (-0.06%) closed marginally lower, after posting four consecutive session ATHs, this morning its +0.43% higher as I type and back at what would be record closing levels again.

Over in Europe, the bond selloff was even more aggressive, with yields on 10yr bunds (+9.9bps), OATs (+12.1bps) and BTPs (+15.3bps) all seeing large moves higher. In part, that’s because investors have pared back their expectations for a larger 50bp rate cut at the ECB’s December meeting, and we had a lot of commentary from several officials to digest as well. For instance, Lithuania’s Simkus said that he didn’t see the need for cuts bigger than 25bps, and Slovakia’s Kazimir said that the December meeting was “wide open”.

Back to the US election, the general consensus across polls, betting averages and forecasting models is that Trump has gained ground on Harris, but the race is still within the margin of error across the key battleground states. Now clearly that could change, but from a market perspective, the Trump bump has meant that beneficiaries of the “Trump trade” have continued to do well in recent sessions. Most notably, Trump Media & Technology Group (+5.81%) was up to its highest since July yesterday just after Biden pulled out of the Presidential race.

Returning to yesterday, equities struggled, particularly as bond yields kept on rising. The S&P 500 (-0.18%) posted a modest decline, but it was a broad-based one, with the equal weighted version of the index seeing its worst day in more than six weeks (-0.85%). Small-caps struggled in particular as the Russell 2000 (-1.60%) saw its worst day since early September. Information technology (+0.93%) was the only major sector within the S&P 500 to post a gain. The Mag-7 (+0.64%) advanced as Nvidia (+4.14%) hit a new record high, while the NASDAQ (+0.27%) moved to within half a percent of its all-time high from July. Over in Europe, markets closed around the intra-day lows of the US session, with the STOXX 600 (-0.66%) and the DAX (-1.00%) both losing significant ground.

Whilst there were several short-term catalysts for the selloff, it’s also worth bearing in mind that the market performance has been pretty incredible over recent months. Only last week, we saw US IG credit spreads reach their tightest level since 2005, and the S&P 500 is up for 37 of the last 51 weeks, which is a joint record back to 1989. This means that traditional valuation metrics are now looking increasingly stretched by historic standards, at a time when geopolitical risks are elevated and the soft landing is now increasingly priced in as the likely outcome, so it should in theory get harder from here. Henry took a look at some of these reasons for caution yesterday here.

Asian equity markets are mostly lower this morning. The S&P/ASX 200 (-1.68%) is the biggest underperformer in the region, followed by the Nikkei (-1.43%), the Topix (-1.14%), and the KOSPI (-1.17%). However, Chinese equities are defying the regional trend, with the Hang Seng (+0.41%) and the CSI 300 (+0.47%) posting gains. S&P 500 (-0.18%) and NASDAQ 100 (-0.26%) futures are edging lower. Aussie 10yr yields are +14.5bps with JGBs +2.6bps.

Early morning data showed that South Korea’s producer prices declined by -0.2% in September, matching the decline from the previous month.

There was very little data to speak of yesterday, although we did get the Conference Board’s leading index from the US. That showed a decline of -0.5% in September (vs. -0.3% expected). In level terms, that also left the index at its lowest level since May 2016. The monthly reading hasn’t been positive since February 2022 so the release has lost some of its shock value recently given how well growth as performed over the last few quarters. Separately in Germany, producer prices remained in deflationary territory in September, at -1.4% year-on-year (vs. -1.1% expected).

To the day ahead now, and central bank speakers include ECB President Lagarde, the ECB’s Centeno, Knot, Holzmann, Villeroy, Rehn and Panetta, the Fed’s Harker, BoE Governor Bailey, and the BoE’s Greene and Breeden. Otherwise, earnings releases include General Electric, General Motors and Verizon.

Tyler Durden
Wed, 10/23/2024 – 08:18

via ZeroHedge News https://ift.tt/o2d9uhP Tyler Durden

Arm Nukes Qualcomm Chip Design License In 60 Days Ahead Of Court Trial 

Arm Nukes Qualcomm Chip Design License In 60 Days Ahead Of Court Trial 

UK-based chip architecture giant Arm Holdings is nuking its architectural license agreement with US-based Qualcomm, which certainly escalates an ongoing legal dispute between the two companies. 

Bloomberg obtained a document that specifies Arm has given Qualcomm 60 days to end their so-called architectural license agreement. This agreement has allowed longtime partner Qualcomm to produce chips based on standards owned by the UK company. 

The license cancellation will mean Qualcomm will have to stop selling products based on Arm designs by the end of the year. Bloomberg noted that this could “roil the smartphone and personal computer markets, as well as disrupt the finances and operations of two of the most influential companies in the semiconductor industry.” 

A Qualcomm spokesperson told the media outlet that the British company was trying to “strong-arm a longtime partner.”

It “appears to be an attempt to disrupt the legal process, and its claim for termination is completely baseless,” the spokesperson said via email, adding, “We are confident that Qualcomm’s rights under its agreement with Arm will be affirmed.”

The legal feud began when Qualcomm bought Nuvia in 2021 to boost its Arm-based CPU designs. Arm was furious that it had no say in the deal and canceled Nuvia’s licenses in 2023. Both sides are headed to court in December. 

Bloomberg Intelligence analysts Tamlin Bason and Kunjan Sobhani commented on the legal dispute, noting, “Arm’s move to cancel Qualcomm’s architectural license looks like an effort to gain leverage in advance of the parties’ Dec. 16 trial.” 

BI analysts continued, “Our Thesis: Arm’s suit against Qualcomm likely ends in a negotiated license, granting the chipmaker rights to customize Arm architecture, but at higher royalty rate than Nuvia had been paying.”

In a separate note, JPMorgan analyst Samik Chatterjee told clients that the license cancellation is a significant escalation between the two firms. He said, “An eventual settlement is still the most likely outcome,” adding, The cancellation and 60-day notice appears to be a negotiating tactic to put further pressure on Qualcomm to find a solution sooner.”

“The timing of the cancellation notice suggests to us an attempt to force a pre-trial settlement,” Bernstein analyst Stacy Rasgon wrote in a note. Based on previous Qualcomm lawsuits, she said, “note that they do tend to typically settle prior to seeing the inside of a courtroom.”

Tyler Durden
Wed, 10/23/2024 – 07:45

via ZeroHedge News https://ift.tt/LIXKxm8 Tyler Durden

Seasonality: Buy Signal And Investing Outcomes

Seasonality: Buy Signal And Investing Outcomes

Authored by Lance Roberts via RealInvestmentAdvice.com,

Seasonality has long influenced stock market trends, offering insights into predictable cycles of strength and weakness throughout the year. Yale Hirsch, the creator of the Stock Trader’s Almanac, is one of the most well-known contributors to studying these patterns. His research has highlighted that certain periods of the year consistently present better opportunities for investors to generate returns, while other times warrant caution.

The adage ” Sell May and Go Away “ is a common topic of discussion that many investors are familiar with. The historical analysis supports that the market tends to be the weakest of the year during the summer months. Hirsch’s Stock Trader’s Almanac introduced the idea that the stock market follows a seasonal rhythm, where certain times of the year offer greater return potential. This work has helped investors identify key windows where market performance historically improves, allowing them to align their strategies accordingly.

  • “Sell in May and Go Away”: One of the most famous adages in market seasonality, this concept reflects the tendency for stocks to underperform during the summer months, roughly from May through October. Investors are often advised to exit or reduce exposure during this time to avoid potential downside risk.

  • The Best Six Months: Conversely, the period from November through April has been historically stronger for stocks, with higher average returns. This seasonal trend is based on data showing that a significant portion of stock market gains often occur during this half of the year.

The Math

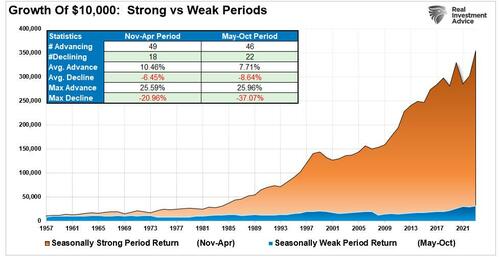
The chart below shows that $10,000 invested in the market from November to April has significantly outperformed the amount invested from May through October.

Interestingly, the max drawdowns are significantly larger during the “Sell In May” periods. Previous important dates of major market declines occurred in October 1929, 1987, and 2008.

However, not every summer works out poorly. Historically, there have been many periods when “Sell In May” did not work, and markets rose. 2020 and 2021 were examples of massive Federal Reserve interventions that pushed prices higher in April and subsequent summer months. However, 2022 was the opposite, as April declined sharply as the Fed began an aggressive interest rate hiking campaign the preceding month.

Technical analysis, however, can improve outcomes.

The Role of the MACD in Seasonal Investing

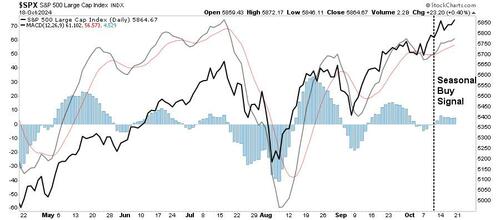
While the seasonal trends provide a useful framework, Hirsch’s research goes further by applying technical indicators like the MACD to refine entry and exit points. The seasonal MACD (Moving Average Convergence Divergence) signal, in particular, serves as a trigger that confirms when it’s the right time to re-enter the market after the weaker summer period.

The MACD is a momentum-based indicator that measures the relationship between two moving averages of a security’s price—typically the 12-day and 26-day exponential moving averages (EMAs). When the shorter-term EMA crosses above the longer-term EMA, it generates a buy signal, indicating the potential start of an uptrend. In seasonal investing, this technical indicator is combined with Hirsch’s seasonal trends to offer more precision in market timing.

  • Seasonal MACD Buy Signal: This signal typically triggers near the end of October or early November, aligning with the start of the “Best Six Months” period. It confirms that market momentum is shifting upward and is a favorable time to re-enter the market.

  • Seasonal MACD Sell Signal: Similarly, at the end of the “Best Six Months” (usually in late April or early May), the MACD sell signal indicates weakening momentum, suggesting it may be time to reduce equity exposure.

On Friday, October 11, 2024, the S&P 500 index triggered its seasonal MACD buy signal, marking the beginning of what has historically been a seasonally strong period for the stock market. This signal arrives just before November, reinforcing Hirsch’s findings that the months ahead tend to deliver better returns.

3-Market Supports For Seasonality

In 2024, three primary drivers will likely support markets from the middle of October through year-end and likely into early 2025.

Earnings

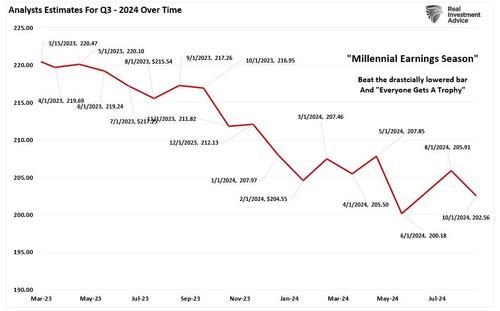
The first is earnings season, which has proved normal so far, although this week and next will be very important in corporate outlooks. As discussed in the latest BullBearReport, analysts significantly lowered the “earnings bar” heading into the reporting season. As noted in “Trojan Horses,” analysts are always wrong, and by a large degree.

“This is why we call it ‘Millennial Earnings Season.’ Wall Street continuously lowers estimates as the reporting period approaches so ‘everyone gets a trophy.’” 

The chart below shows the changes for the Q3 earnings period from when analysts provided their first estimates in March 2023. Analysts have slashed estimates over the last 30 days, dropping estimates by roughly $3.40/share, but nearly $18 lower than their initial estimate.

Of course, lowering the bar will generate a high “beat rate” by companies, which will help fuel stock prices in the short term.

Performance Chasing

Secondly, according to Morningstar, during the first half of 2024, only 18.2% of actively managed mutual and exchange-traded funds outperformed the cap-weighted S&P 500 index. There are several reasons for this, including the lack of allocation to the “Magnificent 7,” dispersion in returns of holdings, and lack of allocation to non-traditional assets.

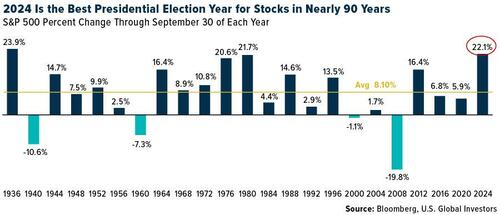
This underperformance occurs during the best presidential election year in roughly 90 years, which will pressure fund managers to play “catch up” with performance moving into year-end reporting. Given the “career risk” to managers of significant underperformance, additional buying pressure could manifest.

Corporate Share Buybacks

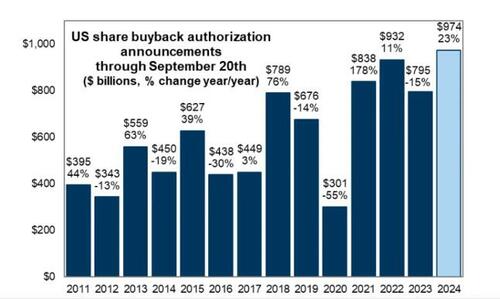
Lastly, corporate share buyback windows will reopen in November and December as companies exit their earnings “blackout period.” Notably, the last two months of the year represent the best two-month period for corporate executions as companies rush to complete buybacks for the current tax year. With nearly $1 Trillion in authorizations for 2024, the pace of buybacks will be exceptionally strong this year.

As noted by Goldman Sachs:

“The VWAP machines will be lining up to buy $6bn worth of equities daily during November and December.”

Yes, that is $6 billion each trading day, which provides sufficient buying power to lift asset prices into year-end.

Seasonality: Not A Risk-Free Adventure

For investors, this seasonality signal could be an opportunity to increase exposure to equities, particularly in large-cap stocks that tend to drive the broader market. However, it’s essential to recognize that while the MACD signal aligns with historical trends, it does not guarantee future performance.

Despite the historical reliability of seasonality and the MACD buy signal, investors must still be aware of risks.

  • Monetary Policy: Inflation, interest rates, and global economic uncertainty could weigh on stock performance, even during a seasonally strong period. Given the recent bout of strong data, if the Federal Reserve slows the pace of rate cuts, this could disappoint markets. A good example is 2018, where the Federal Reserve’s more hawkish stance preceded a 20% correction in November and December.

  • Geopolitical Risks: Ongoing geopolitical tensions, whether in Eastern Europe, the Middle East, or relations between major economic powers, can quickly disrupt financial markets. Unexpected events, such as escalating conflicts or trade wars, could derail the seasonal trends.

  • Market Volatility: Volatility can spike unexpectedly, leading to sharp market corrections. Even during strong periods like the “Best Six Months,” short-term market corrections are always possible. Investors should be prepared for heightened volatility, especially if other risk factors, like earnings surprises or economic data, create uncertainty.

  • Historical Trends Are Not Guarantees: Past performance, while instructive, does not guarantee future results. Although the MACD buy signal has been a reliable indicator in the past, external factors could reduce its predictive power. Investors must be cautious and not rely solely on seasonality and technical signals.

Most crucially, the technical backdrop also poses near-term risks. The market has been up six weeks in a row, which historically is a very long stretch without a correction.

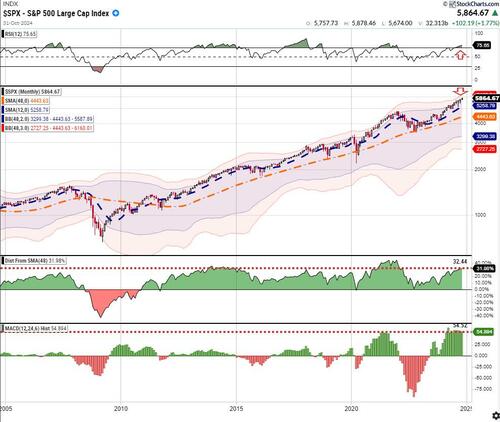
From a purely technical view, with the markets deviating well above MONTHLY moving averages and overbought, a correction or consolidation is becoming increasingly likely before the year-end advance can take shape.

Navigating Into Year-End

With the S&P 500 now in a seasonally strong period, bolstered by the weekly MACD buy signal, investors may want to consider several strategies:

  1. Increase Equity Exposure: Large-cap stocks historically perform well during this period. You could consider increasing exposure to diversified index funds or sector ETFs that align with historical trends.

  2. Review Portfolio Risk: While the MACD buy signal is a positive indicator, you should assess your portfolio’s risk tolerance and ensure it aligns with your long-term goals.

  3. Rebalance Allocations: Now may be a good time to rebalance by reducing positions in riskier assets or diversifying across asset classes.

  4. Use Stop-Loss Orders: To manage downside risk, consider using stop-loss orders.

Yale Hirsch’s research on market seasonality, paired with the power of the MACD signal, offers a disciplined approach to navigating historical market trends. The recent MACD buy signal for the S&P 500 provides investors with a potentially advantageous entry point into the market as we head into the historically strong “Best Six Months” period. However, it’s crucial to remain aware of the risks, including macroeconomic headwinds and market volatility.

Trade accordingly.

Tyler Durden
Wed, 10/23/2024 – 07:20

via ZeroHedge News https://ift.tt/eIiut5x Tyler Durden

Restaurant Bankruptcies Piling Up, TGI Fridays May Be Next

Restaurant Bankruptcies Piling Up, TGI Fridays May Be Next

Restaurant bankruptcy filings have been ticking higher this year as budget-conscious consumers cut back on eating out, and many eateries struggle with high debt loads in a toxic environment of high interest rates. TGI Fridays is the latest casual dining chain preparing a bankruptcy filing.

People knowledgeable of TGI Friday’s bankruptcy plans told Bloomberg that the US casual dining restaurant chain, with 600 locations in 55 countries, including 233 in the US, will file for bankruptcy protection in the coming weeks. 

TGI Fridays executives have been in multiple discussions with lenders searching for a loan to ensure operations run smoothly through the Chapter 11 process, the people said, who asked not to be named in the report. 

The people said Ropes & Gray LLP lawyers are advising TGI Fridays on bankruptcy preparations but noted plans have not yet been finalized. 

Bloomberg pointed out:

The chain’s obligations include asset-backed securities, which were the source of some drama last month after the company’s management breached their terms by failing to file documents to bondholders on time. As a result of that breach, they had to turn over control of some assets to an outside manager.

Credit rating agency KBRA recently reported that the chain lost control of much of its business functions through a manager termination event because of TGI Fridays’ “failure to furnish a report of the independent auditors or back-up manager summarizing the findings of certain agreed-upon procedures within a certain time period.”

Add TGI Fridays to the list of restaurant bankruptcies piling up this year as the space becomes extremely challenging in a period of thrifty consumers

  • Red Lobster Management

  • Rubio’s Restaurants

  • Melt Bar & Grilled

  • Kuma Holdings

  • Tijuana Flats

  • Sticky’s Finger Joint

  • Boxer Ramen

CRE news website Bisnow added more color on the restaurant downturn: 

Going back decades, this year is set to come second to only 2020 for the number of restaurant chains and operators declaring bankruptcy, according to BankruptcyData.com records reported by the WSJ. Traditional chain restaurants like Red Lobster and Buca di Beppo have had to resort to a court-facilitated restructuring, but so have fast-casual chains Roti, Tijuana Flats and fast-casual taco chain Rubio’s.

Same-store sales traffic at US restaurants was down 3.3% year-over-year this month, according to Black Box Intelligence, and casual dining restaurants saw visits fall 4.5%.

Other headlines in the space:

Yet corporate media and the White House say the US economy is humming along and nothing to worry about with consumers. 

Tyler Durden
Wed, 10/23/2024 – 06:55

via ZeroHedge News https://ift.tt/lGxISzF Tyler Durden

The Point Of No Return(s)

The Point Of No Return(s)

Authored by James Rickards via DailyReckoning.com,

Should the U.S. national debt be considered an actual crisis? Does it have the destructive power of a hurricane, tornado, earthquake or other crisis?

The short answer is yes but the full explanation requires a financial history lesson.

The first point to understand is that debt can be good or bad. Deciding which depends on two criteria: What is the cost of the debt relative to the returns that can be gained from investing it wisely? And what is the size of the debt relative to the income available to repay it or roll it over?

These points can be illustrated with simple examples.

If a government borrows for 10 years at an interest rate of 4.0% (the current rate on 10-year Treasury notes) and builds infrastructure that will produce economic gains of 10.0% or more for an indefinite period of time (with maintenance), that’s clearly a good use of borrowed money.

That example applies to major projects such as the interstate highway system launched under Eisenhower and the moon landing project launched under Kennedy.

But money borrowed to finance boondoggles such as the Green New Scam or to give handouts to illegal immigrants who don’t speak English, don’t have skills and in many cases are murderers or terrorists is plainly wasteful. Those uses for debt are non-productive and do nothing to enable the country to pay it back.

The U.S. national debt today is about $35.7 trillion. (Note: That figure is Treasury debt only. It ignores contingent liabilities for unpaid student loans, Social Security, Medicare, mortgage guarantees, unfunded FDIC insurance liabilities and much more). Is that a big number? It depends.

Suppose you owe $50,000 on a revolving credit line of Mastercard. Is that a problem? If you make $30,000 per year and don’t expect a big raise or a business success, then it’s a huge problem.

On the other hand, if you make $500,000 per year, the debt is entirely manageable and you can probably pay it off just by writing a check. In other words, debt’s a problem (or not) depending on the income available to pay it off.

The same is true for countries. The national debt is a problem (or not) depending on the income available to pay it off.

A good proxy for national income is the gross domestic product (GDP). By expressing the national debt as a percentage of GDP (Debt/GDP = r, where r is the ratio), you get a good idea of whether the debt is excessive.

Economists agree that a 30% debt-to-GDP ratio is entirely comfortable. It’s like owing $150,000 when you make $500,000.

As the debt-to-GDP ratio climbs, two adverse conditions result. The first is that the return on investment (sometimes called the Keynesian multiplier) declines.

Borrowing and spending a dollar at a 30% ratio might produce a 140% return. Borrowing and spending the same dollar at a 60% ratio produces only a 110% return. This is why the Maastricht Treaty that governs EU fiscal policy places a cap of 60% on the debt-to-GDP ratio of member states. (This cap is widely ignored.)

Below, I show you how the U.S. has reached the point of no return(s). There’s only one way out, but it’s just as bad as the problem. I also show you how to protect your wealth in the times ahead.

Read on…

The Point of No Return(s)

Research makes it clear that a debt-to-GDP ratio of 90% is a threshold. That is the point at which the return of each dollar borrowed and spent is less than $1.00. This means that not only do you not get your dollar back, you add more to the numerator (debt) than you do to the denominator (GDP), which makes the ratio even worse and lowers the return on the next dollar borrowed and spent.

That’s a mathematical way of saying you can’t borrow your way out of a debt trap. Where does that leave the United States today? As noted, the national debt is $35.7 trillion. GDP is estimated at $28.7 trillion. That produces a debt-to-GDP ratio of 124%, the highest in U.S. history.

Obviously, that ratio is well above the 90% red line and is getting worse by the minute as U.S. deficit spending skyrockets while growth stalls. The U.S. debt-to-GDP ratio will soon be pushing toward 130% and higher. That’s a level reached by failed states like Lebanon and super-debtors like Greece.

Has it always been this way? Not at all. It would be nice to believe the U.S. began under George Washington in 1789 as a debt-free nation, but that was not true. The U.S. agreed to assume the Revolutionary War debt of the individual states and the Continental Congress instead of allowing that debt to go into default, so the country began in debt.

It was Alexander Hamilton’s great insight that the U.S. could borrow more money through the U.S. Treasury to pay off the war debt. That would establish the U.S. as a good credit and enable the country to keep borrowing, both for new investment and to retire maturing debt by rolling over old debt for new debt.

That was the origin of the U.S. Treasury securities market, and it has been going strong for 235 years. The First Bank of the United States (1791–1811) and the Second Bank of the United States (1816–1836) were each established to facilitate the process of buying Treasury debt for bank notes, a type of bank money that allowed the government to pay bills and conduct business.

Most assume the U.S. national debt has been going up continuously since George Washington. That’s not true. In fact, President Andrew Jackson took the national debt to zero in 1835. The national debt (adjusted for inflation and expressed as a percentage of GDP) has moved in more of a sine wave than a straight line. That wave corresponds to the fact that debt goes up in times of war and is then reduced in times of peace.

This pattern of increasing debt to fight wars then decreasing debt during times of peace was remarkably consistent for most of American history (from The War of 1812 through Vietnam).

The debt increases were widely supported as necessary to win wars. The debt consolidation stages were widely viewed as times of wealth creation and prosperity (with brief exceptions for bank panics).

The sine wave pattern was perhaps best illustrated during the 45-year period from 1945–1990. In 1945, at the end of World War II, the U.S. debt-to-GDP ratio was 120%, the highest ever before today. Between 1945–1980, the ratio dropped from 120% to 30%, an entirely comfortable level.

This was done on a bipartisan basis. Democrats (Truman, Kennedy, Johnson, Carter) joined Republicans (Eisenhower, Nixon, Ford) in a multidecade effort to get the ratio under control. Importantly, this was not done by reducing the debtIt was done by growing the economy. If you expand the GDP denominator faster than the debt numerator, the ratio drops even if the debt grows.

Between 1980 and 1988, the ratio grew again under Ronald Reagan. President Reagan had a reputation as a fiscal conservative, but he was actually a big spender. To his credit, the money was spent on a 600-ship Navy, technology and the missile-interceptor program mocked as “Star Wars” but actually realized today in Patriot anti-missile batteries and other defense technologies.

Most importantly, Reagan won the Cold War. The Cold War was fought continuously from 1946–1991. George H.W. Bush was president when the Soviet Union dissolved.

Still, Reagan was the decisive actor because his defense buildup convinced Soviet General Secretary Gorbachev that Russia couldn’t keep up with the U.S. and needed to reform through glasnost (“opening”) and perestroika (“restructuring’). Those and other reforms led quickly to the collapse of the Soviet state and the emergence of the Russian Federation.

Still, the cost was high. The U.S. debt-to-GDP ratio rose from 30% when Reagan took office to 53% when he left office. From there, the historic pattern would have called for gradual reduction in the ratio. That didn’t happen.

The best that can be said is that George H.W. Bush and Bill Clinton kept it under control from 1990–2000. It rose slightly to about 56% but did not surge. From there, the ratio ran off the rails.

It went up to about 82% under George W. Bush (still below the 90% critical threshold), then exploded under Barack Obama. The debt-to-GDP ratio reached 100% by the end of Obama’s two terms in 2017. This trend continued under Trump and Biden to bring us to the 124% level today.

There were wars during the period 2000–2024 (War on Terror, Iraq War, War in Afghanistan and U.S. support for the wars in Ukraine and Israel) but the U.S. did not win any of those wars. At best, they were fought to a standstill (War on Terror) and at worst they ended in humiliating defeat (Afghanistan). There was also wasteful spending that had nothing to do with wars including pandemic relief, illegal immigration and the Green New Scam.

The U.S. had lost its ability to win wars and lost the will to reduce spending in times of peace. The debt-to-GDP ratio was now a steeply pitched slope instead of a gently curved sine wave.

There’s no need for default because we can always print the money. There’s no way to grow out of it because the high debt ratio inhibits real growth. The only solution is high inflation where the nominal debt may go up, but the real value of the debt shrinks dramatically. Unfortunately, the value of your stock portfolio will shrink dramatically as well.

The remedy for this crisis and threat to your wealth and well-being is a portfolio of inflation-proof assets including land, gold, silver, fine art, natural resources and some cash (invested at yields higher than inflation) for liquidity and bargain hunting when the time comes.

Don’t expect your stocks to save you. They won’t.

Tyler Durden
Wed, 10/23/2024 – 06:30

via ZeroHedge News https://ift.tt/oiJUmCE Tyler Durden

China Holds New Live Fire Drills Near Taiwan, 2 Days After US Warship Passed Through Strait

China Holds New Live Fire Drills Near Taiwan, 2 Days After US Warship Passed Through Strait

One week after China’s military launched massive encircling drills around Taiwan, widely dubbed in international press reports as ‘record-setting’, another round of smaller drills has kicked off Tuesday.

These new drills by the People’s Liberation Army (PLA) are ‘live fire’ exercises and are taking place in the disputed Taiwan Strait. Reports day they have been scheduled to last for four hours and are around China’s Niushan Island.

Illustrative: Chinese PLA helicopter over Pingtan island. AFP/Getty Images

Importantly, Niushan Island is the closest point between China’s coast and Taiwan, lying about 66 miles from the self-ruled island. The timing is also just two days after the US and Canada each sent a warship through the Taiwan Strait on Sunday.

The US Navy’s Seventh Fleet previously said the guided-missile destroyer USS Higgins sailed alongside the Canadian frigate HMCS Vancouver as part of the joint freedom of navigation exercises. Chinese warships monitored the pair, with the PLA saying the Western vessels “disturbed the situation and undermined peace and stability.”

Taiwan’s premier, Cho Jung-tai, downplayed the new PLA exercises as but a pointless threat. “No matter the scale of the exercises, there should not be such meaningless shows frequently or near to Taiwan,” he said. “This will only cause sudden and unnecessary tension.”

Last Monday China’s one-day military exercise were said aimed at “sealing off of key ports and key areas” of Taiwan. Though relatively short in length the exercise was massive in terms of total Chinese assets deployed, with reports tallying 153 aircraft, 14 navy vessels and 12 other government ships sent simultaneously. 

Chinese President Xi Jinping also said days ago that the the military should “comprehensively strengthen training and preparation for war, (and) ensure troops have solid combat capabilities,” according to CCTV.

Soldiers must “enhance their strategic deterrent and combat capability,” Xi added. Recent state video clips have shown him visiting troop training facilities while clad in military fatigues. Xi issues such a call for ‘greater preparedness’ for war about once a year, generating similar global headlines each time.

A visit by President Xi days ago to a land-based rocket unit…

In September, President Biden approved a $567 million arms package for Taiwan as part of the latest. The US has poured billions into Taiwan over the decades.

Both presidential candidates have vowed to continue strong US support to Taiwan, thus Washington policy in the Pacific region is not expected to change significantly no matter who takes office.

Tyler Durden
Wed, 10/23/2024 – 05:45

via ZeroHedge News https://ift.tt/bEDmJdL Tyler Durden

From High Inflation To Hyperinflation: How Close Are We?

From High Inflation To Hyperinflation: How Close Are We?

Authored by Nick Giambruno via InternationalMan.com,

The Federal Reserve is now entering a monetary easing and rate cutting cycle in an environment of elevated inflation.

The last time this happened was during the 1970s, a decade that saw inflation spiral out of control.

The 1970s: An Optimistic Scenario

In the early 1970s, under Chairman Arthur Burns, the Fed faced rising inflation and concerns about economic growth and unemployment.

Despite elevated inflation, the Fed cut interest rates multiple times until 1972 to stimulate economic growth.

Inflation soared to over 12% in the months that followed.

In response to the rising inflation, the Fed raised rates aggressively in 1974, pushing the federal funds rate from around 5.75% to 13%.

However, as the economy entered a deeper recession, the Fed began cutting rates again in 1975 despite inflation remaining elevated at around 9%.

By the end of the decade, inflation had reached double digits again at over 11% in 1979 and peaked at 13.5% in 1980.

The raging inflation of the 1970s and early 1980s is a stark illustration of the danger of cutting interest rates in an environment of elevated inflation… such as the one we are in today.

However, as bad as the 1970s inflation was, I believe it’s an optimistic scenario.

That’s because the out-of-control inflation then was only tamed when Paul Volcker hiked rates above 17%… an option that is not available to the Fed today because of the skyrocketing federal interest expense.

In fact, the Fed could only raise rates to about 5.25%—less than a third of what Volcker had to do—before capitulating recently.

In other words, the higher the debt load, the less room the Fed has to raise rates because of the interest expense.

As the debt pile and accompanying interest expense grow exponentially, I am skeptical of their ability to hike rates to even 5.25% again; forget about higher than that.

Imagine what could have happened in the 1970s and early 1980s if Volcker could have raised rates to only 5.25% instead of over 17%.

This is the environment the US now finds itself in.

Rate Cuts Amid Elevated Inflation: Other Examples

If the 1970s in the US is the optimistic scenario, Brazil and Argentina in the 1980s offer other possibilities.

Both countries were cutting interest rates amid elevated inflation at the time, resulting in eventual hyperinflation.

The same thing happened in Zimbabwe in the 2000s when the central bank cut interest rates amid elevated inflation, culminating in hyperinflation.

In the 2010s, the Venezuelan government kept interest rates artificially low despite skyrocketing inflation. The result was hyperinflation.

These examples highlight the dangers of cutting interest rates or maintaining low rates in an environment of elevated inflation.

In each case, the central banks’ actions, often influenced by political pressures, exacerbated inflation and led to severe economic crises.

While those examples are insightful, the US is not in the same class as Argentina, Brazil, or Zimbabwe.

It’s the most powerful country in the history of the world, leader of the current world order, and issuer of the world’s premier reserve currency.

So, it will take a lot more to push the US into hyperinflation.

I’m not saying that hyperinflation in the US is inevitable or imminent, though it remains a growing possibility. That is especially true as World War 3 plays out and a multipolar world order potentially emerges that could change everything.

In the meantime, I believe ever-increasing currency debasement potentially worse than what the US experienced in the 1970s—though not necessarily imminent hyperinflation—is an unstoppable trend you can bet on.

That’s why I think the gold price is set to skyrocket.

The last time the US experienced runaway inflation was in the 1970s.

Then, gold exploded from $35 per ounce to $850 in 1980—a gain of over 2,300% or more than 24x.

I expect the percentage rise in the price of gold to be at least as significant as it was during the 1970s.

While this megatrend is already well underway, I believe the most significant gains are still ahead.

Holding physical gold bullion in a private non-bank vault in a wealth-friendly jurisdiction like Singapore, Switzerland, or the Cayman Islands is a good idea.

That’s why I just released an urgent new PDF report with all the details.

Click here to download it now.

Tyler Durden
Wed, 10/23/2024 – 05:00

via ZeroHedge News https://ift.tt/DmPULSg Tyler Durden

The Global Clout Of The New BRICS

The Global Clout Of The New BRICS

Leaders of China, Russia, India and other BRICS nations gathered in Kazan, Russia on Tuesday for the bloc’s first annual summit since its major expansion last year. In August 2023, the group decided to invite six nations to join. Four of these nations – Egypt, Ethiopia, Iran and the United Arab Emirates – formally joined the bloc on January 1, 2024. Argentina rejected the offer and Saudi Arabia is still considering it.

As Statista’s Felix Richter reports, the expansion of BRICS beyond founding members Brazil, Russia, India and China as well as South Africa, which joined in 2010, aims to strengthen its influence as a global economic and political force, providing a counterweight to the G7 and other Western-led institutions.

The group seeks to promote a more multipolar world, reducing the dominance of the United States and its allies.

Speaking on the expansion of the BRICS, South African president Cyril Ramaphosa said at a press briefing last year: “We shared our vision of BRICS as a champion of the needs and concerns of the peoples of the Global South. These include the need for beneficial economic growth, sustainable development and reform of multilateral systems.”

As Richter shows in the chart below, the new, expanded BRICS represent roughly 45 percent of the world’s population and 35 percent of global GDP when measured at purchasing power parity.

Infographic: The Global Clout of the New BRICS | Statista

You will find more infographics at Statista

With the addition of Iran and the United Arab Emirates, the bloc has grown its combined oil production by nearly 50 percent and now accounts for almost 30 percent of global oil output, according to the Energy Institute.

In terms of exports, the group’s footprint is relatively small.

Last year, its nine members accounted for just 22 percent of global merchandise exports, with China alone accounting for nearly two thirds of the bloc’s exports.

Speaking of China: despite all claims of BRICS being “an equal partnership of countries that have differing views but have a shared vision for a better world,” as South Africa’s president Cyril Ramaphosa put it last year, it’s hard to ignore China’s outsized role within the group, both in terms of economic and political power.

Measured at purchasing power parity, China’s GDP is larger than the combined GDP of the remaining eight BRICS members, making it hard to imagine the country not wielding that power in negotiations within the bloc.

Tyler Durden
Wed, 10/23/2024 – 04:15

via ZeroHedge News https://ift.tt/mP3hslv Tyler Durden