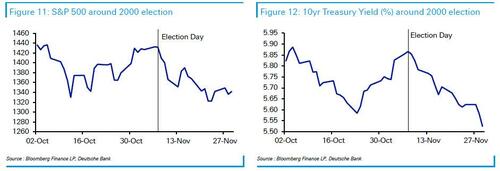
With just hours left until the close of polls (and today’s cash market), we share some observations from DB looking at how markets have reacted to the six previous elections and what was going on at the time. As DB’s Henry Allen notes, the reactions vary considerably: of the six elections since 2000, the S&P 500 was up in three cases by the end of November, and down in the other three. 10yr Treasury yields were down in four and up in two.
It’s worth bearing in mind that markets already account for expectations. So in 2008, there was little direct reaction, as Obama’s victory was widely expected. By contrast in 2016, Trump’s surprise victory was a big shock that led to a major rise in Treasury yields.
In addition, other events are happening at the same time. Markets were buoyant after 2020, but that was supported by Pfizer’s vaccine announcement the following week. In 2012, markets struggled as fears grew about the US fiscal cliff and Greece’s situation during the sovereign crisis. And back in 2008, markets plummeted amidst the Global Financial Crisis. So the election isn’t the only variable, and this week there’ll be a lot of focus on Thursday’s Fed decision as well,
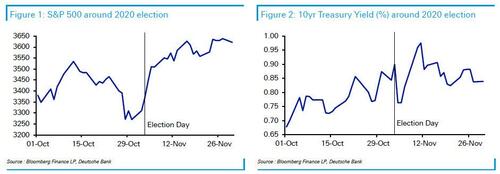
2020 (Biden vs Trump)
Markets rally after election, initially on prospect of divided government with the Georgia Senate races pending, whilst vaccine news provides a further boost.
In 2020, the outcome was initially uncertain on the night, as President Trump outperformed the polls and his margins with Biden were tighter than expected. But it soon became apparent that Biden would win, even before his victory was formally declared by the networks on the Saturday.
At first markets rallied, as it looked as though there’d be a divided government scenario where Biden won the Presidency whilst Republicans kept the Senate. The Senate control would depend on two run-off elections in Georgia in early January, and even though the Democrats went on to win those and control the Senate, that wasn’t the expectation straight after November’s election. Indeed, the narrative behind the market rally at the time was that divided government might be positive, as a Republican Senate would prevent tax rises and higher regulation. And even though a Republican Senate would likely mean less fiscal stimulus, it meant markets priced in more action from the Fed, which gave the liquidity trade a boost.
On the Monday after the election, markets then got a further boost from the Pfizer vaccine announcement, which was then followed up by other vaccine candidates. The efficacy numbers were at the upper end of expectations, and it alleviated fears that society might have to live with the Covid-19 pandemic on a more permanent basis, offering a path back to normality. So risk assets did well after the election, but there were pandemic-related events happening too, which was the most important variable for the global economy that year.
2016 (Trump vs Clinton)
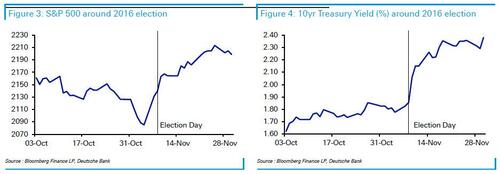
Surprise Trump victory leads to rapid rise in Treasury yields.
Of the 21st century elections, 2016 was the most surprising by far from a market and political perspective, as the polls had widely pointed to a Hillary Clinton victory, as had prediction and betting markets. Moreover, the outcome was a Republican sweep in Congress too, not just a Trump presidency.
With the Republicans back in control, that opened the door to fiscal stimulus, which later happened with the Tax Cuts and Jobs Act (TCJA) that was signed in 2017. This included both income and corporate tax cuts, and Treasury yields rose substantially after the result, as they hadn’t priced in such an outcome beforehand.
This saw the 10yr Treasury yield rise by +20bps on the Wednesday, then another +9bps on Thursday, Friday was a holiday, and on Monday it was up +11bps. It continued to rise into year-end as well, moving from 1.85% on election night to 2.44% by year-end.
2012 (Obama vs Romney)
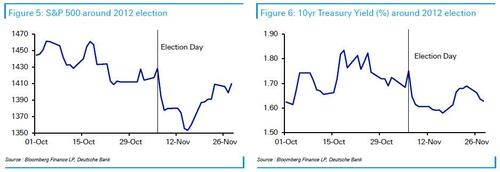
Concerns about fiscal cliff and Euro sovereign crisis lead to risk-off move.
The 2012 election result was broadly in line with expectations, as a second term for Obama had been generally expected, and the result became clear that evening.
However, markets then saw a risk-off move afterwards, with the S&P 500 down -2.4% the day after, and then another -1.2% the day after that.
In part, that was driven by concerns about the so-called “fiscal cliff”. These were automatic tax increases and spending cuts scheduled to occur, which risked causing a major growth slowdown. Moreover, the Republicans kept control of the House in this election, meaning that divided government was set to continue, and Obama would still need to compromise with Republicans to pass legislation. So there was concern about whether a compromise could be reached in time.
Alongside the fiscal cliff, the Greek situation was also in focus. That week, markets were looking for when the EU would decide to release the latest bailout funds. Given the uncertainty, sovereign bond spreads widened across the continent in response, and the gap of Italian 10yr yields over bunds widened +7bps the day after the election, and another +13bps the day after that. So the moves in Europe were also dampening global sentiment after the election too.
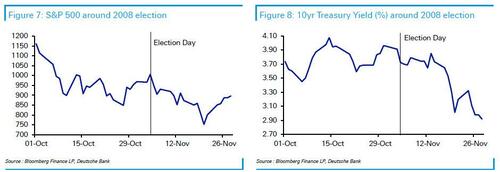
2008 (Obama vs McCain)
Sharp market selloff driven by Global Financial Crisis and very weak data, not the election.
In political terms, this was the least surprising result of the 21st century presidential elections. Obama had consistently led in the opinion polls, and the result wasn’t close either, with a 365-173 margin in the electoral college, along with a popular vote lead for Obama of 7 points. From a market perspective, there wasn’t much of a direct election reaction, as an Obama victory was widely priced in.
However, markets did sell off substantially, as the election happened against the backdrop of the Global Financial Crisis, with the economy still getting worse at this point. Indeed, the S&P 500 was down -5.3% on the Wednesday straight after the election, as the ADP’s report showed jobs contracted by -157k in October (vs. -102k expected), whilst the ISM services index came in at 44.4 (vs. 47.0 expected). Then on the Thursday, the index fell another -5.0%.
At this point, the broader context was utterly dire. Less than two months before the election, Lehman Brothers had collapsed, and on October 15 the S&P 500 saw its biggest one-day decline (-9.03%) since Black Monday 1987. Less than a week before election day on October 29, the Fed then delivered another 50bp rate cut, taking rates down to 1%.
2004 (Bush vs Kerry)
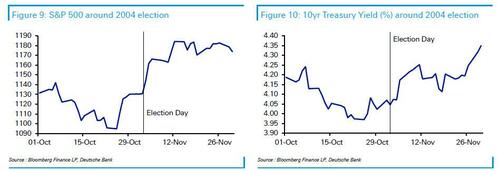
Markets rally amidst policy continuity with a second term for George W. Bush.
In political terms, the 2004 election was fairly close, with incumbent President George W. Bush winning just 286 electoral college votes, making it the last time neither candidate received more than 300 electoral college votes. But the outcome was broadly as expected, because the polls had put Bush ahead over the couple of months beforehand, and he was also polling ahead in the key battleground states such as Ohio. The result meant that Bush won a second term as President, and the Republicans kept control of both the House and the Senate too.
Markets rallied strongly after the election result, with the S&P 500 up +1.1% on Wednesday, and then +1.6% on Thursday. The narrative was that this meant there would be policy continuity, and taxes were less likely to go up under a Bush presidency. That was helped by strong data after the election, as the Wednesday saw the ISM non-manufacturing report come in at 59.8 (vs. 58.0 expected). Then on the Thursday, the initial jobless claims were at 332k (vs. 340k expected).
2000 (Bush vs Gore)
Markets see a clear risk-off move as election uncertainty drags on for a full month.
This was an incredibly close result, and the most contentious of recent times. The outcome hinged on the state of Florida, which was required by both candidates to win an Electoral College majority. On election night, the Florida result swung back and forth between Gore and Bush. With the election hinging on a margin of less than 0.5%, a mandatory machine recount in the state was triggered anyway. Gore’s team also requested a manual recount of ballots in four Florida counties, all of which were in Democratic areas.
Extended legal wrangling took place over the ensuing month, as the Bush team sought to stop the ongoing recounts. Although the Florida votes were then certified on November 26 with Bush having a 537-vote lead, Gore then sued as some recounts hadn’t been completed. Eventually, the case went to the Florida Supreme Court, which sided with Gore in ordering manual recounts of undervotes, which is where a vote had been cast but a machine had not recorded a vote.
The US Supreme Court suspended this manual recount on December 9 while it heard arguments, eventually ruling that the manual recount violated the 14th amendment ensuring the equal protection of law, and that it would not be possible for a recount to meet the “safe harbor” deadline of December 12 under federal law, which is a deadline where states have to decide their electors to the Electoral College six days before they meet.
With the Supreme Court’s decision, Gore formally conceded the race to Bush on December 13, five weeks after Election Day.
Amidst the uncertainty over the election outcome, the S&P 500 fell 1.6% the following day (November 8th), before seeing a further 0.7% and 2.4% decline on the Thursday and Friday respectively. In fact, November 2000 was the S&P 500’s worst monthly performance of that year, with an 8% decline from start to finish. With US equities losing ground, investors moved into US Treasuries, as 10yr yields fell from 5.86% at the close on Election Day to 5.26% on December 13 when Gore conceded.
