The US Consumer Is Melting Down: Here’s Why
While investors and economists are squarely focused on whether the US stock market has bottomed or if this is just a short-squeezing bear market rally, and whether the US economy is still growing or – as the Atlanta Fed GDPNow tracker strongly hints – is rapidly shrinking, a far more troubling problem has emerged for the US economy and the Trump administration: the US consumer, and especially the lower income cohort, is now fully tapped out.
Which should not be news to anyone, and certainly not regular zerohedge readers. After all, for the past few years we have been chronicling how US savings are increasingly shrinking and being replaced with credit card borrowings and other forms of debt, including the insidious Buy Now Pay Later (also known as Burrito Now Pay Later, or BNPL), which we learned is being used for food purchases because millions of Americans can’t even afford to pay for their next meal, but they will still use doordash for highly overpriced deliveries!)
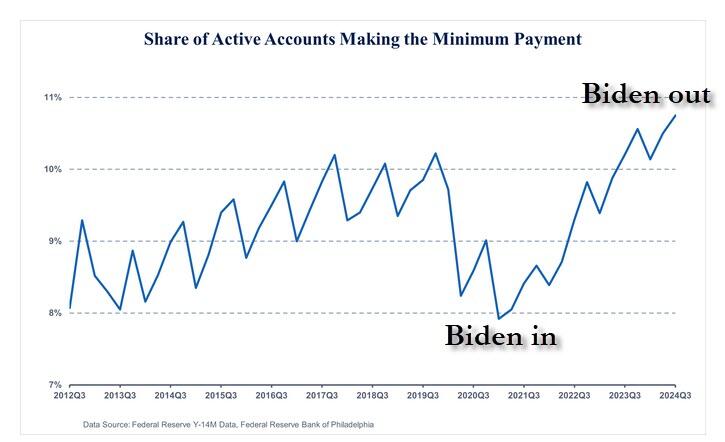
And it certainly is not a Trump phenomenon, quite the contrary. Consider the following data from the Philadelphia Fed, which recently showed that the share of active credit card accounts making only the minimum payment hit a series high, 10.75% in third quarter 2024.
In addition, more consumers are falling behind on their monthly card payments. The balance-based 30+ days past due rate increased 33 basis points year-over-year to 3.52% in third quarter 2024. This represents more than double the delinquency rate of 1.57 percent at the pandemic low in second quarter 2021.
![]()
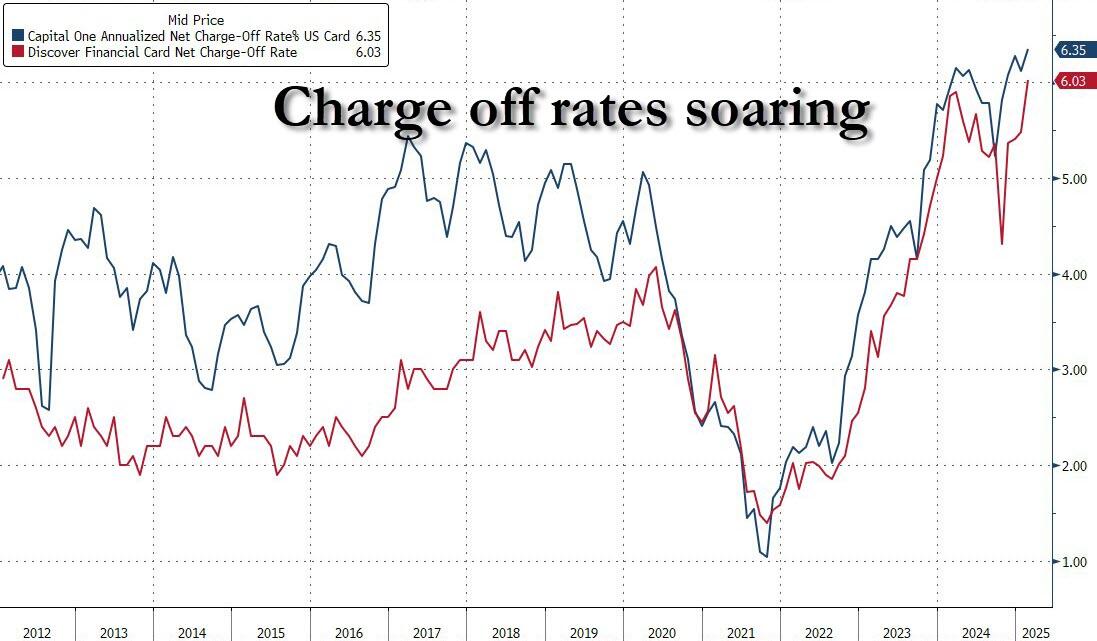
It’s even uglier when looking at the charge-off rates by such “less than prime” card issuers like Capital One and Discovery, both of which just hit their highest charge-off rates since the global financial crisis.
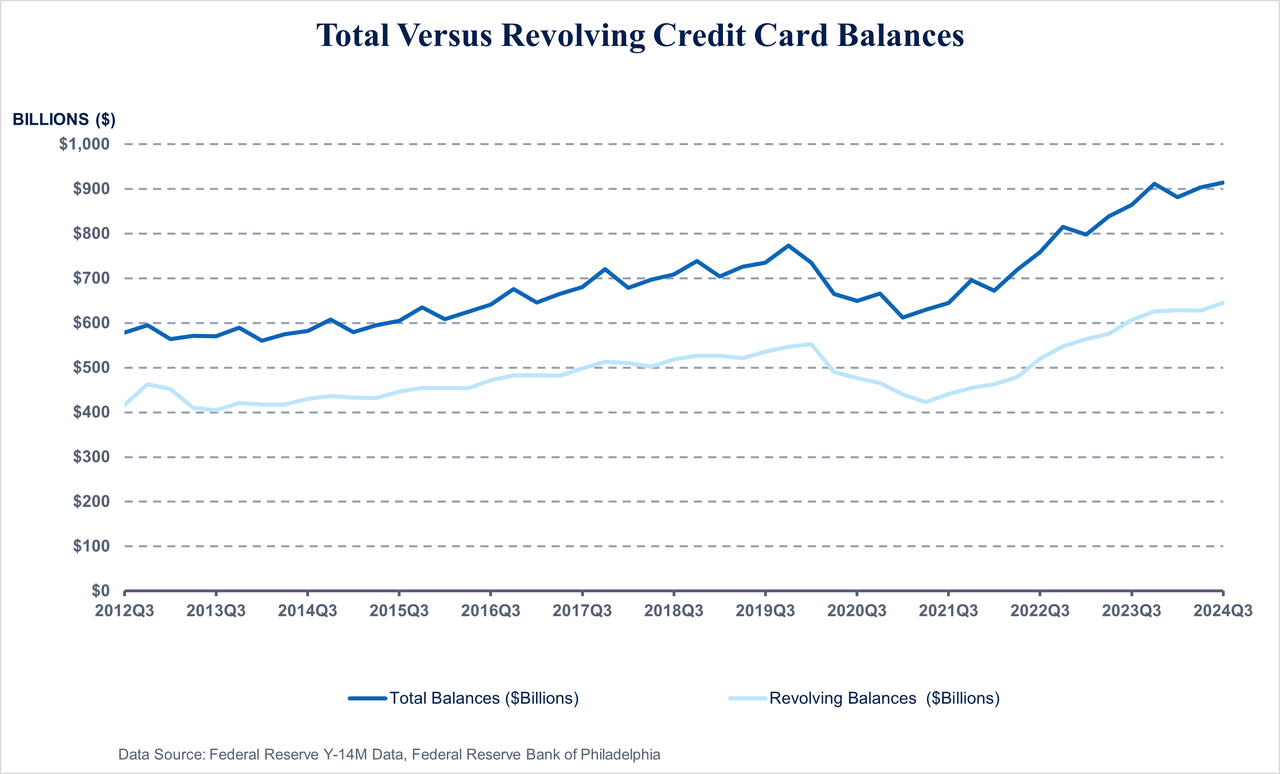
And as more consumers default on their debt, more are increasingly reliant on debt, period. Going back to the Philly Fed study, it found that revolving and total card balances have hit record highs since the series started in 2012. Revolving card balances reached $645 billion in third quarter 2024, which represents 52.5% growth since a decade low of $423 billion in second quarter 2021. Total card balances have also grown, reaching a record high of $914 billion.
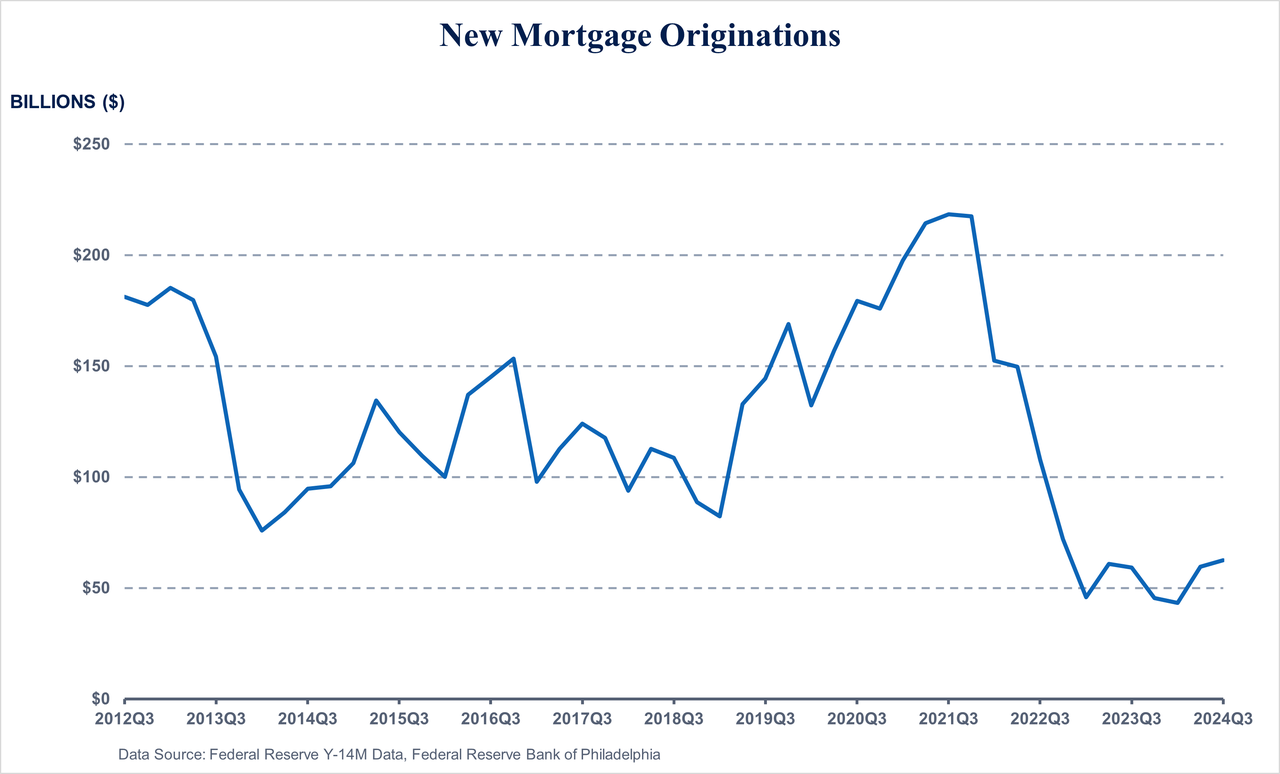
Of course, it’s all circular: in response to weaker credit performance, banks are adopting more conservative lending standards. Tighter bank underwriting is resulting in a measurable decline in new card origination commitments and higher origination credit quality, seen in rising original credit scores. Card balances increased to a new series high, but year-over-year card growth slowed to a nearly three-year low. Meanwhile, nobody can afford to buy a home:
first-lien mortgage origination activity remains at series lows in a high-rate environment, as banks averaged only $55 billion in mortgage originations per quarter in the first three quarters of 2024 after originating $219 billion at the peak of originations in third quarter 2021. With high interest rates, consumers with low-rate mortgages have less financial incentive to refinance, dampening new mortgage demand. The silver lining: wxisting mortgages are performing well as delinquency rates remain low (for now).
As the Philly Fed summarizes ominously, “consumers are not only spending more, leading to higher balances, but paying off less, increasing revolving amounts. Revolving balances as a percentage of total balances have steadily climbed since the pandemic low of 65 percent in fourth quarter 2021 to 71% in third quarter 2024.”
But it’s not just the macro that is ugly; listening to some of the recent company earnings calls shows just how truly miserable the US consumer has become at the end of the Biden administration.
As Goldman Delta-One head trader Rich Privorotsky wrote a few days ago, “the (weak) consumer theme is very well understood but in case it’s unclear, we have a low end consumer problem” and here are some soundbites:
- KSS CEO: “when you look at income level, if you’re making less than 50, that consumer is pretty constrained from a discretionary standpoint, if you’re making less than 100, it’s also pretty challenging. And you see that very clearly in the numbers”.
- DG CEO: “What has really become apparent leaving Q4 and moving into Q1 is the trade-down is back, both the mid and upper-end trade-down, and as we moved into Q4, seems to be accelerating. We’ll know a little bit more as we pull Q1 here, but I would tell you nothing that we’ve seen so far would show that that trade-down has slowed down”.
- ACN confirmed the impact of government spending cuts rippling through its business and noted a recent change in trend.
- FDX guidance was downbeat. “The current environment … is adding uncertainty to demand”… “I think it’s reasonable to assume that the macro-environment is not going to significantly improve at least for the first half of FY26”
That’s just the start. As Goldman reveals in its latest Consumer Retail tracker (full note available to pro subs), commentary from earnings calls is almost uniformly ugly:
- AAP (Feb 26): There is continued softness in the consumer spending environment, with deferral in spending for maintenance and discretionary items. They expect the consumer to remain pressured in the 1H, with the macro improving in the back half of the year.
- ASO (Mar 30): Consumer spending power remained constrained throughout the holiday seasom, and they assume that consumer behavior in 4Q will continue in 2025. They also expect to see continued growth in the upper income quintiles, while there is continued softness in the lower to middle income quintiles.
- AZO (Mar 4): Discretionary sales will continue to he pressured until consumer confidence improves. Lower income consumers are under pressure and will likely continue to he under pressure.
- BBWI (Feb 27): They are not assuming any improvement in the macro or consumer sentiment in their guidance. They
- are also continuing to see value-seeking behavior along with competitive intensity.
- BBY (Mar 3): The consumer will remain resilient but is still dealing with high inflation that is driving expenses up, making them more value focused and thoughtful about big ticket purchases. However, consumers are willing to spend on high price points when there is necessity/technology innovation.
- BJ (Mar 6): Consumers remain highly value conscious and discern from discretionary purchases. Tariffs may disrupt consumer spending given consumer wallets are stretched.
- BYD.TO (Mar 19): Consumers are currently putting themselves in a position where they are unable to afford fixing their vehicle. They also face high levels of insurance premiums as used car pricing increases.
- DG (Mar 13): “Consumers have reported that their financial situation has worsened over the last year as they have been negatively impacted by inflation. Many of their customers report that they only have enough money for basic essentials, with some having to sacrifice on necessities. As they enter 2025, they are not anticipating improvement in the macro environment and assume there is continued economic pressure similar to 2026.”
- DRVN (Feb 25): “They anticipate that the ongoing inflationary environment will likely continue to pressure consumer spending for 2025, with lower income households being the most impacted. There continues to he a lot of uncertainty, specifically with inflationary pressure and tariffs.”
- EYE (Feb 26): “The first few weeks of the year have been choppy for consumer retail, they have seen some wobble in the consumer. They see immigration as one of the many factors affecting consumer sentiment, with cash paying consumers the rnost challenged.”
- FL (Mar 5): “As they moved towards February, consumers became more cautious and sensitive; however, they are seeing consumers spend during compelling activations, key shopping events, or product launches. As they enter 2025, they are recognizing heightened levels of marketplace uncertainties and experienced increased pressure in the lulls between key events.“
- LOW (Feb 26): “They are still seeing a cautious consumer leading to contin !Jed near-term pressure on DIY discretionary spending.”
- OLLI (Mar 19): “Consumers rernain under pressure, with big-ticket categories remaining softer and the consumables category becoming stronger. The higher income consumer continues to trade down and the consumer responds to deals, whether they are discretionary or nondiscretionary.”
- ORLY (Feb 6): “Pressure on consumers and continued softness in discretionary categories persisted in 4Q. However, they remain cautious for the potential of worsening economic conditions, such as high price levels, high interest rates, and high energy costs. The consumer still remains cautious, especially the lower-end consumers.“
- TGT (Mar 4): “Consumers show a willingness to splurge on newness and holiday events, but persistent economic uncertainty has led consumers to take a cautious approach towards spending. While consumer spending trends are not hack to normal, they are seeing encouraging trends in their discretionary businesses. Consumers also cottinue bo resourceful, looking for the best deals and prices.”
- WMT (Feb 20): “They are assuming a relatively stable macroeconomic environment, but acknowledge there are still some uncertainties related to consumer behavior and geopolitical conditions.”
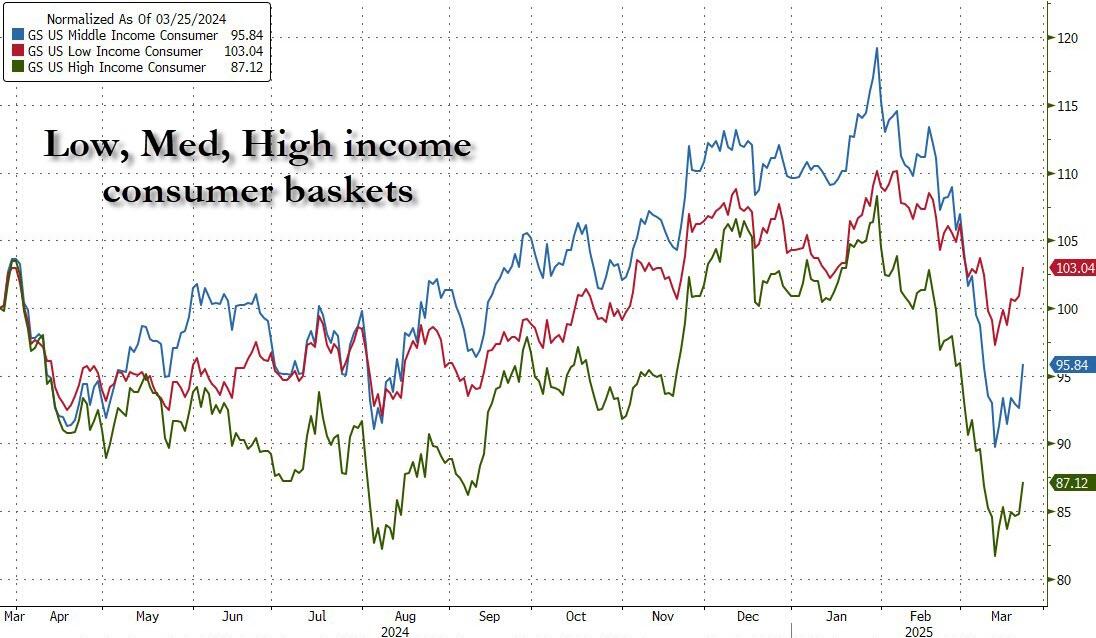
The silver lining is that for now, the high end is doing just fine: “Italian luxury group Brunello Cucinelli Thursday said its operating profit had risen 12.9% last year and confirmed its expectations of sales growth of around 10% in 2025 and 2026.” And yet, in a surprising twist, it is the Goldman “high-income consumer” basket that has been the worst performing over the past year, down about 13% since the start of 2024, with Middle-income down 4% over the same period. The surprising winner: stocks that track the low-income consumer are actually up about 3% since Jan 1 2024.
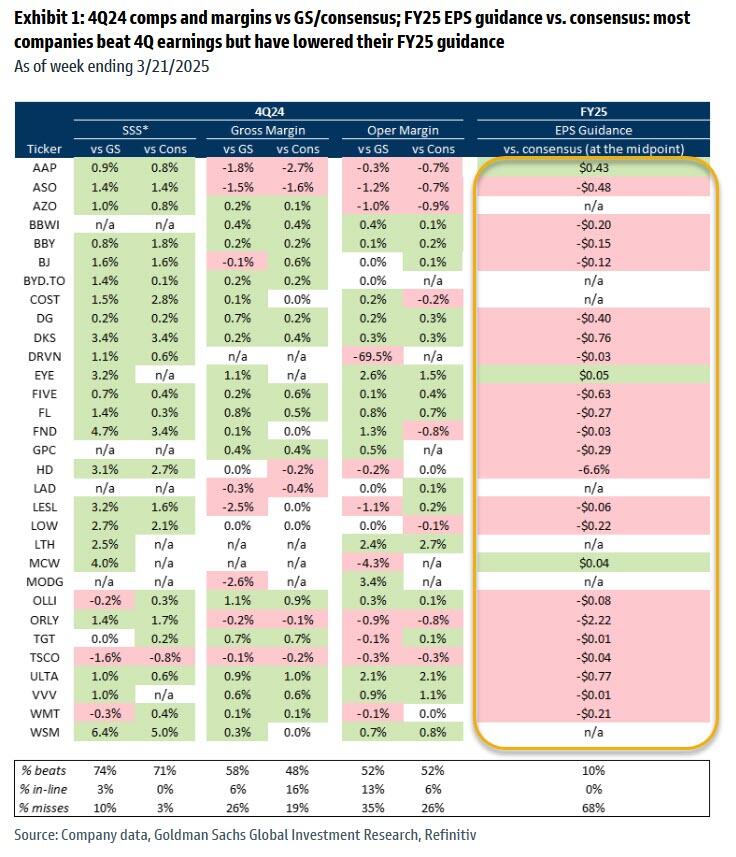
Don’t hold your breath on this outperformance to continue, however, especially when considering that dramatic cut to EPS guidance unleashed during Q4 earnings season which is shown in the Goldman chart below, which summarizes company results vs both the bank’s estimates and consensus.
It’s not all bad news: according to the latest Consumer Checkpoint report from Bank of America which uses aggregated card data as a source of data, consumers’ credit and debit card spending per household dropped 2.3% year-over-year (YoY) in February, compared to a rise of 1.9% YoY in January. However, that decline reflected the extra leap day in February 2024, which boosted spending last year and depressed the YoY growth rate for February 2025. Seasonally adjusted (SA) spending per household rose 0.3% month-over-month (MoM), with the three-month seasonally adjusted annualized growth rate (SAAR) at 2.4%, To be sure, the latest retail sales which came in stronger than expected corroborated this modest increase.
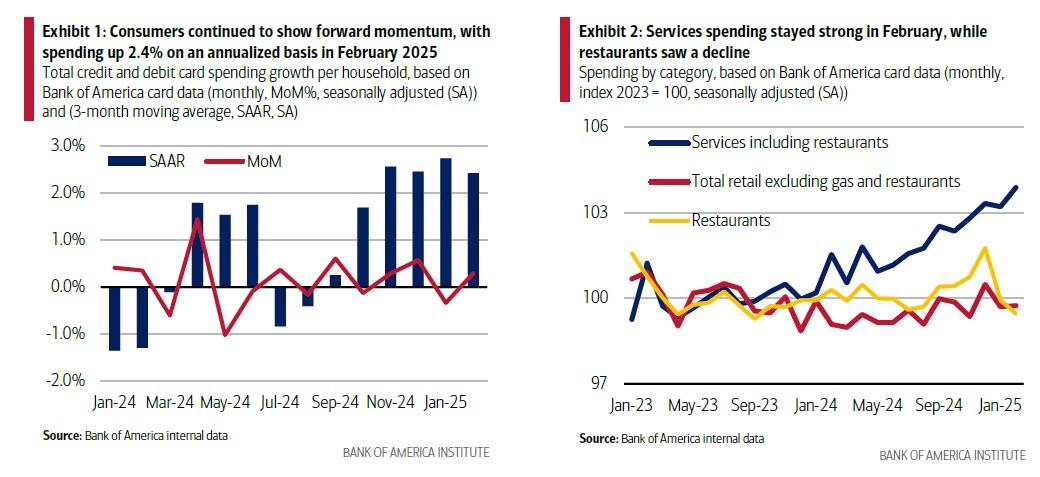
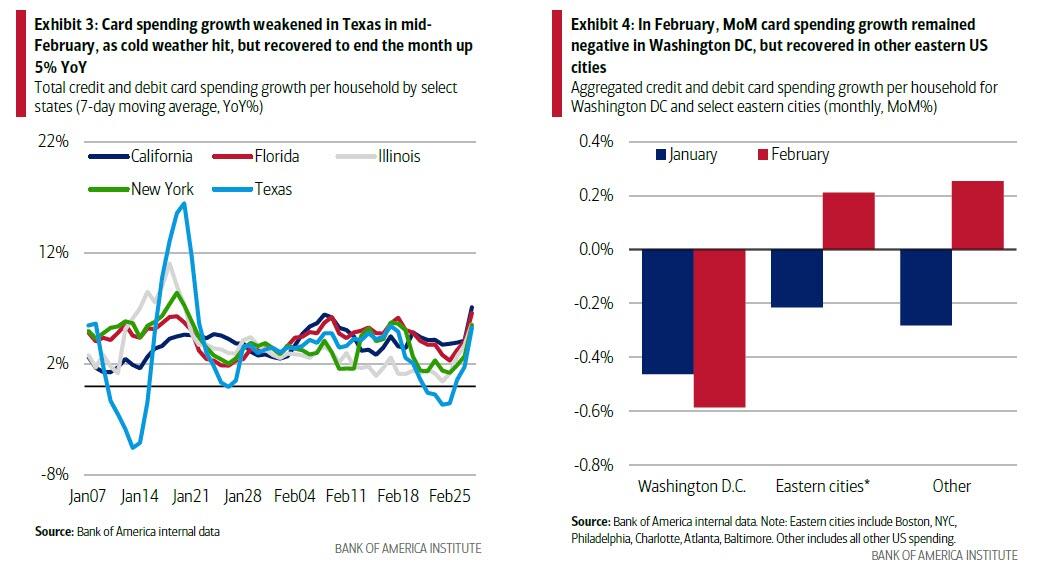
The bank founds that while spending was relatively strong in services in February on a MoM basis, there was a continued decline in restaurant spending. Additionally, retail spending (ex- gas and restaurants) was flat MoM, after declining in January. Here, BofA speculates that “the consumer is still demonstrating some underlying forward momentum in these early months of the year, though at a more measured pace.” This is particularly the case as the weather may be responsible for some weakness in the data, although as noted below, the weather is no longer seen as the primary culprit behind spending weakness (January was a cold month, with snow and ice in the South and Northeast). February also brought winter storms to the midwestern and southern US, evident in slowing spending growth in Texas in mid-month, although spending recovered toward the end of February
Card spending growth also weakened in the D.C. area in February, possibly due to the significant snow received during the third week of February. However, other major cities in the eastern portion of the US also received winter snowstorms and they experienced a spending growth recovery. So, it could also be that recent announcements and actions to reduce the size of the federal workforce may be weighing on spending throughout the DC area.
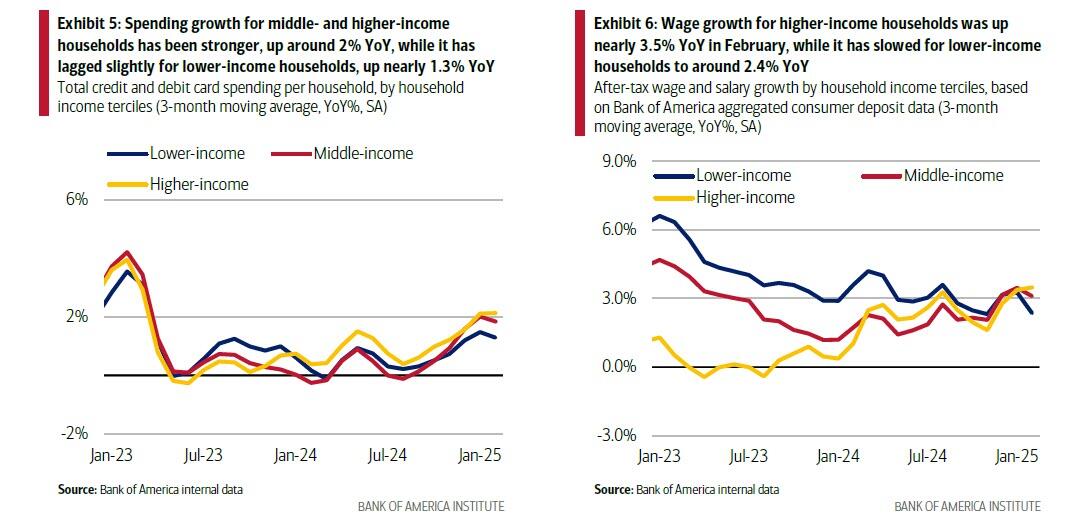
Not surprisingly, when looking at spending across income cohorts, the top-third of households by income category have largely had higher card spending growth than middle- or lower-income peers since February 2024. This contrasts with 2023 when the opposite was true. One reason for the recovery in spending growth in the higher-income cohort appears to be stronger after-tax wage and salary growth, which accelerated over 2024 after a period of weakness in 2023. In February 2025, after-tax wage and salary growth for this cohort accelerated further, up 3.5% YoY, compared to a slowdown in growth for lower-income households, up 2.4% YoY, according to Bank of America deposit data.
Also worth noting that higher-income households tend to hold more of their overall financial assets in equities. Data from the Fed suggests that the top 20% of households by income held around 43% of their non-real estate assets in directly held corporate equities and mutual fund shares in Q3 2024, compared to around 20% for the other 80% of households. The size of overall financial wealth will generally be higher for these higher-income households, too.
Rising financial asset values over 2023 and 2024 have likely provided an additional boost to spending growth for higher-income households over the past year or so through so-called “wealth effects” – the tendency for consumers to spend more as their wealth rises.
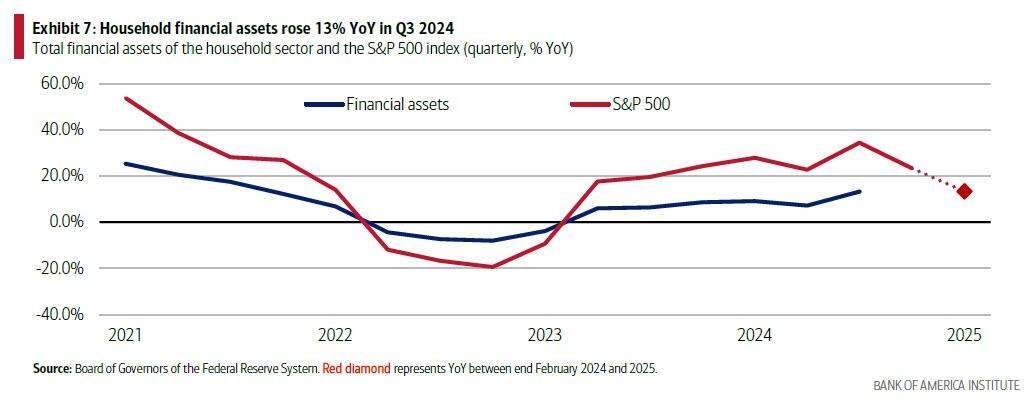
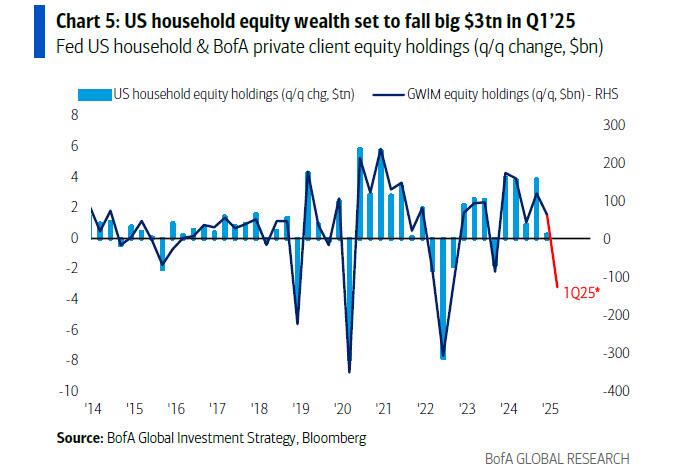
But how this relative boost to higher-income spending develops over the course of 2025 will depend, in part, upon how equities perform: according to BofA current levels of the S&P may suggest some of these wealth effects could dissipate this year. Worse, according to an analysis from BofA’s Michael Hartnett which we discussed over the weekend (see here), using BofA private client equity data, Hartnett estimated that US household equity wealth could fall $3tn in Q1 2025, which would explain the drop off in spending across most cohorts, not just low and medium-income households.
While stock prices are a key driver for high-income consumer spending, for lower- and middle-income households, it is elevated deposits that are likely to have been consequential in providing a tailwind or support to their spending, given they represent a larger share of their wealth. As the chart below shows, while diminishing, household savings balances are still above 2019 inflation-adjusted levels (but not for long).
Additionally, BofA notes that at this time of year, tax refunds can also be a seasonal boost to household deposits and potentially provide another tailwind, albeit temporary, to their spending. Looking at average tax refund payments into Bank of America deposit accounts over the 2025 tax filing season as of February 28, for households at the lower-end of the income distribution, the average refund was up around 4% YoY, with increases around 7% YoY for middle- and higher-income households.
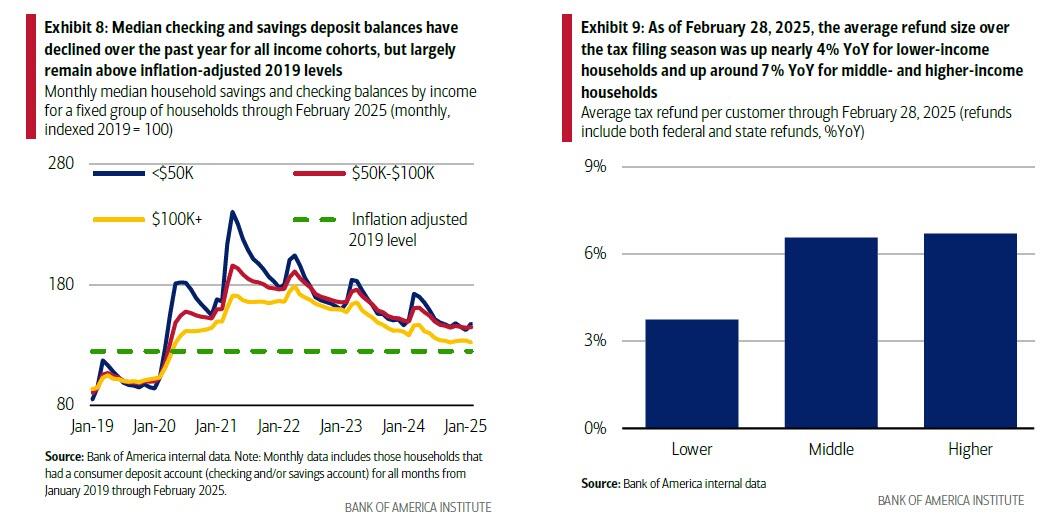
However, it’s still very early in the tax season to draw conclusions: according to IRS data, only around a quarter of the total tax filings had been made as of February 21st as the majority are likely to come throughout March and April.
Not surprisingly, perhaps the biggest wildcard is how much consumption will inflation, unleashed by the previous administration, steal. Consider that over the past year, prices for ‘food away from home’ (e.g., restaurants) have risen by more than prices for ‘food at home’ (e.g., groceries). But recently, prices for food at home have been increasing notably: up 0.5% MoM, following a 0.3% rise in December, and well above the average 0.14% MoM increase in 2024. While these sequential price increases are still relatively small, they are occurring after grocery prices have already risen nearly 30% since 2019. In fact, the largest MoM price increases appear to be for the grocery items that are already up the most.

This has been more obvious in some high-profile items; for example, the price of eggs rose 15% MoM in January, according to data from the Bureau of Labor Statistics (BLS), but have since fallen back. Eggs account for 2.5% of a typical grocery bill, so this increase alone may not be enough to ‘eat’ into the rest of consumer budgets. However, looking across all grocery categories, we can see that prices increased MoM for nearly 80% of typical spending in January. Additionally, meat, poultry, and fish – accounting for nearly 20% of an average grocery basket – experienced a 0.5% MoM increase

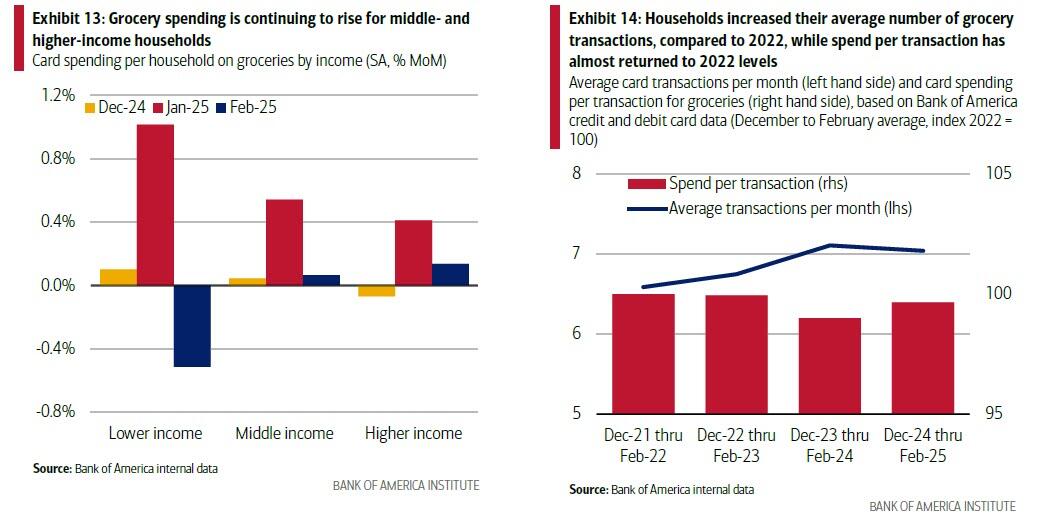
Conversely, fruit and vegetables, accounting for over 13% of a typical basket declined 0.6% MoM. However, given that imports have made up an increasing share of US food consumption, especially for non-manufactured goods like fruits and vegetables, potential tariffs may put price pressures on even more items in consumers’ grocery carts in future. This rise in grocery prices appears to be partially reflected in household spending, according to Bank of America internal data. Chart 13 shows that those with lower incomes spent around 1% MoM more on groceries in January, with smaller rises for middle- and higher-income households. While lower-income households saw a decline in February, middle- and higher-income households saw another rise. It may be that some of the recent decline in grocery spending at the lower end of the spectrum may be due to a spreading out or trading down effect, as some lower-income households head to general merchandise or discount stores to save money.
How might consumers respond to higher food prices if they continue to take a ‘bite’ out of their spending power? Chart 14 chart shows that one response to earlier food inflation was that consumers shopped for groceries more often but spent less each time. More recently though, the amount spent per transaction has increased while the number of times consumers shop has eased only slightly.
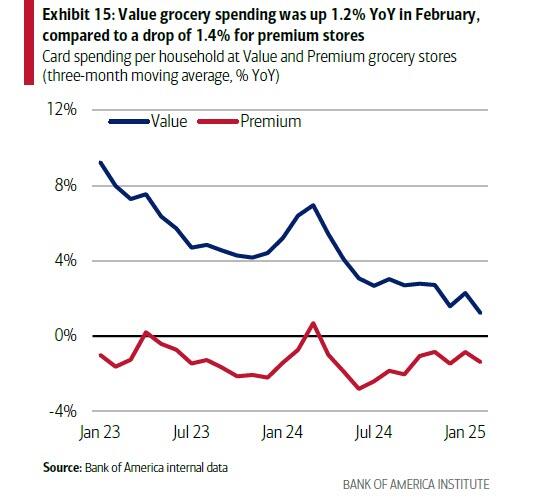
This approach of ‘more but smaller’ shops may allow consumers to focus on buying things they feel represent good value at particular stores. And a natural counterpart is households also shopping increasingly at ‘value’ grocery stores (see our piece on value groceries for more). The chart below shows that this trend is ongoing, and in February 2025, grocery spending per household at value stores rose 1.2% YoY, while it dropped 1.4% YoY for premium grocers.
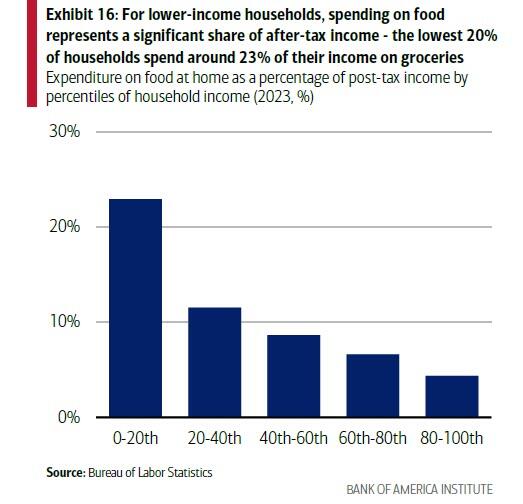
Overall, if food prices continue to rise, consumers could continue to employ some of these strategies to try and limit the pass-through of higher prices onto their grocery bills, which, in turn, may reduce the risk of them needing to pull back their spending elsewhere. This is particularly relevant for lower-income households, where groceries swallow up a significant share of income.
So what does Wall Street think of all of this? For the answer we went to Goldman Consumer specialist Scott Feiler who published a note yesterday (available to pro subscribers) laying out 5 points about the health of the US consumer. Here is his assessment.
Has the US Consumer Slowed?: I would argue the debate has moved past whether or not we have seen some slowing in US consumer. We have. I think the bigger focus/question should now shift to what is already priced in as opposed to any surprise when a company notes some volatility in 1Q trends. The other debate should be whether the slowdown can quickly stabilize/reverse if the tariff outcome/headlines are not as bad as feared and confidence readings stabilize. Some thoughts on timing for a trade below…
1. Not Just Weather: The year started off choppy in January and February, though it was most impacting companies with exposure to adverse weather trends, especially apparel companies and restaurants. After comments from airlines, cruise lines (just modest slowing) and some data in hotels recently pointed to some slowing (hotel the focus this past week from investors), it seems clear that the slowdown has spread some and it is not just weather related.2. Shouldn’t This Be Known By Now? Many of the names (especially in travel) are down 20-40% into their updates. My view is the price action is ultimately going to be much more interesting to me than when a company tells you they saw some volatility in February/March. I would note CCL rallied back from –7% to close down just -1% on their comments about the macro, hotels rallied from -5% to -1% after some of their weekly data came out soft and FDX, while -6% on the day, did finish at the highs. Lastly, footwear and athletic stocks traded very well Friday, despite NKE’s weak guide and comments that they expect tariffs to have a big impact to both top and bottom-line for them.
3. It is specific to the low-income? We received this question a lot this week. While the high-end consumer has continued to hold up better than other pockets of consumer and the confidence readings have been better vs this cohort, there have been companies speaking to a slowdown at the higher-end in the US, including Prada and Viking. Ultimately though, if the market stabilizes, so too should high income spend.
4. Is it all bad? No. I would argue we got some slightly better reads this week vs fears. Government retail sales came in better than feared, the BofA CEO spoke very constructively about the consumer, DRI (a bellwether of sorts in casual dining) noted an acceleration in their QTD trends and FIVE/SIG (while not bellwethers of spend) both spoke to better 1Q trends. While some of these may be company specific, we are not yet in an environment where it’s a coordinated across the board slowdown, even if it is impacting more companies than not.
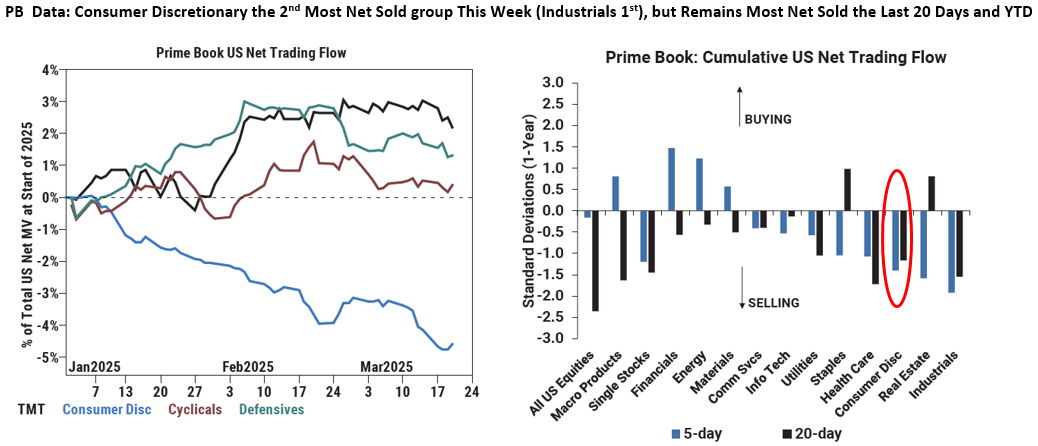
5. Next Catalyst: The Consumer Discretionary group is -8% YTD, underperforming the market by 500 bps. Our PB data also reflects concern, as the sector has been the most sold in our PB data YTD and was net sold again this past week, despite the slight relief in the market. Despite that, I do think investors are looking to 2H of April as a long trade for the group. On the seasonal and general merchandise side, the later Easter (April 20th in 2025 vs March 31st in 2024) will create headwinds right now that become tailwinds shortly, Gross relative PB exposure is at 5-years lows in the group and there’s a hope that there could be some relief (a couple weeks of wiggle room for negotiations post April 2nd), or at least some certainty, on the tariff front by then.
Bottom line: The low – and increasingly medium – consumer is broke and struggling to make ends meet from month to month. And while the high-income consumer is anecdotally still doing well, they are increasingly trading down and judging by the market, this will be the next shoe to drop. In any case, if and when the US consumer finally falters – bearing some 70% of US economic growth on his back – that will be the trigger for the next recession, and while all the pieces were put in place by the Biden admin for the next economic contraction, it will be Trump who will be the object of the mainstream media’s propaganda ire.
Which once again brings us to the question we asked two weeks ago: is Trump trying to push the US into a recession, one which he will blame on Biden, then promptly stimulate out of, and set both the economy and market on the correct footing into the midterms. If so, Trump better make up his mind fast, because every day that US economy does relatively well without grinding to a halt, is one day that will make blaming Biden for the current dismal economic picture that much more difficult.
More in the full notes from Goldman (here and here) and Bank of America (here), all available to pro subscribers.
Tyler Durden
Mon, 03/24/2025 – 17:20
via ZeroHedge News https://ift.tt/wqfxRiU Tyler Durden