Authored by Christopher Wood via Grizzle.com,
Fund managers entered 2019 shaken and stirred. So more of a relief rally would not surprise, most particularly given the absence of the traditional year-end rally, though the S&P500 bottomed on Boxing Day and is now up 10.6%.
The triggers for the relief rally clearly relate to the twin topics of trade and tightening. On trade the base case remains that a deal will be done between America and China within the allocated 90-day period for reasons often discussed here; though it is clearly a positive that trade negotiators commenced talks last Monday in Beijing.
QUANTO TIGHTENING IS NOT ON AUTOPILOT
On tightening there has been a more substantive development when Fed Chairman Jerome Powell went out of his way on Jan. 4 to reassure markets that he was ready to respond quickly to data if needed and that, effectively, quantitative tightening was not on autopilot.
Powell said at an annual meeting of the American Economic Association in Atlanta that the Fed “will be prepared to adjust policy quickly and flexibly”. He also noted, “If we came to the view that the balance sheet normalization or any other aspect of normalization was part of the problem, we wouldn’t hesitate to make a change”. It is also interesting that Powell was reading from prepared notes during the speech, presumably to make sure he was “on message”.
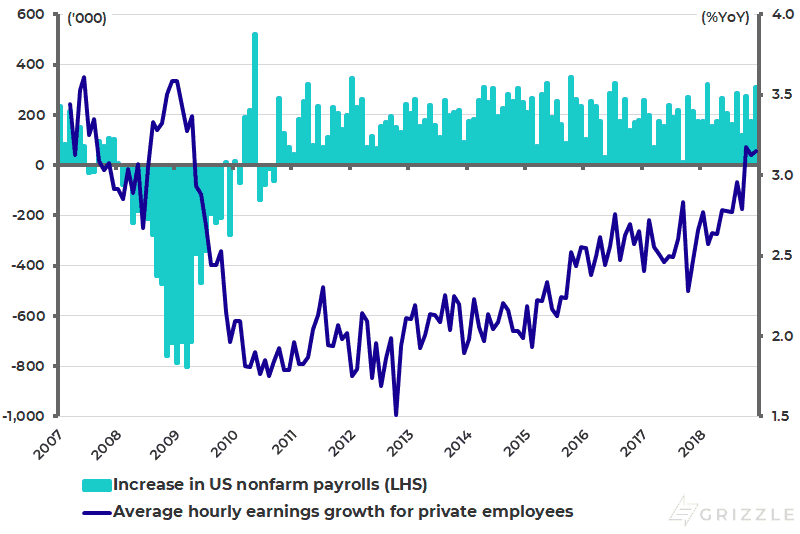
For the market, those comments were treated as more relevant than the latest U.S. job and wage data which, ostensibly, make it harder for the Fed to stop tightening. U.S. nonfarm payrolls rose by 312,000 jobs in December, up from 176,000 in November and the biggest increase in 10 months. While average hourly earnings growth accelerated from 3.1%YoY in November to 3.2%YoY in December, matching the level in October which was the highest level since April 2009 (see following chart).
U.S. INCREASE IN NONFARM PAYROLLS AND AVERAGE HOURLY EARNINGS GROWTH
Source: US Bureau of Labour Statistics
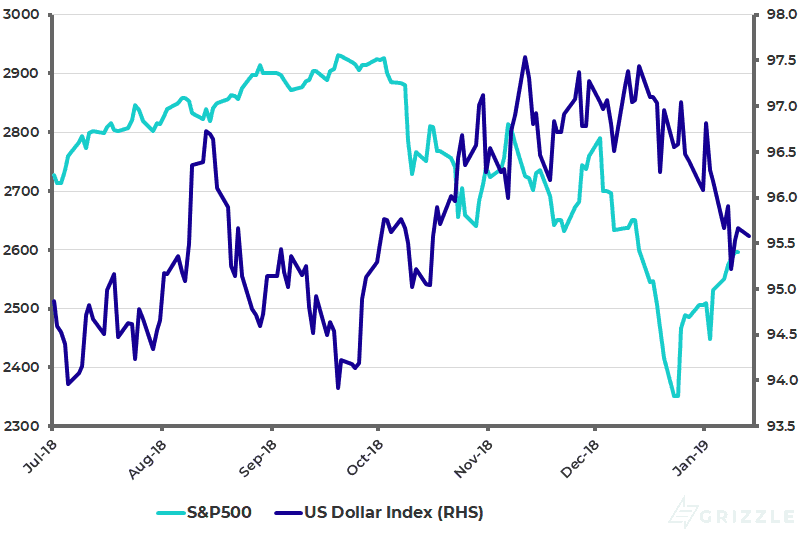
The market is probably correct to pay more attention to Powell’s comments than the job and wage data, which is why stocks rallied and the U.S. dollar corrected on Jan. 4 (see following chart). This is because rising wage pressure is a classic “late cycle” indicator while all the money and credit data indicate a slowdown is coming in America this year, be it M2 growth, loan growth or bank deposit growth.
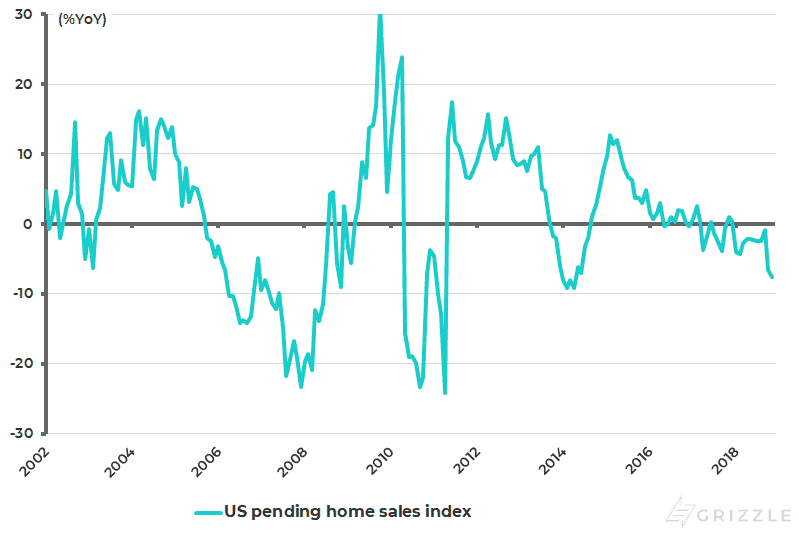
Meanwhile, a further indication of the weakness in the housing sector came with the latest U.S. pending homes sales (of existing homes) which declined by 7.7%YoY in November, the 11thconsecutive month of year-over-year decline (see following chart).
S&P500 AND U.S. DOLLAR INDEX
Source: Bloomberg
U.S. PENDING HOME SALES INDEX %YOY
Source: National Association of Realtors
If Powell’s change of language has started to reduce investor concerns it has to be remembered that quanto tightening, in the form of Fed balance sheet contractions, for now proceeds at a rate of US$50 billion a month, the consequence of which will be increasingly negative.
Yet it will probably take more negative market action to prompt the Fed to stop even if it may have effectively paused as regards the prospects for more Fed rate hikes. The other point is that the release last week of the Fed minutes of the December FOMC meeting has made it clear that many Fed governors were having second thoughts about more tightening at that time.
It is also interesting that Powell in his comments last Friday cited 2016 as an example of when the Fed was prepared to go on hold in response to market action. While this was indeed the case it should be remembered that there is a big difference between then and now.
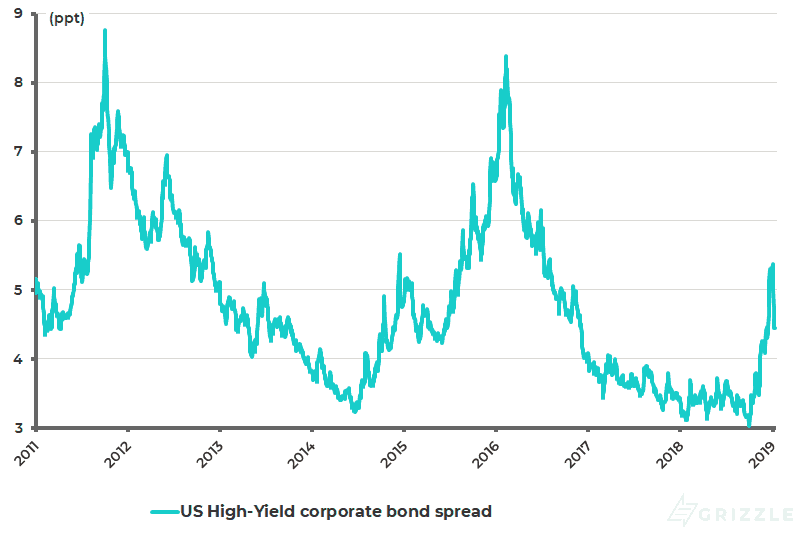
The 2016 “risk-off” action was very much centred on the collapse in the oil price and the resulting related spike in U.S. junk bond yields dominated as they were then by the shale sector (see following chart). By contrast, the recent “risk-off” action has come after 15 months of monetary tightening in terms of balance sheet contraction and after three years of rates hikes, which began in December 2015.
U.S. HIGH-YIELD CORPORATE BOND SPREAD
Note: Based on the Bloomberg Barclays US High-Yield Corporate Bond Index. Source: Bloomberg
Meanwhile, if there is growing evidence in coming months that the American economy is really slowing, the market will be increasingly hoping for not just an end of tightening but also renewed easing. But it is going to take the Fed time to go from “double whammy” monetary tightening (i.e. rate hikes and quanto tightening) to renewed easing unless there is a complete market breakdown triggered by surging credit spreads.
THE REACTION TO CHINA
Meanwhile, for those looking for a change in Fed policy sooner rather than later, the risk is that the base case of a trade deal between the U.S. and China delays this by creating the catalyst for more of a countertrend equity rally led by Asia.
Some support for such a continuing rally will also have been provided by the latest easing measures from China, including a reserve requirement ratio (RRR) cut. The People’s Bank of China (PBOC) announced on Jan. 4 a 100bp cut in the RRR to 13.5% for large banks. These moves will release a net Rmb800 billion in liquidity into the financial system.
Beijing will also soon unveil larger-scale tax cuts and tax exemptions for small and medium enterprises (SMEs), according to a statement released after a State Council executive meeting chaired by Premier Li Keqiang on Jan. 9.
The reaction of the Shanghai A share market to the latest easing move has been nothing like as exuberant as Wall Street’s to Powell’s recent comments on Jan. 4 (see following chart). This is because Beijing remains unwilling to indulge in another mega stimulus since China understands this will only increase long-term systemic risk in terms of high debt levels and the like.
SHANGHAI COMPOSITE INDEX
Source: Bloomberg
China also understands that it is now a consumption-driven, not an investment-driven, economy. And with the working-age population having peaked in 2011 (see following chart), this inevitably means slower growth.
CHINA WORKING-AGE POPULATION
Source: CEIC Data, National Bureau of Statistics
via RSS http://bit.ly/2Rpczsa Tyler Durden


