Authored by Sven Henrich via NorthmanTrader.com,
Before I go into charts some things just have to be said:
All pretense has been laid to rest. Bears have been proven right. Markets are managed by a central planning committee.
Jerome Powell’s spectacular policy reversal produced the strongest January market rally since 1987 demonstrating once again the ugly truth that the Fed remains the largest price discovery mechanism driving markets. Powell spoke once, twice and thrice in January and each time markets went:
All Hail Chairman POW.
Not earnings, nor revenues, not growth, nor fundamentals mattered. All play second fiddle to the workings and mutterings of central bankers. Why even pretend we have a free market system? A system that is never allowed to price in bad news for more than a few days is doomed to bubble toward infinity. Too urgent is the reflexive impulse to intervene, too desperate is the realization the economy is only one risk-off event away from a recession.
Jim Cramer squarely blamed the December sell-off on the Fed and attributed the Fed’s to leading role for the strong January rally:
The implicit message: The Fed screwed up and had to rescue markets from its mistake.
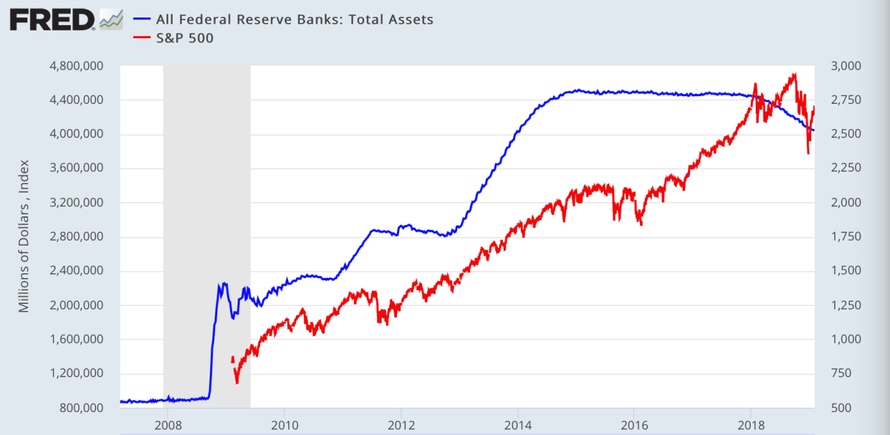
But what was really the mistake? The Fed had embarked on the slowest rate hike cycle in history. They weren’t too aggressive. No, the mistake originated in accelerating the balance sheet reduction which in real world speak is removal of artificial liquidity. Some claim reducing the balance sheet is the equivalent of stealth rate hikes. If that’s true what was the $3.5 trillion dollar run up in the balance sheet in the years prior?
The answer is academic. What is real is that markets couldn’t handle the withdrawal in liquidity:
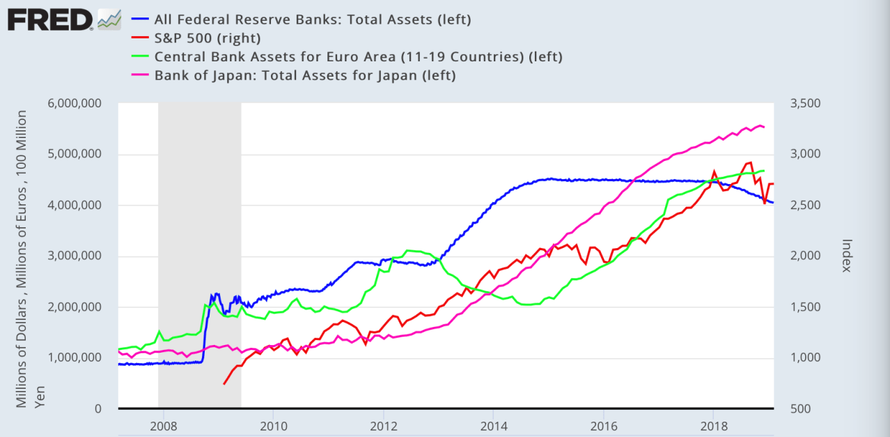
Oh sure the Fed gave it a shot in 2018 while things were good. After all the US tax cut brought about the largest buyback liquidity injection in history and while the Fed’s balance sheet had flatlined after the end of QE3 the ECB and BOJ took over the global central bank liquidity expansion program:
It’s only when the ECB reduced its QE program and the Fed began to accelerate their “autopilot” reduction in October, the infamous ’50Bs’ POTUS complained about, that everything fell apart. And that was the supposed policy mistake. The fact is that 10 years after the financial crisis central bankers don’t have a working exit plan. The fact is that temporary emergency measures have become permanent and the system can’t do without them. The Fed’s dot plot has once again been exposed to be a mirage only on the table when market rise, never when markets fall.
Well, no more worries about the balance sheet reduction, it’s been fixed:
Fed could soon stop trimming $4.1 trillion portfolio, Powell says
“The Federal Reserve may wind down its gradual asset-shedding operation sooner than thought, leaving the U.S. central bank with a bigger balance sheet than earlier anticipated, Fed Chairman Jerome Powell said Wednesday”.
Translated: We tried and it blew up in our face, so we’ll stop and we’re stuck with a huge balance sheet. Forever. Watch what we do next time.
Market appeasement at its finest, but with a steep price: Not only did the Fed kill off its credibility, it also looks to have overtly caved to President Trump’s public twitter demands to stop rate hikes and the “50Bs”. Trump demanded and Powell delivered. So much for backbone. None. Whether the Fed admits it or not the perception is awful. They caved to political and market pressure.
Asked several times about the “Powell put” during the press conference Powell kept avoiding answering the question. Instead he mumbled platitudes about “serving the American people”. Which American people? The greatest price market discovery mechanism was again applied to the few people that benefit.
“We’re data dependent and will wait and see” Powell uttered on Wednesday still claiming slowing economic data was behind the change in policy. Just 2 days later NFP came in at +304K and ISM manufacturing clocked in at a brisk +56.6. No, economic data was not the driving motivation to flip policy on its head. It was plunging markets in December. Full stop. Please don’t pretend otherwise, it’s intellectually insulting.
But Chairman POW may have made a tactical mistake in following Janet Yellen’s 2016 script of halting rate hikes after markets corrected hard following her initial December 2015 rate hike. Janet Yellen paused rate hikes at the market lows, at a moment of a market retest. By doing so she set the floor as other central banks stepped in.
Chairman POW on the other hand laid all the cards on the table 6 weeks into the largest uninterrupted rally since the 2009 lows. What’s he going to do if there is a retest? Immediately end the balance sheet reduction? Markets already expect that. Pause rate hikes? Markets already priced that in. So cut rates then? That seems to be the only policy option on a retest. Better hope there is no retest.
Current sentiment is now very optimistic again, and I’ve outlined the bull case in The Empire Strikes Back should a renewed dovish Fed prevail in supporting asset prices into the rest of 2019. And so again the basic question remains: Will dovish central bankers trump fundamentals? Do fundamentals actually matter?
Let’s not forget that the global slowdown is not over, it has been intensifying in recent weeks. Europe’s largest economy is crawling to a halt: Germany’s economic downturn will last longer than previously thought with GDP growth “well below” 1.5% in 2019, Bundesbank President Jens Weidmann predicted. Less than 1.5% GDP growth in Germany while Italy falls into a recession.
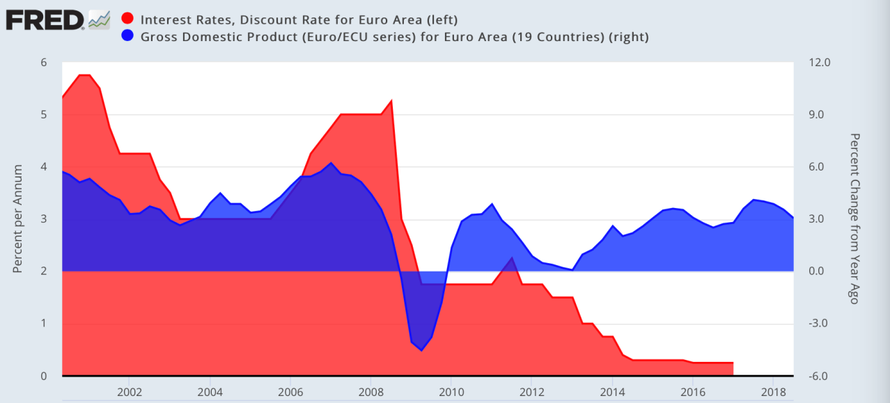
So excuse me for asking a pertinent question: What happens when countries fall into recession with interest rates still negative? Answer: Nobody knows, because it has never happened before. And frankly that prospect should concern everyone:
The ECB’s deposit rate has been at -.40% since March of 2016. They have never raised rates once and won’t this year and can’t do so next year. If negative rates were to promote sustainable growth they have failed to do so. What has QE produced? Trapped central bankers it looks. The emergency measures became permanent and now nobody knows how to unwind them. The Fed gave it a cautious careful effort and has now failed and capitulated to market forces.
What does this all say about the giant global central bank intervention game since the financial crisis 10 years ago? It smells of utter failure, of failed promises, of never reached growth, indebted nations and corporate sectors and sprawling wealth inequality with no practical plan to ever revert to “normal”. Normal is no longer possible and once again central bankers have found themselves trying to save markets from the consequences of another bubble they themselves again fueled with cheap money.
Hence, given this concerning backdrop I’m keeping a very open mind about the bear case, the one that says central banks may lose control over markets that they have carefully managed for 10 years. And in this context Chairman POW’s jawboning operation was a sign of desperation and not strength. Central bankers who have lost credibility may also lose respect of markets.
And if so, it lends credence to the supporting technical and macro evidence that suggests that a bear market can still unfold here in the months to come:
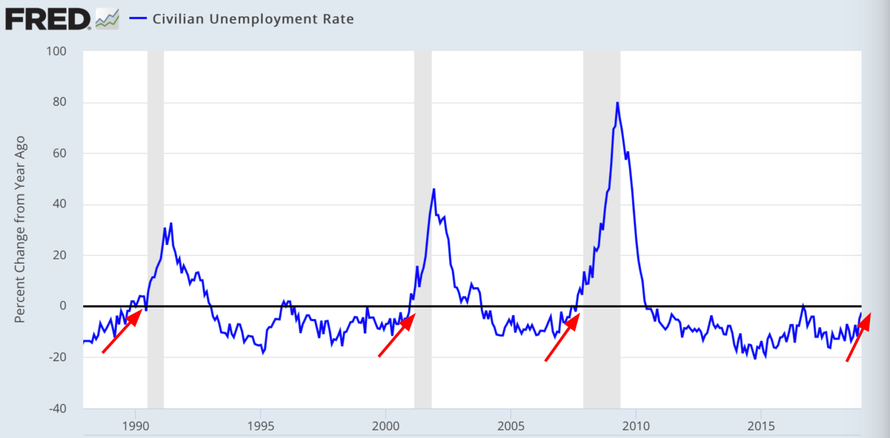
While the headline number in NFP indicated a strong gain in hires the unemployment rate also jumped a little higher. This is of note and bears close watching in the months ahead as a change in the direction of unemployment can signal a turn in the business cycle and history suggests that these can happen quickly:
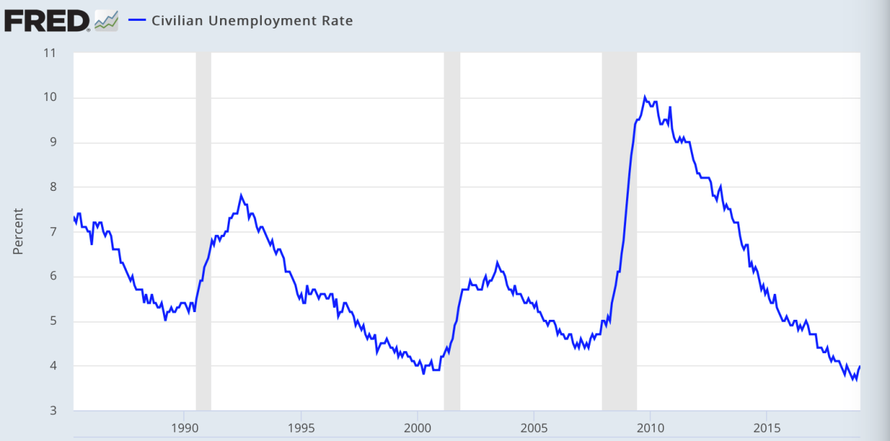
Don’t forget we’re coming off of a very low baseline here:
And don’t let the headline NFP numbers fool you, layoff announcements are increasing.
Now let’s go through the charts:
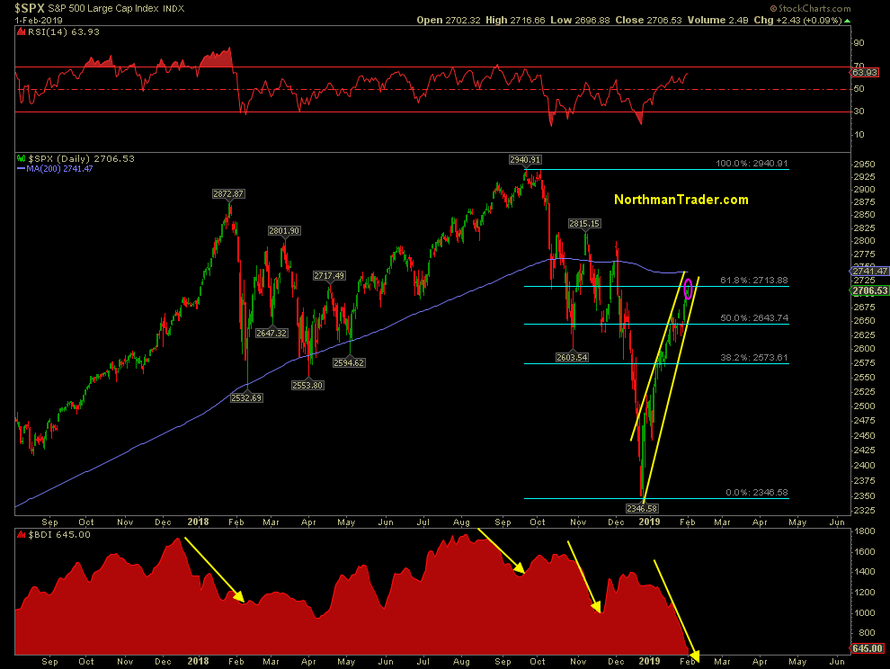
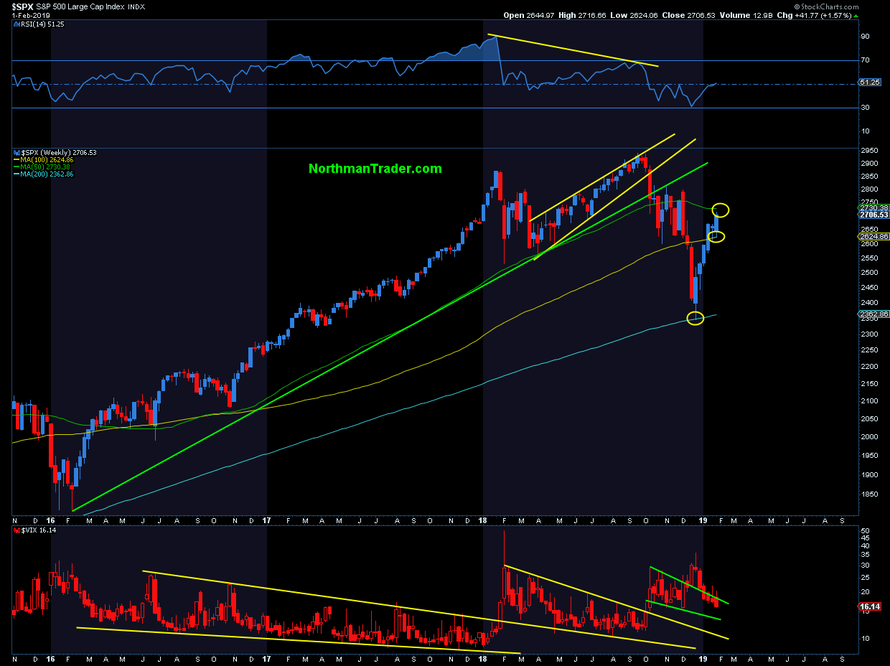
Firstly, markets remain in the neutral zone, still above the daily 50MA, but below the 200MA, and hence so far this rally remains an aggressive rally below the 200MA:
Speaking of fundamentals deteriorating, note that this recent rally went entirely against the most recent trend in the Baltic Dry Index which made a new low in January:
Over the past year declines in the Baltic Dry Index have led to reversals in $SPX. Also note $SPX reached its .618 fib on Friday and found resistance there. Resistance is now the name of the game on a lot of charts. $SPX has the daily 200MA above and following a 6 week uninterrupted rally $SPX is now also near its weekly 50MA:
These MA’s are important pivots. Given the size and uncorrected nature of this rally it is at increased risk of an at least short term reversal.
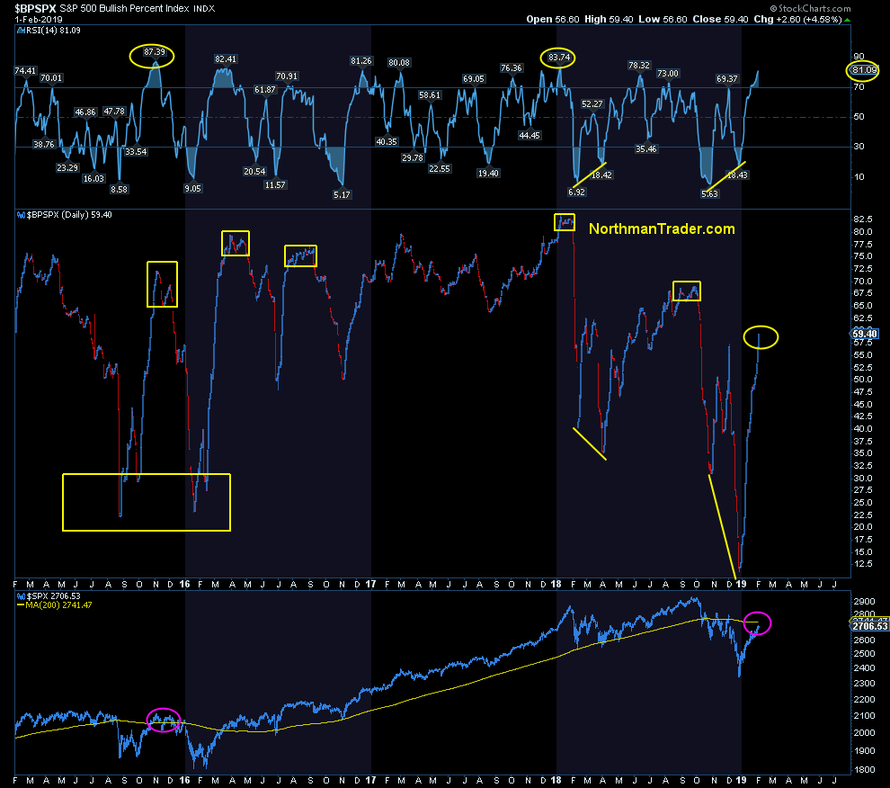
After all $BPSPX RSI is now the most overbought since January 2018 before the 10% February correction:
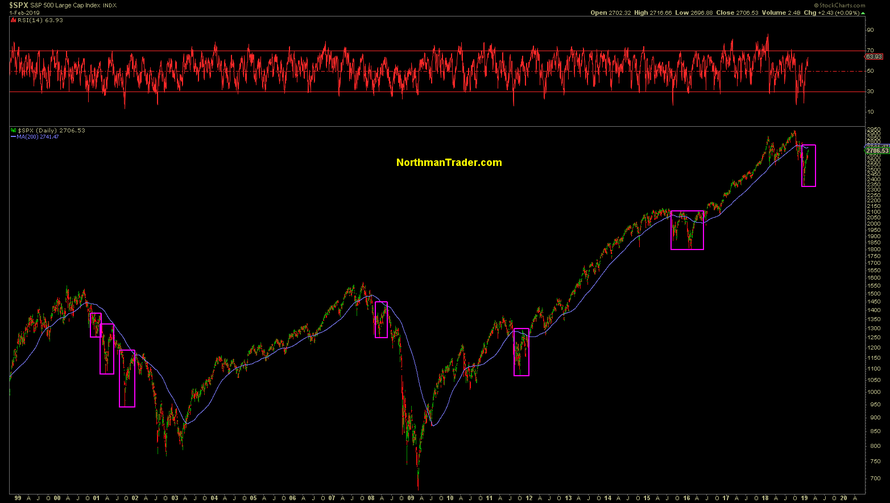
And also note another time when the RSI spiked above 80 following a big sell-off: Following the 2015 correction. Back then markets squeezed slightly above the 200MA, consolidated and then corrected to new lows which then prompted the big global central bank rescue operation.
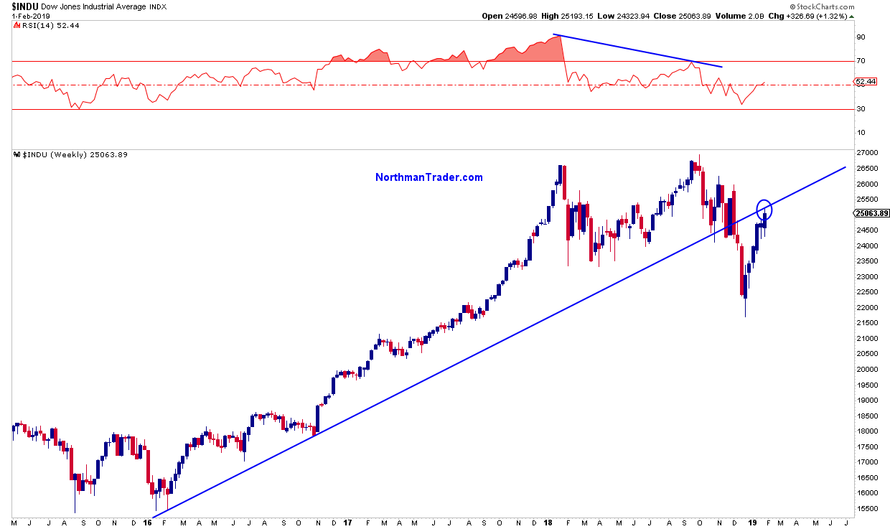
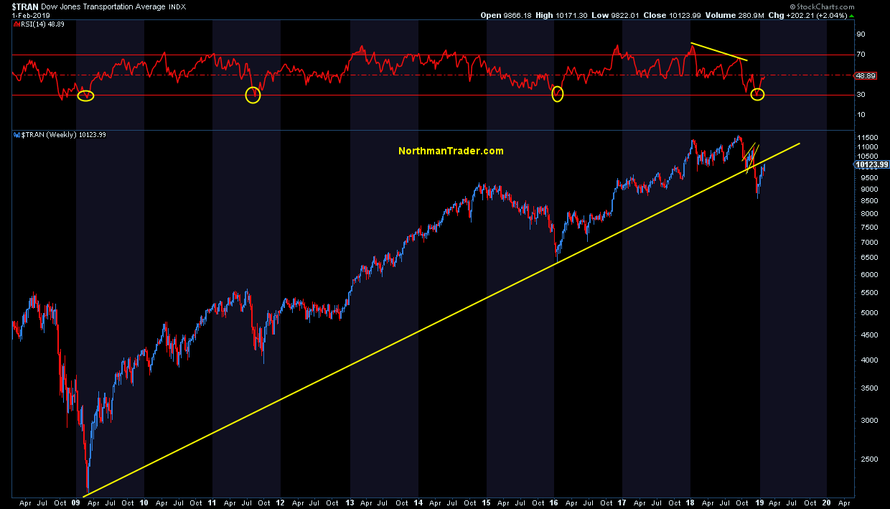
But it’s not only $SPX that’s running into resistance here.
$DJIA:
$TRAN:
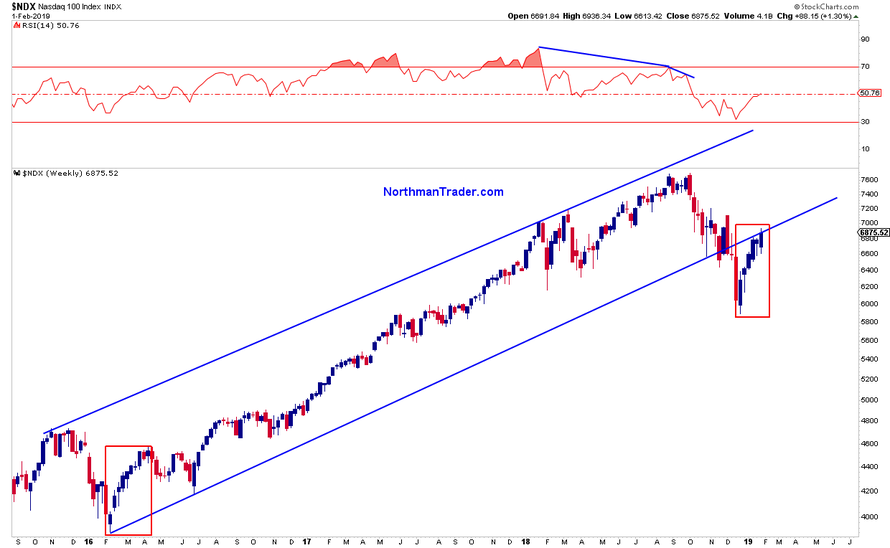
$NDX:
You get the message: Trend line resistance, fib resistance, and MA resistances, all here and/or just above.
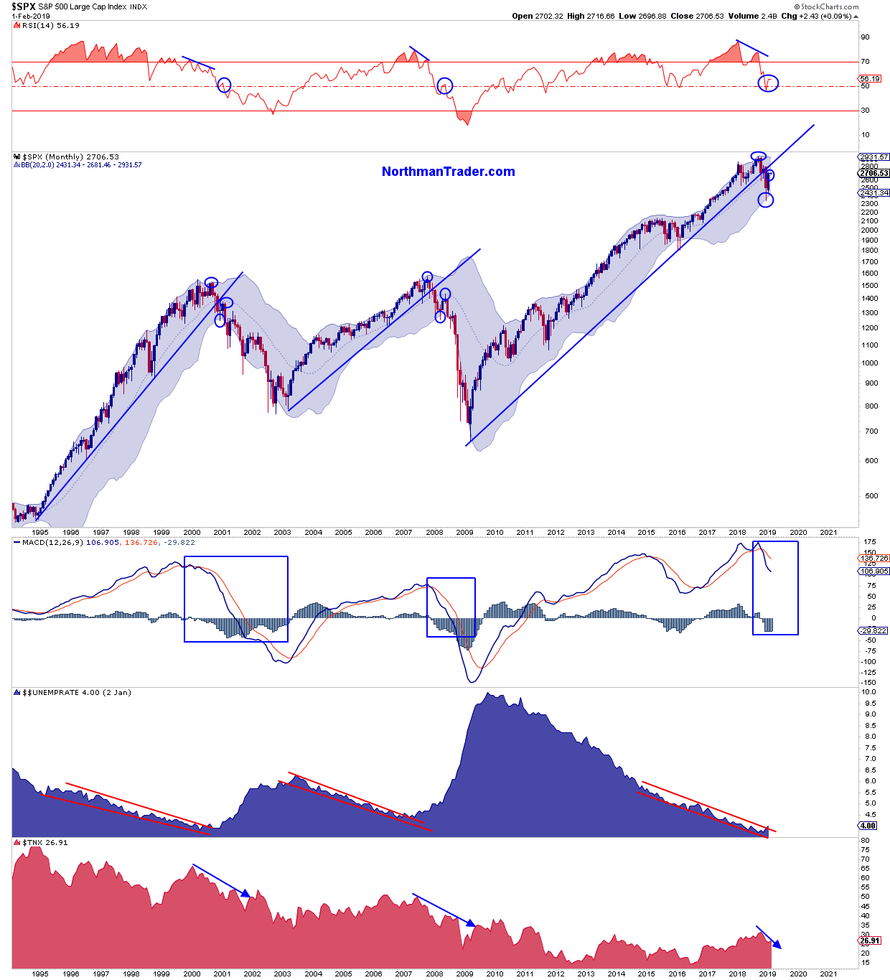
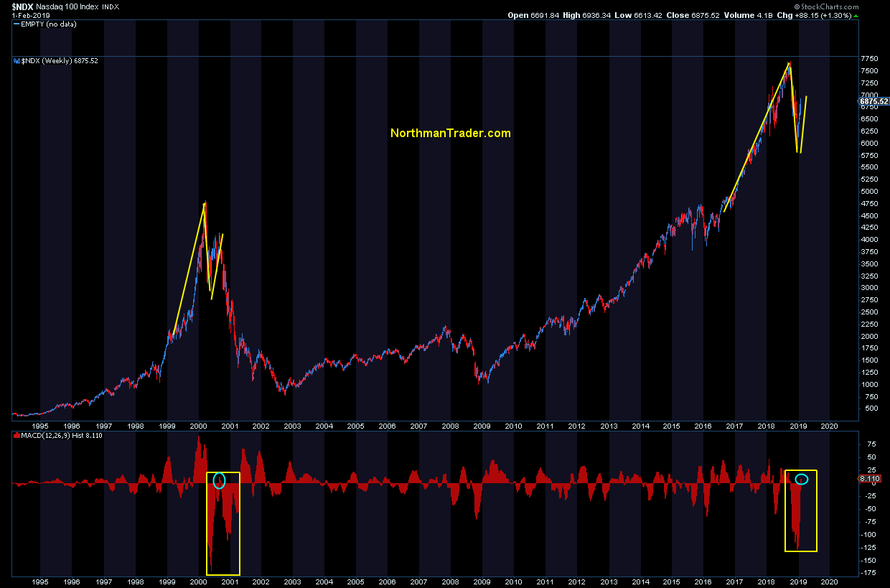
Speaking of $NDX here’s a historical chart that gives an interesting perspective to the brutal December sell-off and current rally:
Note the MACD histogram in December reached oversold readings only similar to the readings seen last during the crash of 2000. The counter rally that ensued then brought the MACD histogram back to positive…the worst was over right? No. The real fun only began after.
Hence I maintain the bull case remains unconfirmed as of yet. For now we continue to have witnessed a very aggressive counter rally below the 200MA partially fueled in speed and vigor by Chairman POW, but the fundamental picture has not improved. It continues to weaken globally. Bulls need to get prices above the 200MA and then maintain them above there to confirm a bullish path supported by a renewed dovish US central bank. Failure to do so risks the retest or bear case to unfold.
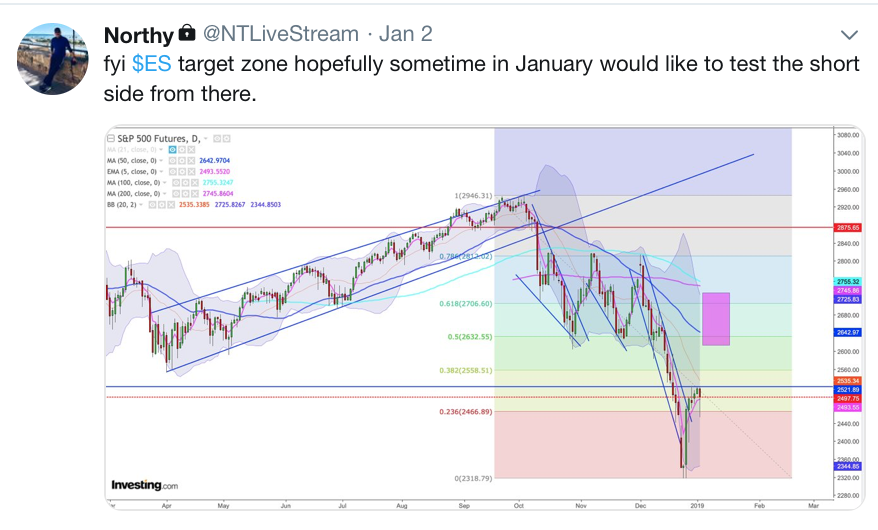
Markets have largely reached balance now after being highly imbalanced in December. $ES has also now reached the upper target zone I outlined in early January:
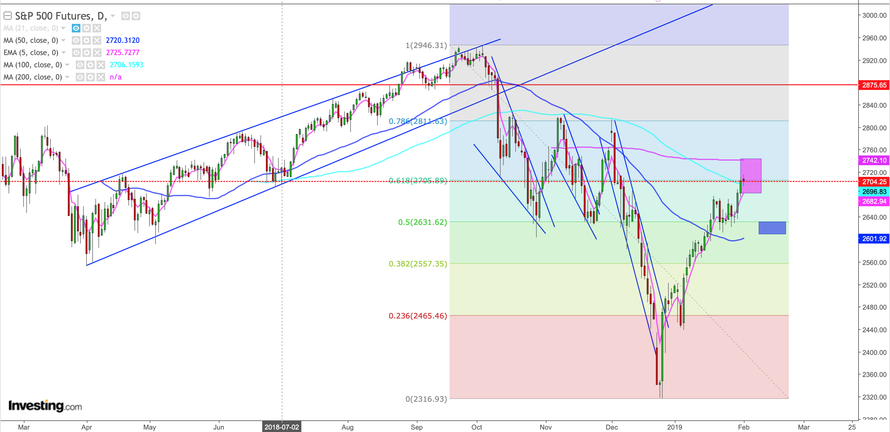
…and has approached a key resistance zone while becoming overbought following a historic script of aggressive counter rallies.
For the bear case to unfold sellers need to see index charts again fall below their 50MAs to begin with, a perhaps difficult task as the next round of artificial liquidity is just around the corner: Now that earnings are soon over buybacks are coming back. Ultimately these couldn’t save markets in Q4 2018, but then the Fed was raising rates and doing the ’50Bs’ dance.
Once a retrace unfolds the 2600 +/- zone around the 50MA will then likely prove a key battle for control:
Note the 50MA has now turned north for the first time since early October.
For now investors are hailing Chairman POW. And as long as fundamentals don’t matter the cheering will continue as long as future dips are bought. We’ll see how long the cheering lasts, especially as some other charts also suggest it’s too early to cheer.
* * *
For the latest public analysis please visit NorthmanTrader. To subscribe to our market products please visit Services.
via ZeroHedge News http://bit.ly/2WFu5aw Tyler Durden

