Authored by Sven Henrich via NorthmanTrader.com,
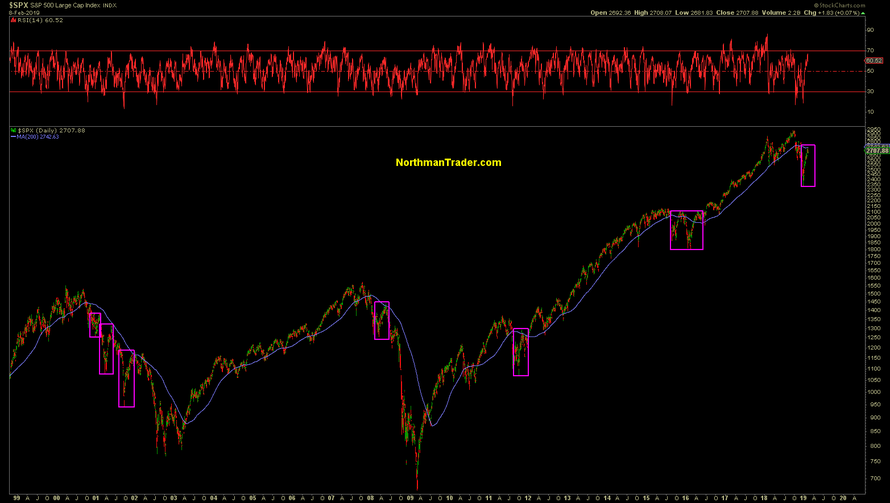
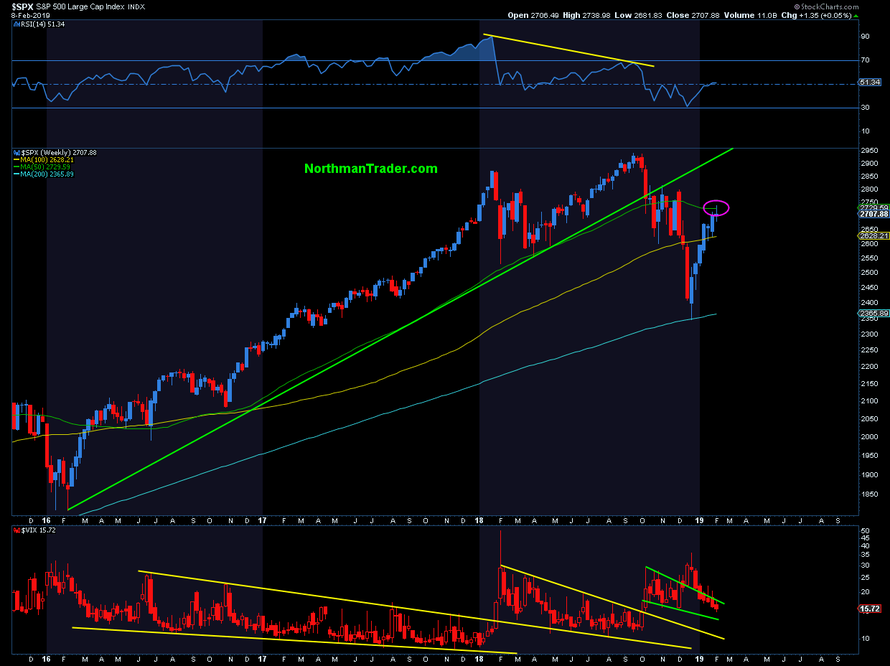
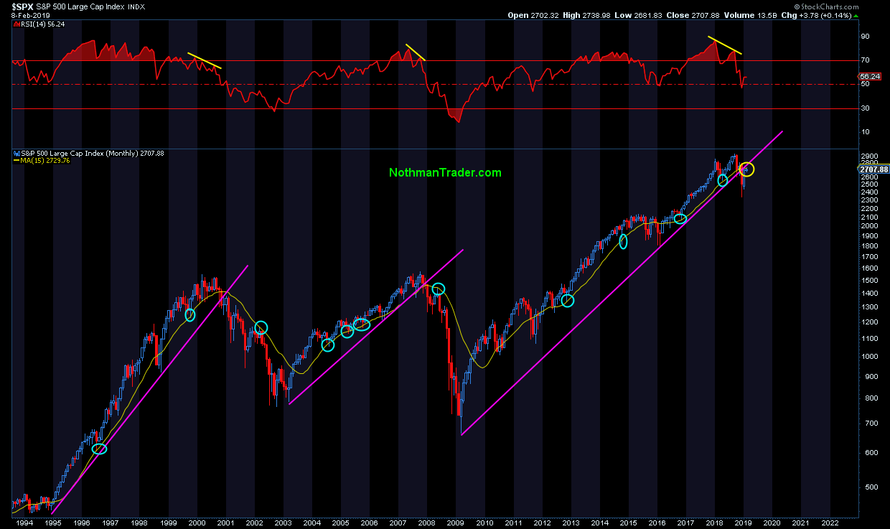
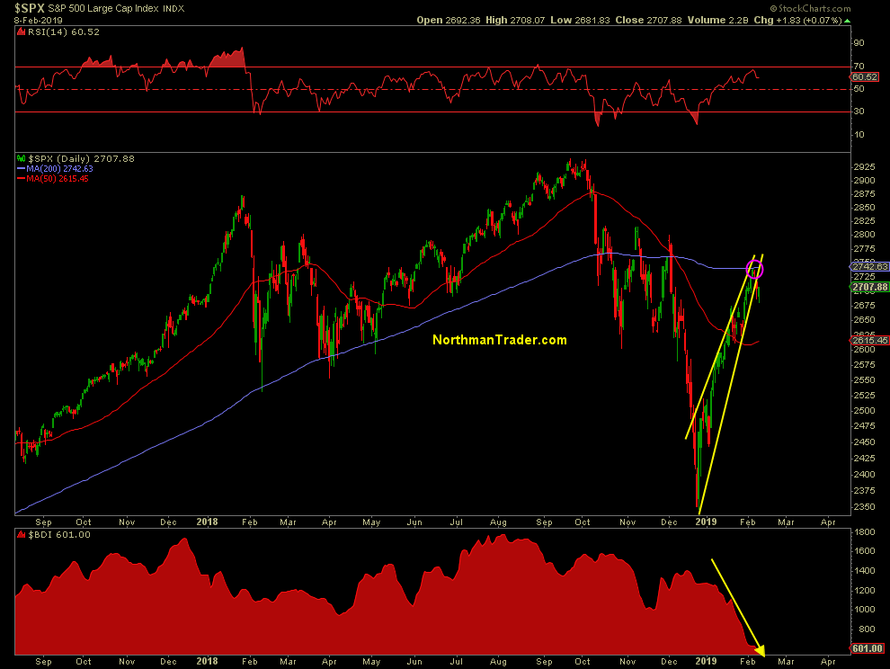
This week markets reached the key resistance confluence zone I’ve been outlining and rejected from there. Still $SPX managed to close the week positively by 1 handle making it the 7th consecutive week of uninterrupted gains. Whether this rejection is meaningful remains unproven at this stage. From my perch price discovery remains engaged in a battle for control between 2600 and 2730-2760 on $SPX. This aggressive rally has achieved what it was technically meant to: Reconnect with moving averages and achieve balance.
But for now it remains a rally below the 200 daily moving average:
It remains a rally below the weekly 50MA:
And it remains a rally below the monthly 15MA:
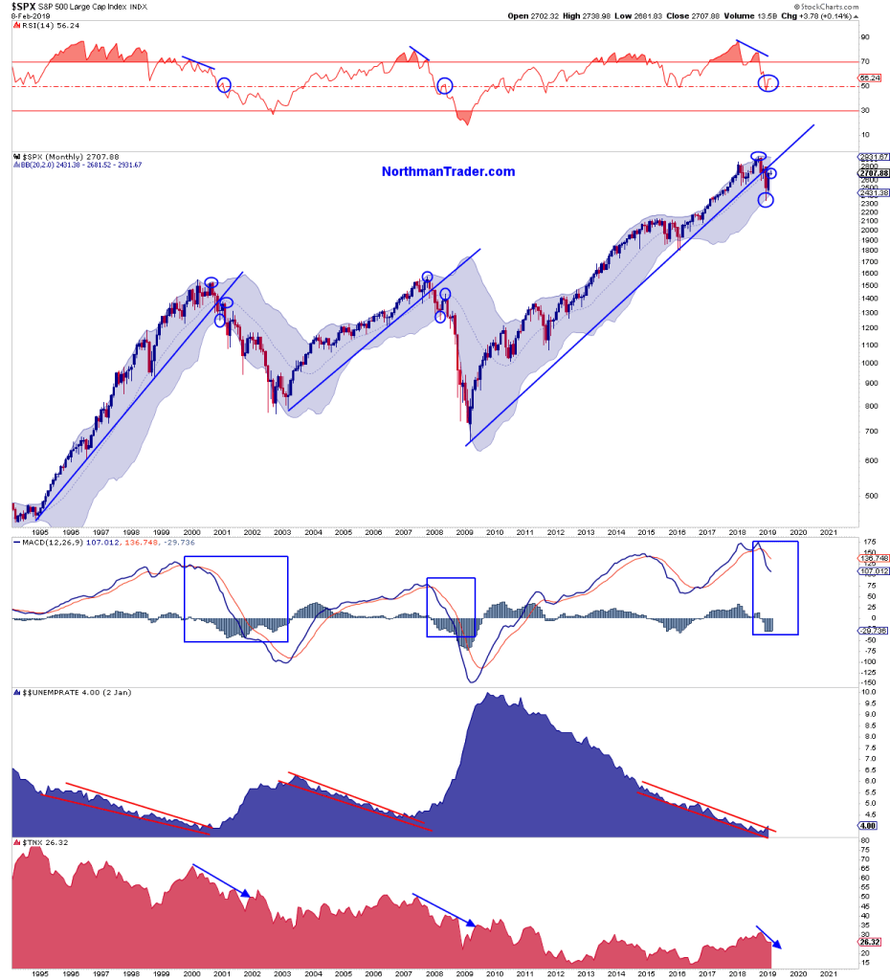
And hence the larger potential bull trap structure remains in play for now:
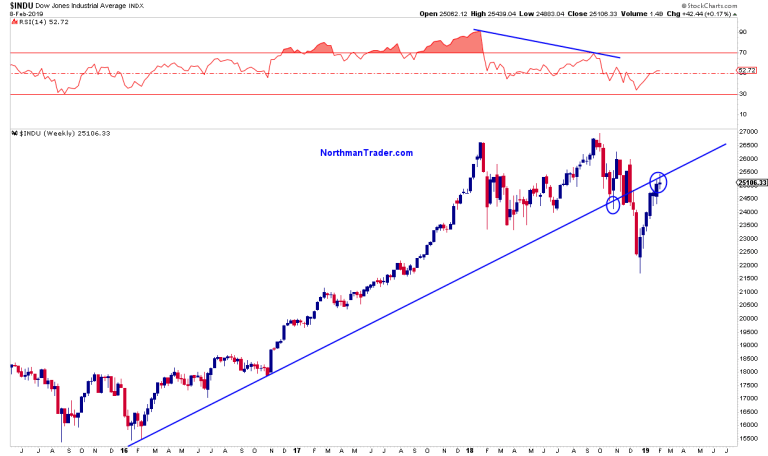
$DJIA failed to recapture its broken 2016 trend line:
Yet fact remains that ever since the big central bank capitulation of 2019 markets have not had a single down week. It’s almost magical.
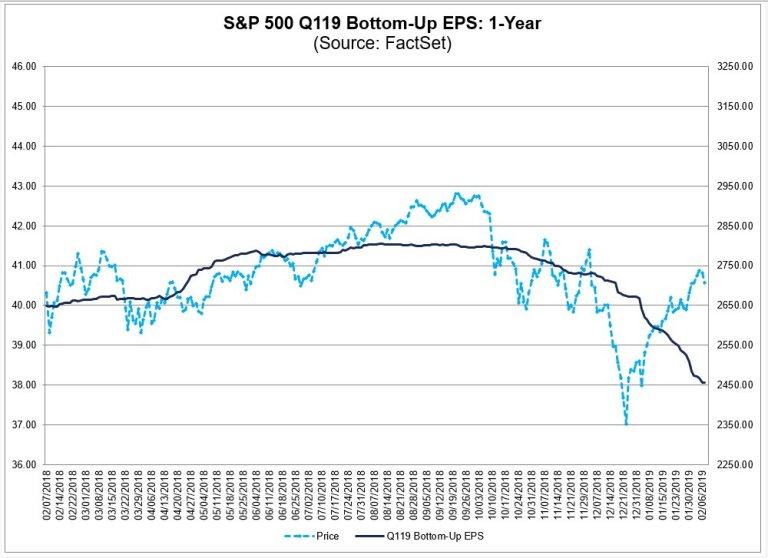
Indeed markets keep rising as earnings estimates keep coming down. Per Factset: “$SPX is projected to report a year-over-year decline (-1.7%) in earnings for Q119, with 7 of 11 sectors expected to report a decrease in earnings. $SPX EPS estimate for Q119 has declined by 4.8% over the past 12 months and by 5.4% since Dec. 31.”
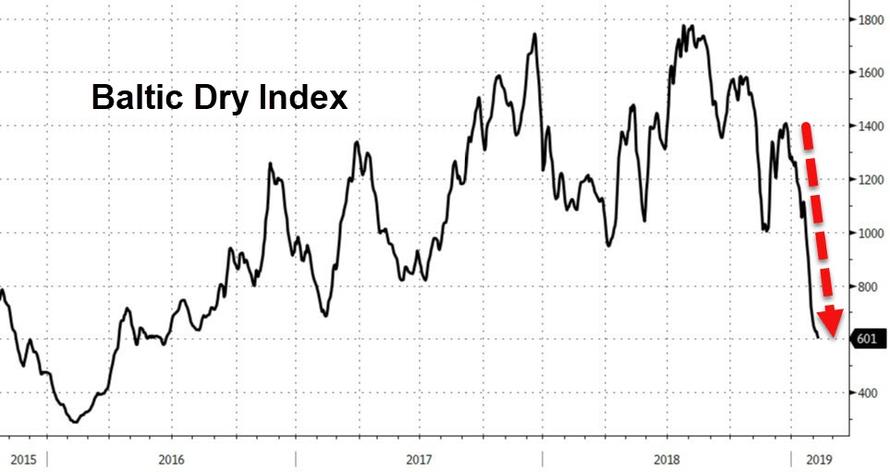
One could ascertain that as of now dovish central bank positioning is trumping fundamentals as also evidenced by the continued collapse in the Baltic Dry index:
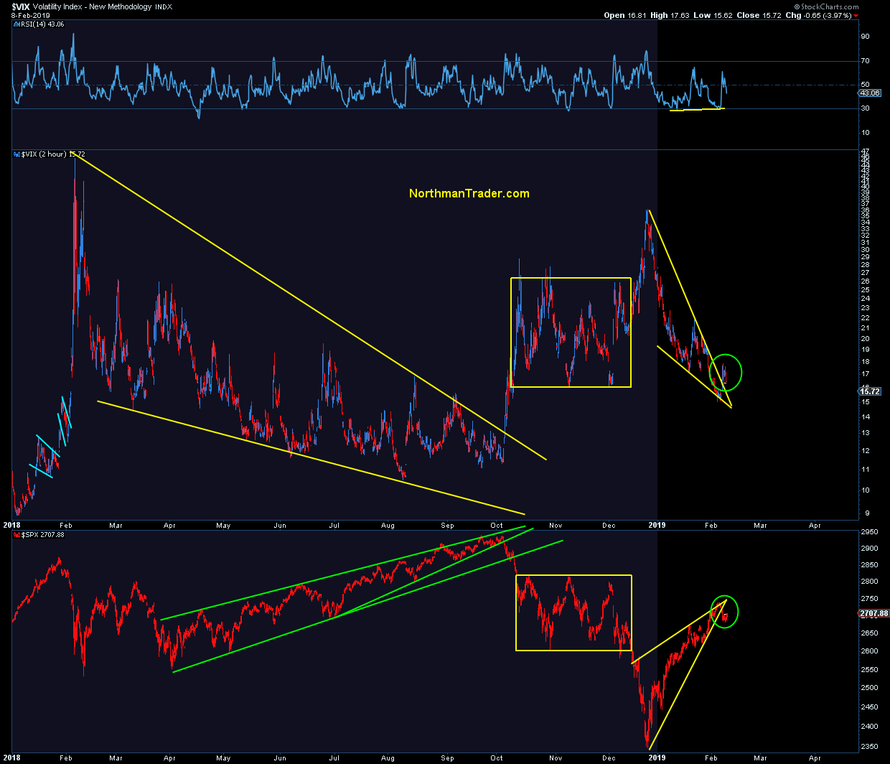
As $SPX has rejected the overhead resistance we can observe tight wedge patterns not only on indices…
…but also in volatility:
The rejection also came in context of short term heavy overbought readings on $NDX for example.
This was the chart I highlighted on twitter the other day:
$NDX components above their 50MA: Went from 3 to 93 in a matter of 6.5 weeks, the fastest move from extreme low to extreme high ever.
First 93 reading since 2014.
And yet $NDX remains below its 200MA for now.
Reminder: Nothing’s more vicious than bear market rallies. pic.twitter.com/HWAvwYCCxH— Sven Henrich (@NorthmanTrader) February 6, 2019
And here’s the updated chart and note $NDX’s record flip from oversold to overbought on this indicator rejected right at the 200MA:
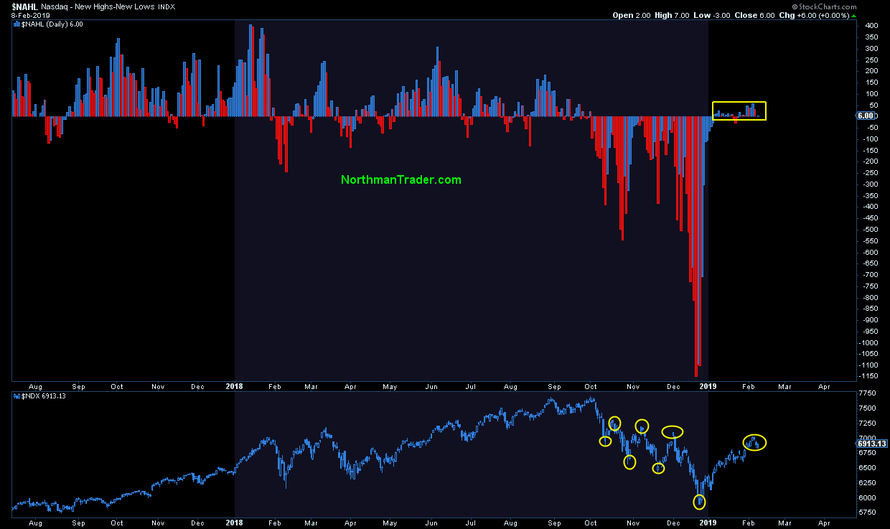
Continuing with $NDX we can observe that new highs/new lows have not managed to expand significantly and have reverted back to flat in context of an index still printing lower highs for now:
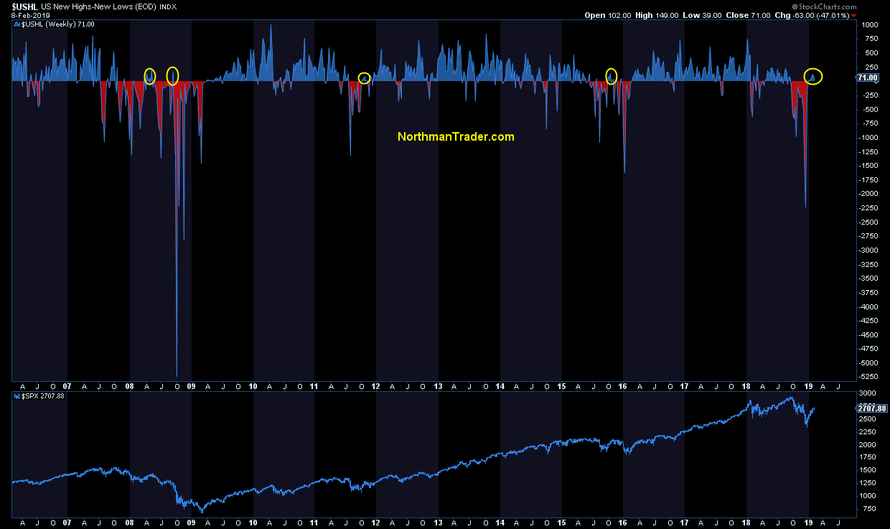
$USHL continues to show an emerging pattern commensurate with a potential retest of the December lows to come:
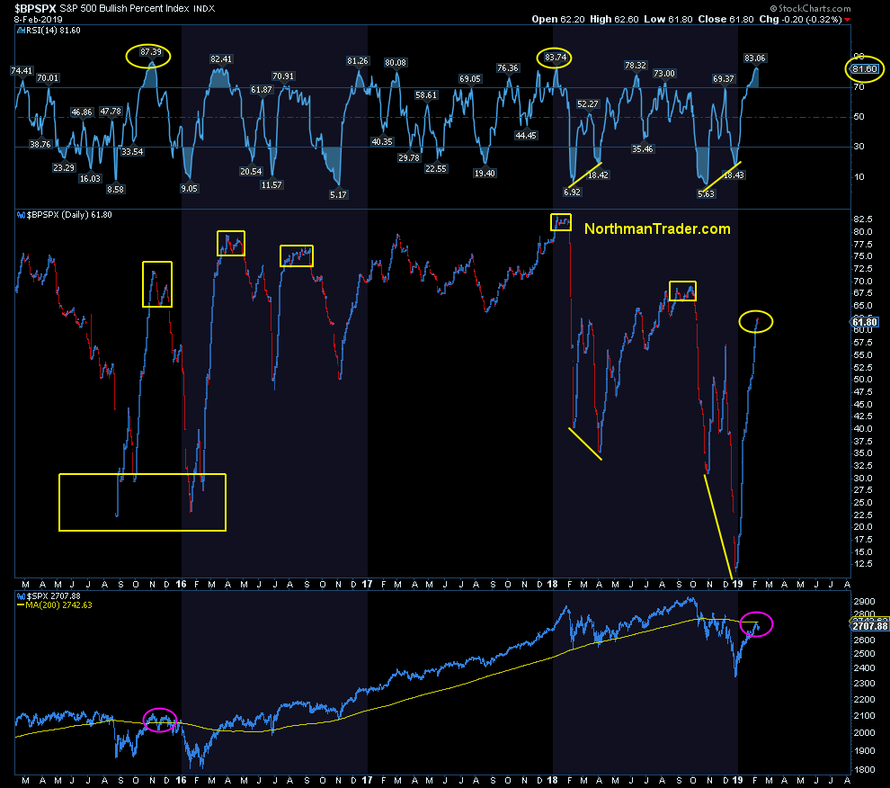
$BPSPX continues to show a short term overbought market:
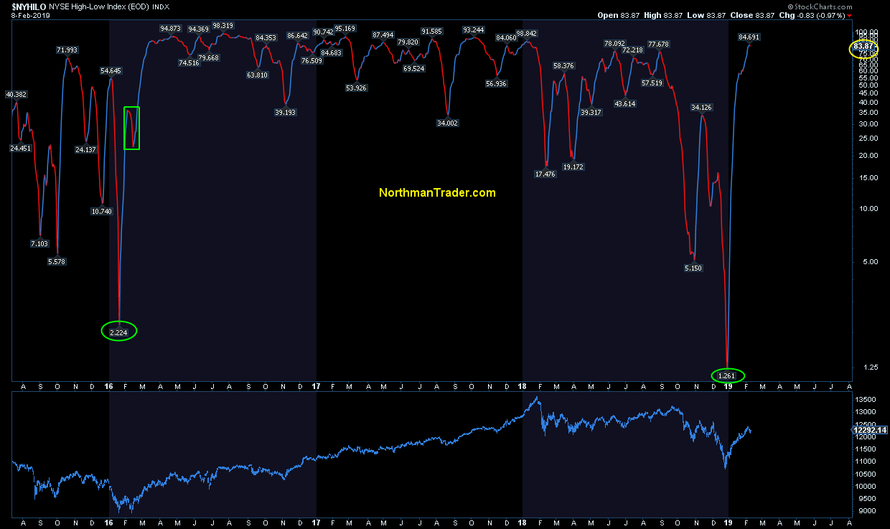
As does $NYHILO:
Yet despite last week’s rejection at resistance and short term overbought readings perhaps the most magical element of this rally has been the consistency with which one day of the week in particular has become bulletproof and predictable and that is Friday.
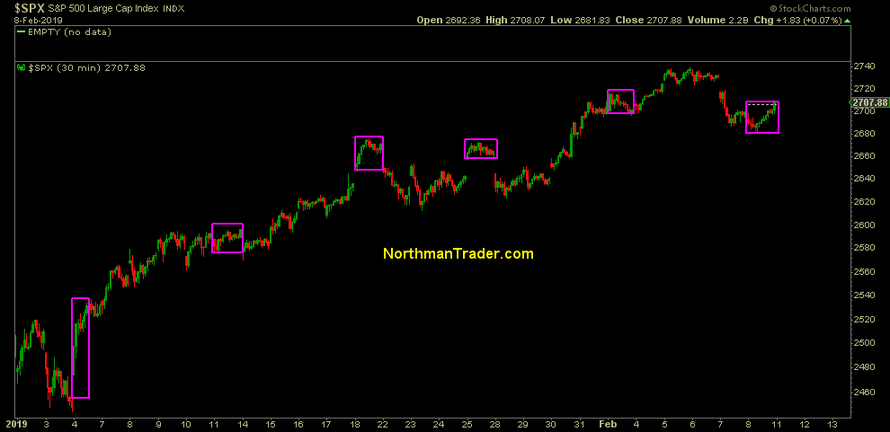
Every Friday in 2019 has been positive, the only exception being one Friday that closed down by a mere 0.5 handles, or virtually flat. There appears to be little risk perception by participants ahead of weekends:
Indeed so consistent is the market action one can virtually guarantee a magic show into the close:
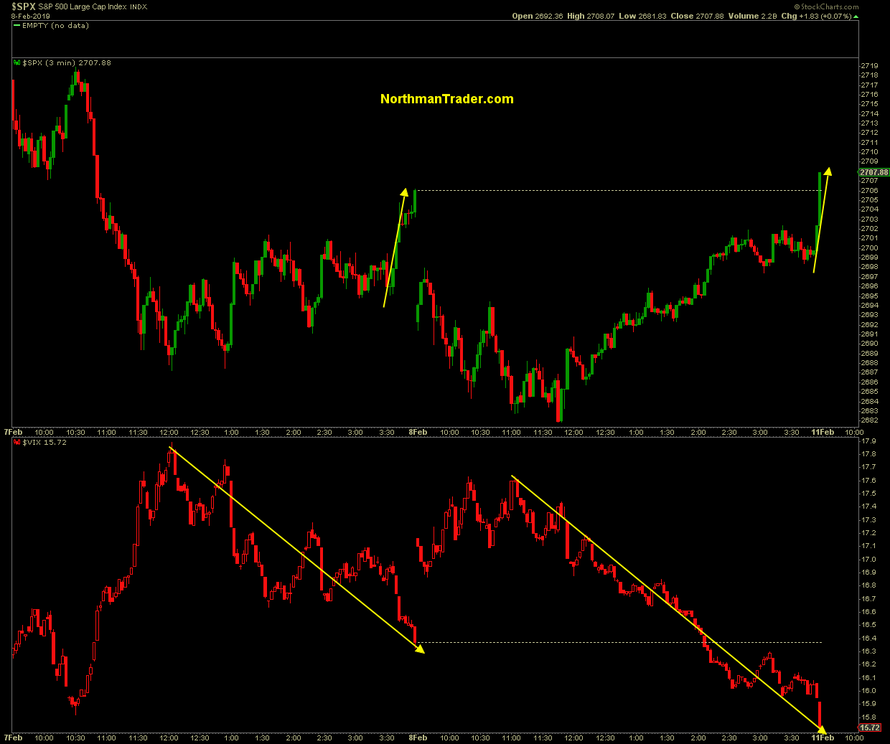
Sudden price spikes accompanied by a crushing of the $VIX. Why buy earlier at lower prices if you can rush in at the close and pay more?
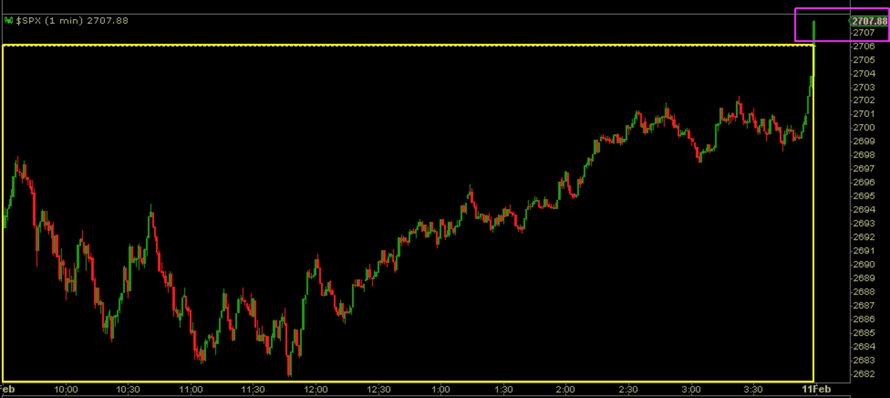
Last Friday’s price action being probably the most magical as $SPX remained in negative territory for 6 hours, 29 minutes and 55 seconds only to turn green on close:
This is why bears can’t have nice things when central bank jawboning drives price discovery.
Oh I kid the bears, but one could virtually hear the laughter and groaning by both bulls and bears at the timed absurdity of Friday’s close.
Reminiscent of the perpetual price ramps of the summer of 2018 markets remain on an upward price trajectory and downside remains limited and very much contained.
Yet emerging patterns remain concerning for bulls, not only the above mentioned historical structures and the highlighted wedge patterns, but also Mella’s weekly inverse $VIX pattern pointing to 50+ suggest building risk in a market that is currently ignoring fundamentals.
For next week bulls have the opportunity to ramp markets anew for OPEX week as these weeks tend to be more favorable than not. The goal would have to be to take another run at the 200MA and above, yet any new highs here would come on negative divergences and even more overbought readings.
As the rally is so extended bulls might rather benefit from a retrace toward the 2600 zone to alleviate overbought conditions. A break below 2600 and bulls may be in major trouble as the historical structures outlined above will become a lot more convincing in a hurry.
We remain very early into the year with a lot of uncertainties going forward on the macro economic, political and technical front. Bulls are banking on a dovish Fed to keep the rally supported, the retest and bearish scenarios also remain viable possibilities as long as buyers can’t confirm a break above the 200MA, the weekly 50MA and the monthly 15MA.
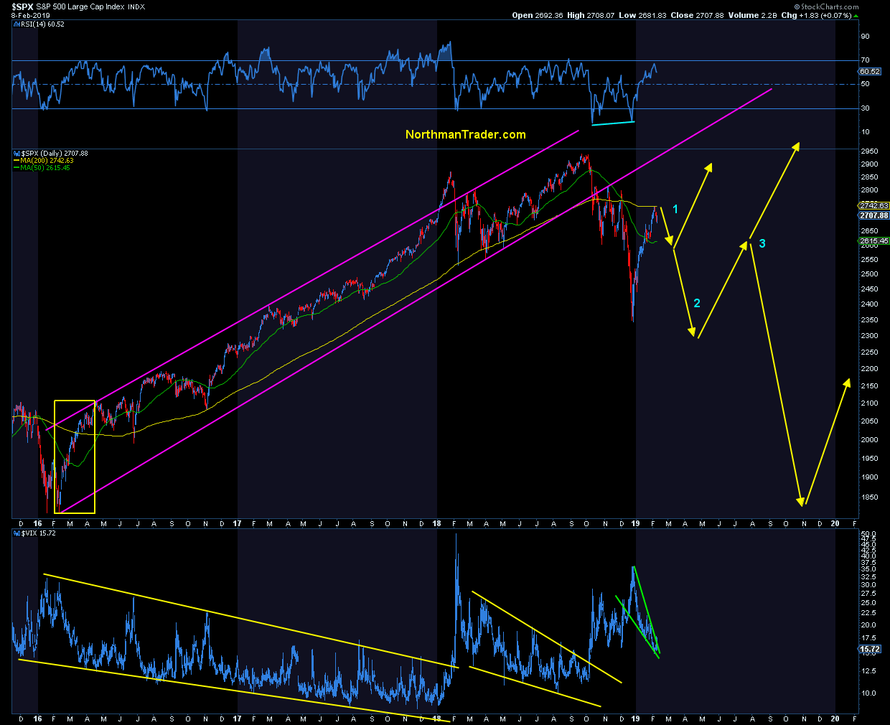
Hence, as of this moment, one can envision multiple scenarios on how the rest of year could play out and I’m giving you a completely speculative roadmap here:
I don’t pretend to be an oracle, but it’s my view that any of these 3 key scenarios have potential validity depending on how the macro, political and technical developments unfold. And hence, from my perch, it is no time to be dogmatic, but rather a time to be open minded.
I can hear the twitter trolls now: Hey look Northy says anything’s possible. Laugh away, but it is my assessment at this particular juncture of uncertainty and I tell you why:
-
Scenario 1 basically suggests that bulls will remain in control and dips will remain a buy as perhaps a China deal resolves positively into spring and summer with buybacks remaining a key source of liquidity as the Fed remains easy.
-
Scenario 2 envisions a retest either for a higher low or lower low on a break down below the 50MA (for example on a failure of a China deal or further deteriorating fundamentals, or a political event). This retest would then be an initial buy similar to 2008. The resulting bounce would lead to a key decision point scenario 3.
-
Scenario 3 would either price in a recession in 2020 or presume that a recession can be avoided and economic data starts to show improvement. It is the bearish resolution of scenario 3 that would be consistent with the $VIX 50+ scenario and basically risk a retrace back to the 2016 lows confirming a major market top having been made in 2018.
In terms of handicapping these scenarios I think it’s fair to say that most of Wall Street is in the camp of scenario 1, those on Wall Street that were in the scenario 2 camp have been dwindling as the rally has progressed more aggressively than they expected, and hardly anyone expects scenario 3.
We shall see.
All I can observe is that the narratives for the bull case have shifted dramatically in the past 12 months. In 2018 it was a narrative of a globalized synchronized growth story and record earnings that led strategists to call for $SPX 3000-3200 targets for EOY 2018. As the year closed at 2506 instead the narrative shifted to the standard call for help: As the global synchronized global growth story has morphed into a global synchronized slowdown it is again a cry for dovish central banks to save the day, proving again that participants remain entirely dependent on running to their central bank daddies for help every time they get in trouble.
No new highs without dovish central banks and easy money. 10 years after the financial crisis this remains the primary price discovery dynamic. In my humble opinion this does not speak well for the underlying pinnings of either economies or markets. But for now the magic act has once again lifted asset prices from the abyss.
* * *
For the latest public analysis please visit NorthmanTrader. To subscribe to our market products please visit Services.
via ZeroHedge News http://bit.ly/2thxi2C Tyler Durden

