Authored by Sven Henrich via NorthmanTrader.com,
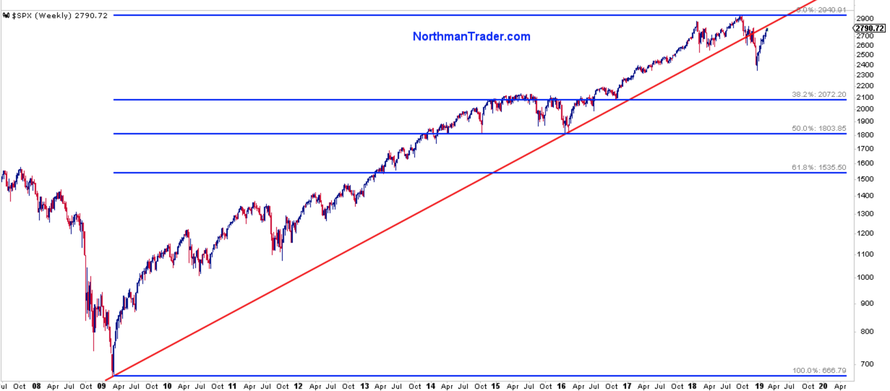
As the one way market squeeze continues relentlessly for its 9th week in a row there’s a thin red line everybody is watching, or at least should be watching. Well, maybe nobody is watching it, but I am.
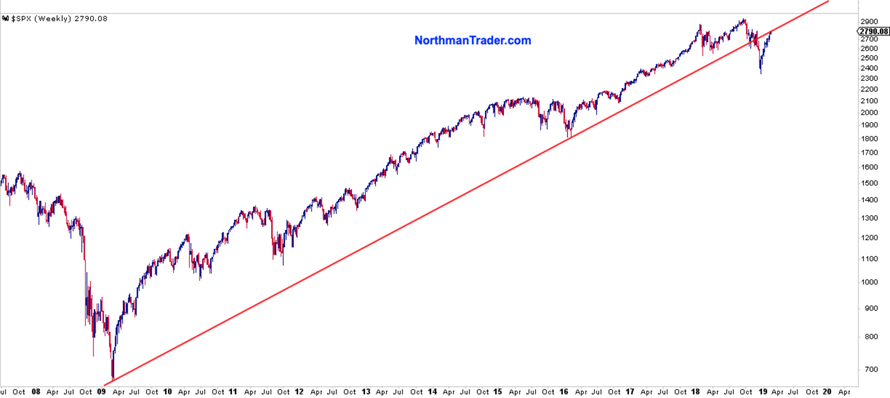
Trend lines are very important to these markets and I’ve talked about them at length before. On a log basis markets broke their 2009 bull market trend in December. What this rally has done now is approach this broken trend line. As I’ve mentioned on numerous occasions trend lines can be critical in identifying major resistance and support as they can be incredibly relevant to markets.
But trend lines can also be overshot to the upside or downside on a temporary basis, only to then revert below or above them. We’ve seen this before on numerous occasions as well.
But when a market breaks its long standing trend it’s usually very meaningful.
This happened in December, and what was support was broken. Theoretically that now means that what was support is now resistance and here we are:
It’s pretty impressive actually considering how fast and uncorrected this market has moved since the December lows.
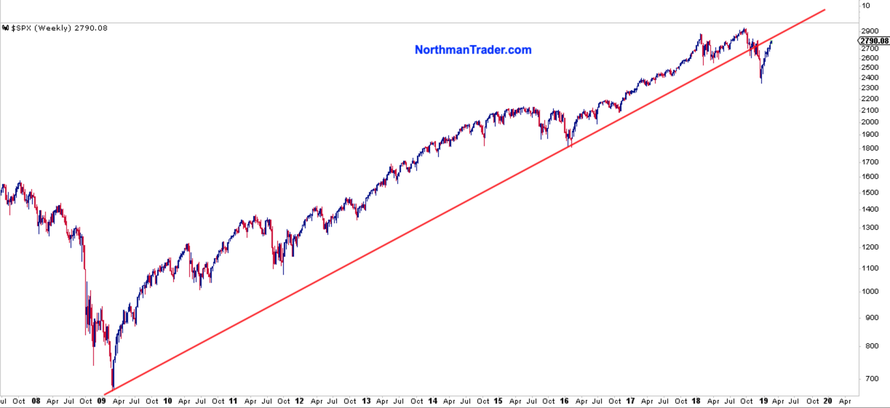
Now to be fair, I can also adjust this trend line slightly to the first low in 2016 and one can see that $SPX has a bit more room to move higher on this version:
Markets will ultimately reveal which version they will find relevant.
For bulls the danger here remains that this rally was an extremely aggressive counter rally in context of a broken bull market trend.
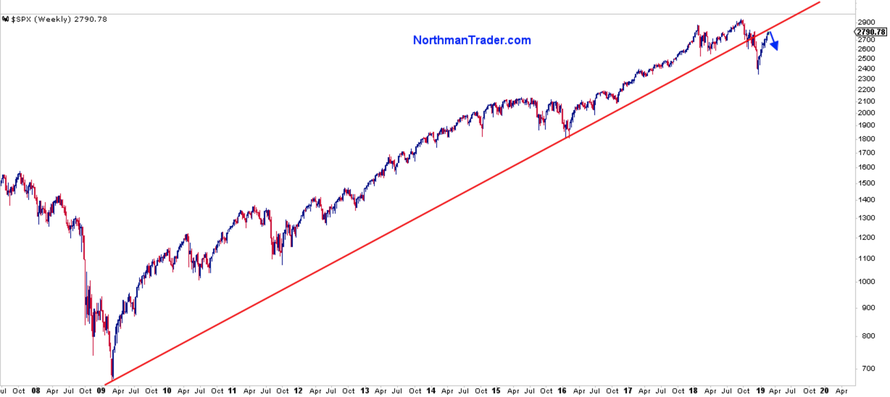
For a reversal in the near future could quickly change the perspective of this rally:
Why? Because a reversal in the near term could confirm that the bull market trend is indeed broken, in which case the technical picture suggests that the December correction was just the first step.
Remember, technically speaking, a break of the bull market trend in earnest suggests a much larger long term fib retrace risk:
That’s the recession scenario everyone seems to be keen on denying being a possibility.
As of this juncture this is all speculative, but $SPX is approaching this potentially key thin red line and everyone should be watching it. If bulls can jump above it and defend it, then that’s bullish. Failing to do so, risks a confirmation of a broken bull market trend.
* * *
For the latest public analysis please visit NorthmanTrader. To subscribe to our market products please visit Services.
via ZeroHedge News https://ift.tt/2tBbyyT Tyler Durden
