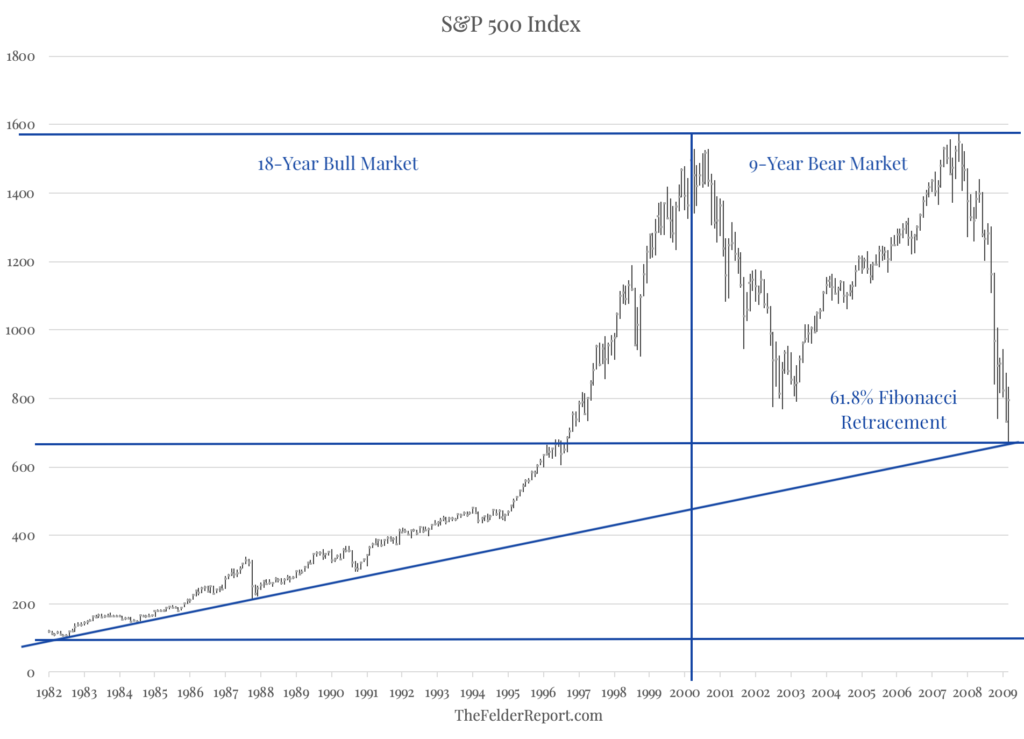
Back in March of 2009, within days of the bear market low, I shared a chart that highlighted a very interesting long-term Fibonacci support level.
That chart is recreated below and it shows that the S&P 500 bottomed almost exactly at the 61.8% Fibonacci retracement of the bull market gains that began in 1982.
Obviously, this proved to be a very durable low as stocks went on to gain more than 300% over the following decade.
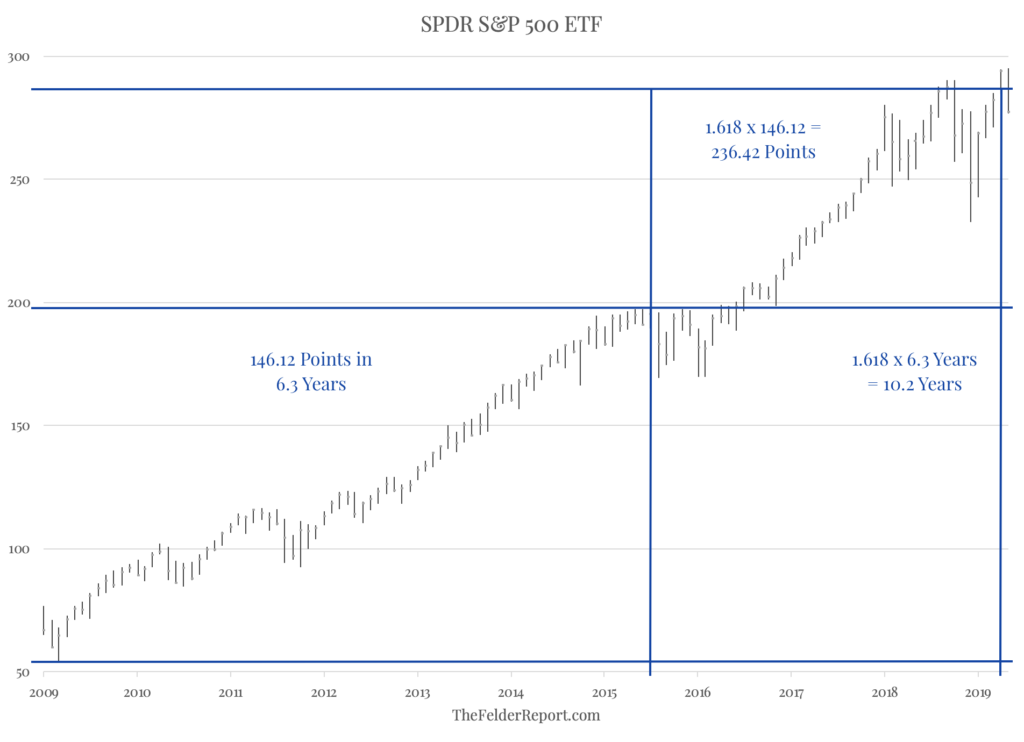
Just over a year ago I shared another chart that highlighted yet another long-term Fibonacci level that could prove to be equally important.
Below is an updated version of that chart and it shows the S&P 500 SPDR ETF struggling to overcome the 1.618 Fibonacci price extension of its gains from 2009-2015. I have also added the 1.618 Fibonacci time extension, as well, which comes into play right about now.
Just as that earlier Fibonacci level marked an important turning point for the broad equity market, this current one could do so, as well.
Time will tell.
via ZeroHedge News http://bit.ly/2MtjheW Tyler Durden


