Will The S&P Close 2020 At 3,400 Or 2,600? According To Goldman, It Depends On One Thing
As we briefly touched on last week, when it comes to Goldman’s market forecast for 2020, the bank is rather sanguine, stating that “slightly better growth, limited recession risk, and friendly monetary policy” should lead to a decent, but not stellar, background for financial markets in the early part of 2020. However, concerns about the impact of higher corporate taxes on profits could rise in the runup to the US presidential election, the bank added.
Overnight, in his 2020 US Equity Outlook, Goldman’s chief US equity strategist David Kostin shared some other key considerations how he sees the way forward in the equity market, as well as his year end forecast, which for the first time bifurcates into two explicit targets, depending on key variable.
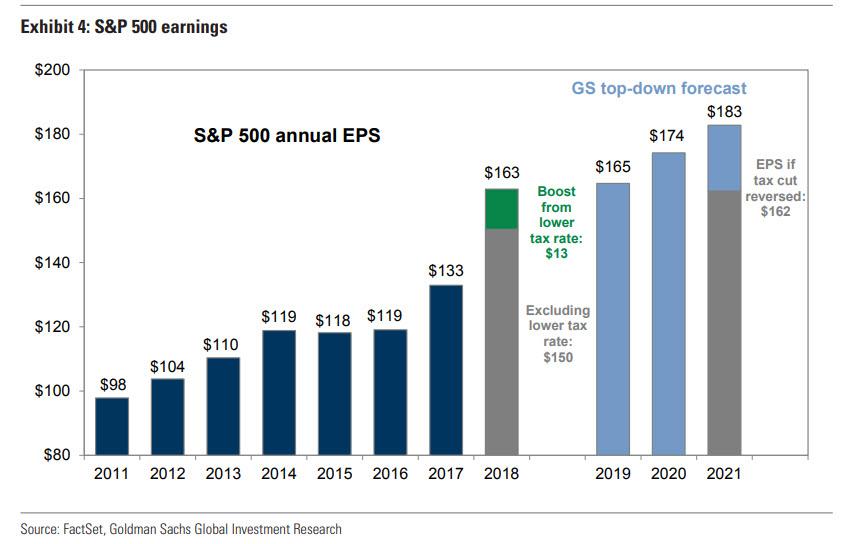
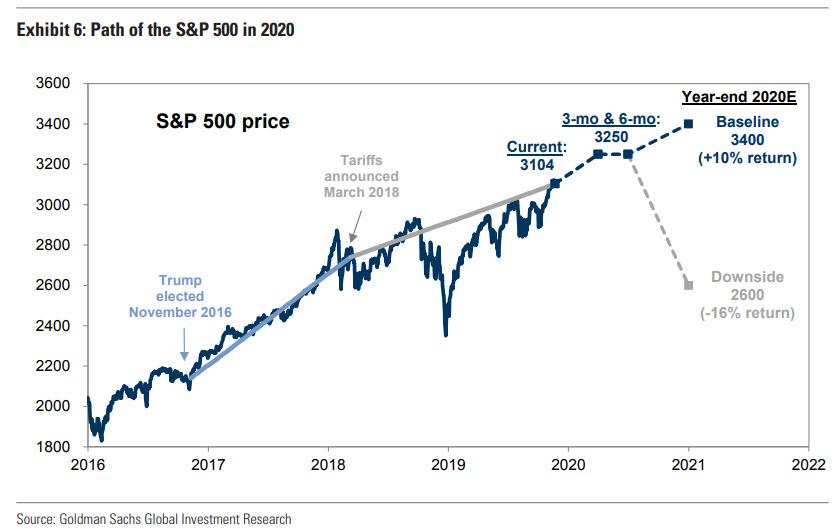
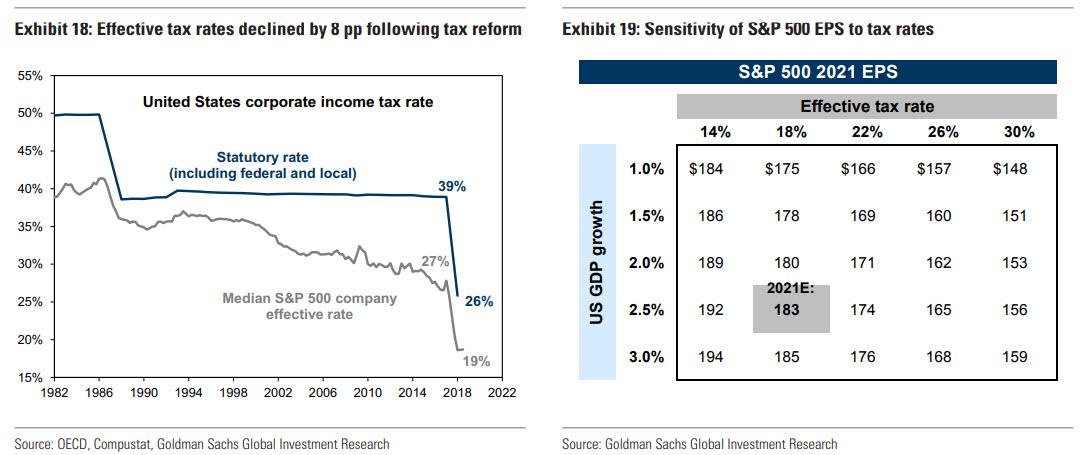
Curiously, Kostin’s forecast bifurcates not only from an “event-risk” standpoint, but also chronologically and as the strategist writes, the “durable profit cycle and continued economic expansion” will lift the S&P 500 by 5% to 3250 in the early part of 2020. However, the rising political and policy uncertainty will keep the index range-bound for most of next year. “Goldman also reveals the bank’s baseline forecast for 2020, which he expects to rise by 6% to $174 in 2020 and by 5% to $183 in 2021. Yet here too Goldman reveals that things may change depending on whether or not Trump’s tax cut is reversed – in which case the bank’s baseline 2021 EPS estimate of $183 would be reduced by 11% to $162. Assuming the bill is applied retroactively to the start of the year, S&P 500 earnings growth in 2021 would equal -7%, compared with the baseline estimate of +5%.
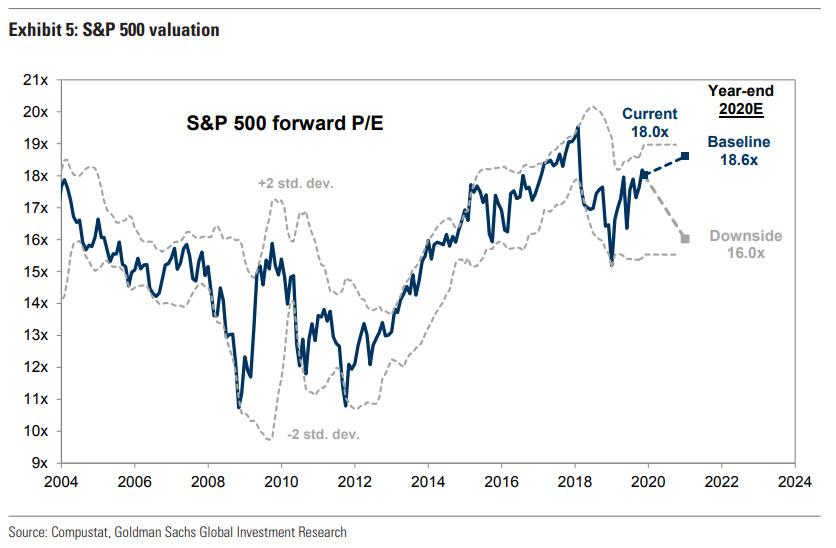
Yet while there is uncertainty in the underlying EPS number, Goldman is even more cautious when predicting what the applicable multiple is that one must apply to this EPS number. All else equal, Goldman’s base case valuation forecast assumes the S&P 500 forward P/E “hovers around the current level of 18.0x for most of next year before rising to 18.6x following the election as uncertainty falls.” Furthermore, while historically valuations have moved sideways during the lead-up to presidential elections, they then move higher following Election Day.
However, this time the risk exists of a sharp multiple re-rating lower as the election result will affect equity valuations through changes in policy uncertainty and consumer confidence. here, Goldman uses its macro model of the yield gap between the S&P 500 earnings yield and 10-year US Treasury yield to estimate the impact of uncertainty and confidence on equity valuations. And while the bank’s baseline forecast assumes that following the election the S&P 500 forward P/E multiple expands slightly to 18.6x, if US policy uncertainty post-election rises rather than falls – read if a Democrat wins the election – or consumer sentiment declines, the equity risk premium would increase and the P/E multiple would compress by approximately 2 points to 16x.
What does this mean from a simple price perspective? Well, one can multiple one by the other and get the answer.
For those who can’t, Goldman writes that the election outcome “could magnify risks or the economic growth outlook could deteriorate”, by which it means Trump may not be re-elected. But more importantly should Democrats also regain sole control over Congress, “a unified federal government post-election could prompt investors to assume the tax cut is reversed and lower projected 2020 EPS to $162 (-7% year/year growth), compressing the P/E multiple to 16x consistent with an index level of 2600.“
And while Goldman’s price target “range” is indeed quite broad, the bank’s confusion appears to be prevalent because as Kostin notes, as investors consider the outcome of the election, the distribution of S&P 500 levels implied by the options market at year-end is wide: “The options market currently implies a 22% probability the S&P 500 ends next year above 3400 and a 28% probability the index ends 2020 below 2600.“
In other words, much like the Fed, Goldman appears to have taken its price target based on what the market is already discounting.
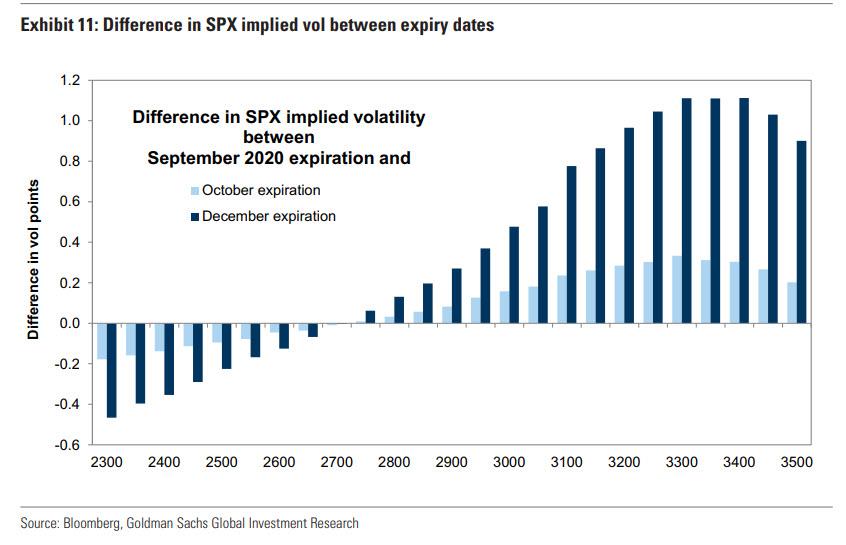
Here, Kostin points out something we noted last week when analyzing the latest report by Goldman’s derivatives strategist Rocky Fishman, according to whom the options market was indicating “different distributions of risk before and after Election Day.” Skew is higher for the September and October 2020 maturities than for the November and December 2020 maturities. This can be seen from the spike in upside implied volatility from October to December and little gap in downside implied volatility.
“This likely reflects investors positioning for a post-election relief rally once November uncertainty has been resolved.” Unless of course, the outcome is the worse case one that sees Trump tax cuts eliminated and the S&P tumbling by 16% from the bank’s mid-2020 target of 3,250.
Which brings us to the key issue at the heart of Goldman’s schizophrenic forecast: whether government will be united or divided. This is how Kostin frames it:
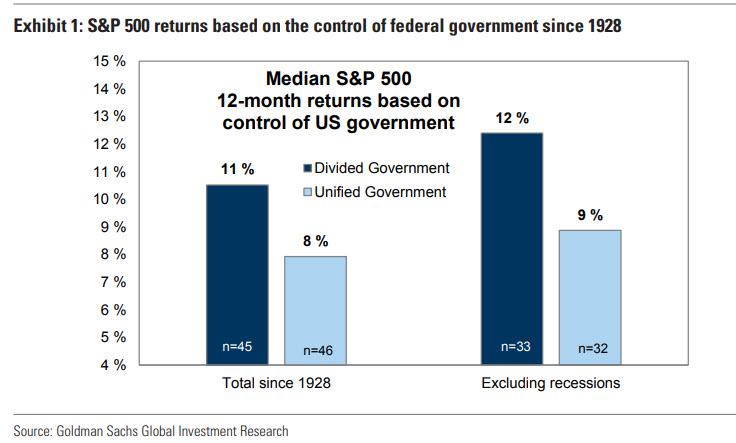
Maxims in politics such as “United we stand, divided we fall” do not necessarily hold in investing. In the United States, equity returns during periods of divided federal government have typically exceeded returns achieved when one political party controls the White House, Senate, and House of Representatives. Since 1928, excluding recessions, when the federal government was controlled by a single party, the S&P 500 median 12-month return equaled 9%. However, the median return under a divided government was 12%. Prediction markets currently suggest the most probable 2020 election outcome is a divided government.
The title of our 2020 US equity outlook, “United we fall, Divided we rise,” acknowledges the importance of an election that is slightly less than one year away. During the next 11 months, shifting electoral prospects of candidates will be reflected in real-time prediction markets and sector and stock performance. During the subsequent two months, S&P 500 performance will depend on the actual election outcome.
When the election result has been a divided government, during presidential election years since 1928 the S&P 500 median return between the start of the year and Election Day has equaled 11% compared with a 4% return under a unified government election outcome. Obviously, this analysis assumes perfect foresight so it has limited usefulness as a forecasting tool.
As Kostin further adds, “investors focused on equity market implications of policies discussed on the campaign trail need to take into account the probability that these outcomes will be realized.” What this means is that a candidate would need to win the presidency, have the support of both chambers of Congress, and actually pass legislation.
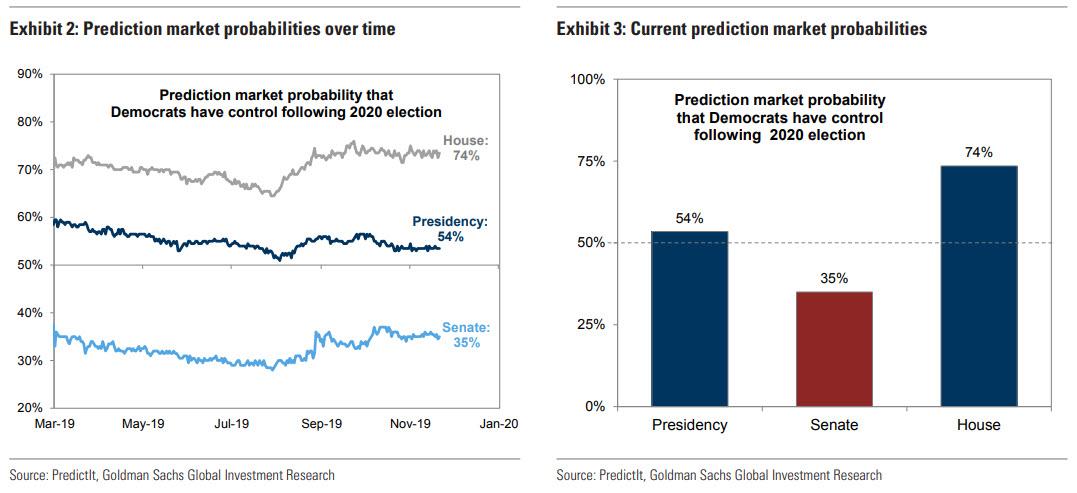
Indicatively, online prediction markets such as PredictIt- which are notoriously illiquid and can be easily gamed with one modestly sized wager – currently assign a 74% probability that Democrats control the House, a 54% likelihood that they win the presidency, but only a 35% probability that they control the Senate.
And if the composition of US government is the dependent variable, the emerging two key risks to Goldman’s baseline forecast are tax rates and tariffs. Kostin explains:
The S&P 500 YTD effective tax rate has equaled 19%, well below consensus expectations for 21%. Analyst estimates currently imply a 21% tax rate in 4Q and in 2020. If the 2019 YTD pattern continues, it could mitigate likely negative revisions to consensus EPS estimates. However, several presidential candidates have proposed raising corporate tax rates, and we estimate every 1 pp change in the effective tax rate would lead to a roughly 1% change in S&P 500 EPS. Our model suggests a complete reversal of the tax cut would translate into 2021 EPS of $162 rather than our current estimate of $183. The impact of tariffs on profits remains highly uncertain. Recent reports suggest that pending tariffs may be delayed or rolled back. Currently, tariffs have been levied on roughly $370 billion of imports from China.
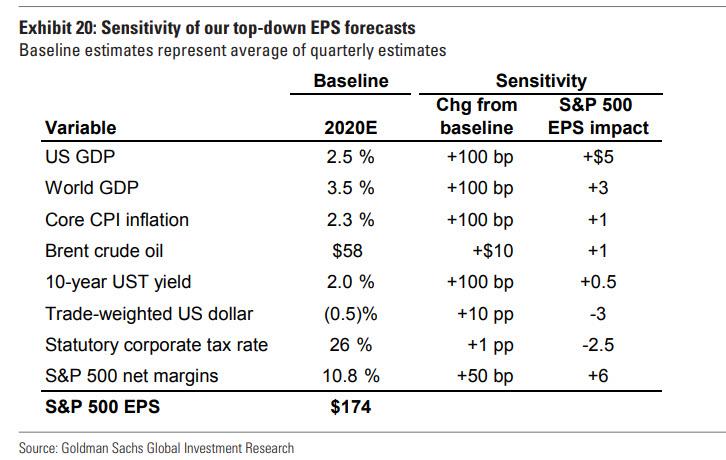
There are also a bunch of secondary variables, or macro drivers, which will be less dependent on the election outcome yet which will directly shape the path of the S&P 500: for example, higher interest rates and oil prices provide a boost to Financials and Energy EPS, respectively, but weigh on the profitability of companies outside of these sectors. Higher inflation boosts nominal sales growth but pressure margins, resulting in a modest impact on EPS.
There is one final, and far more intangible driver for next year’s returns: TINA, or whether investors will undergo what JPMorgan dubbed over the weekend a “Great Rotation” out of bonds and into stocks:
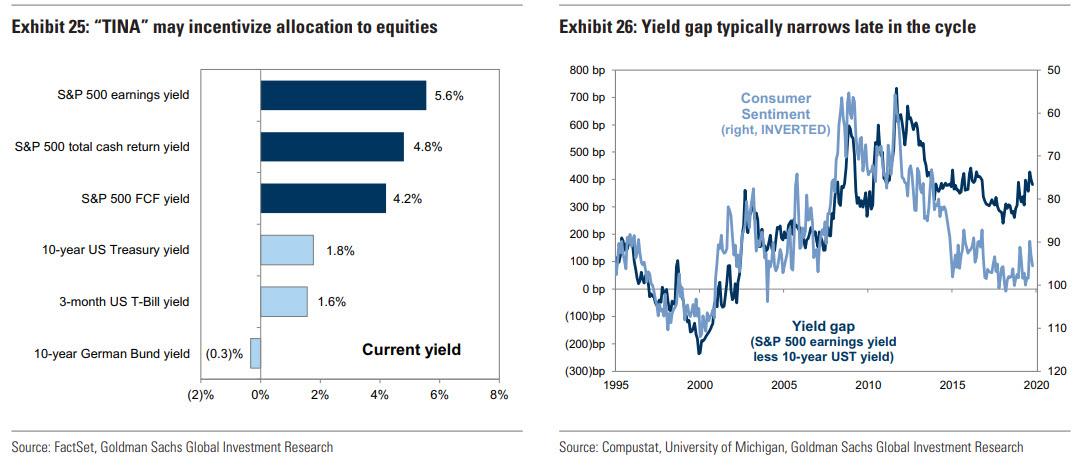
Equities generally appear attractively valued relative to the limited opportunity set in other asset classes. Bond yields remain extremely low across the world and our economists expect little change in global central banks’ monetary policies in 2020. Currently, 20% of global bonds trade with negative yields. Across asset classes, yields on the S&P 500 are comparatively attractive relative to cash (1.6% yield) and 10-year bond yields in the US and Germany (1.8% and -0.3%, respectively). Meanwhile, the S&P 500 offers a 4.2% FCF yield, a 4.8% total cash return yield, and a 5.6% earnings yield (see Exhibit 25). A rise in equity valuations would also be consistent with the past late-cycle environments; historically, the equity risk premium shrinks and valuations rise as the economic cycle matures (see Exhibit 26).
To summarize Goldman’s multi-modal model, no pun intended, the bank expects that as we approach the 2020 election, clarification of policy will expand the P/E multiple to 18.6x and – assuming a divided government – push the index to 3400 by year-end 2020. However, should the US end up with a unified government after the election, it will likely result in lowering 2021 EPS to $162 and compress P/Es to 16x, “resulting in the index closing next year at 2600.”
Here, Goldman lays out several other known unknowns which may derail its projection, among which further deterioration in US-China trade and tariffs, illiquidity, rising corporate leverage, reduced company buybacks, index concentration, antitrust investigations, and global economic growth. But the biggest risk of all is that this is a forecast coming from Goldman, whose forecasts in recent years have become the butt of jokes in less than polite financial company, of which one stands out above all: almost exactly a year ago, Goldman was predicting that the Fed would hike rates 4 times in 2019. Instead, the Fed not only did not hike even once, but it ended up cutting three times AND launched NOT QE. So anyone who traded based on Goldman’s 2018 forecast was crushed, and depending on leverage, may have lost all their money.
And with Goldman admitting that the outcome of its 2020 forecast is the functional equivalent to a cointoss, we urge only those professional gamblers investors who are ok with the S&P closing at either 3,400 or 2,600, a whopping 800 point delta, to do take the other side of Goldman’s prop trading desk, and trade based on the above forecasts.
Tyler Durden
Mon, 11/25/2019 – 17:25
via ZeroHedge News https://ift.tt/2OhGcIS Tyler Durden
