Why 3,254 Is The Only Number That Matters For Traders Today
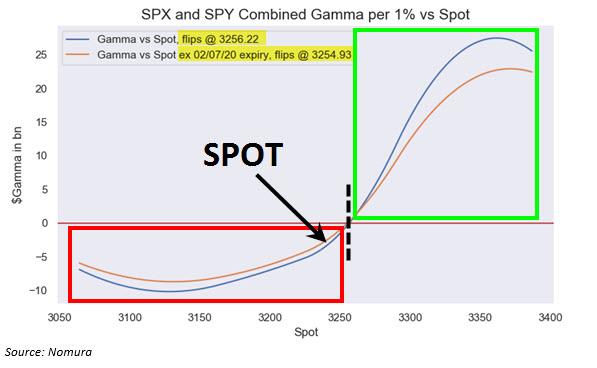
When commenting on the crash in Chinese stocks late on Sunday night, we pointed out that US equity futures had managed to buck the liquidation trend seen across Asia, rebounding from Friday’s rout lows, rising into the mid-3200s, a level which was critical because as we had pointed out previously on Friday, this is roughly where the critical gamma “flip” level was, below which gamma transforms from a risk dampener into a risk accelerator.
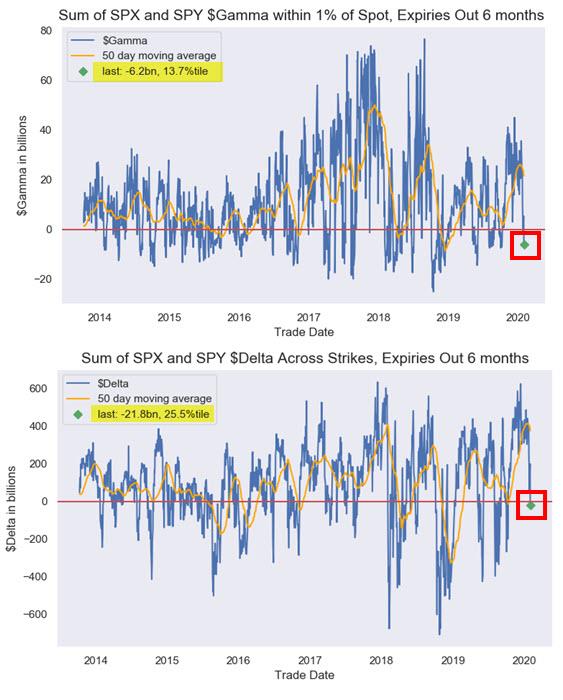
On Monday morning, Nomura’s cross-asset strategist and quant, Charlie McElligott, picked up on this key point again, one which he has been covering for years, and writing that indeed, should stocks fail to rebound from their Friday open, it could get messy as consolidated option positioning shows both dealer gamma and delta is now negative…
… with dealer now back in a short gamma position for the first time since the start of the October meltup. In fact, it now appears that the gamma “flip” level is 3,254, which explains why market makers who hope to preserve the bullish benefits of positive gamma are fighting so hard to keep the S&P at this level. Not surprisingly, at last check, the S&P was trading right on top of this level.
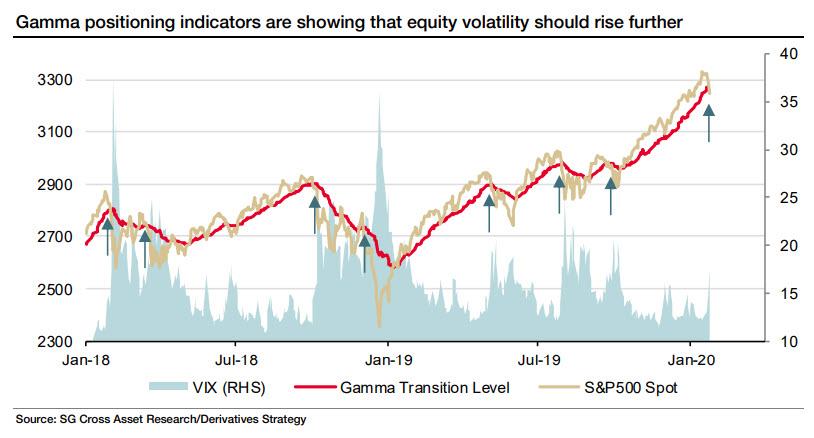
For those confused, here is a quick refresher: gamma-linked indicators are designed to estimate whether hedging by market makers is currently suppressing or elevating volatility. Positive gamma leads to dampening of index moves because the hedgers need to sell when the market moves up and vice versa. Negative gamma leads to hedgers exacerbating volatility as they sell when the market moves down and buy when it goes up. The chart below from SocGen shows that the S&P500 spot moving into negative gamma territory (below the red line) is consistent with higher levels of VIX, which in turn leads to further selling in the S&P, a greater disconnect from gamma, and even higher volatility, and so on, in a feedback loop.
Like Nomura’s McElligott, SocGen’s derivatives strategy team estimated last week that aggregate dealer gamma had briefly moved into negative territory on the S&P500, and remains close to it, a byproduct of the notorious “gamma gravity” effect whereby gamma flip levels tend to serve as “strange attractors” for the broader market, something we have discussed since 2018.
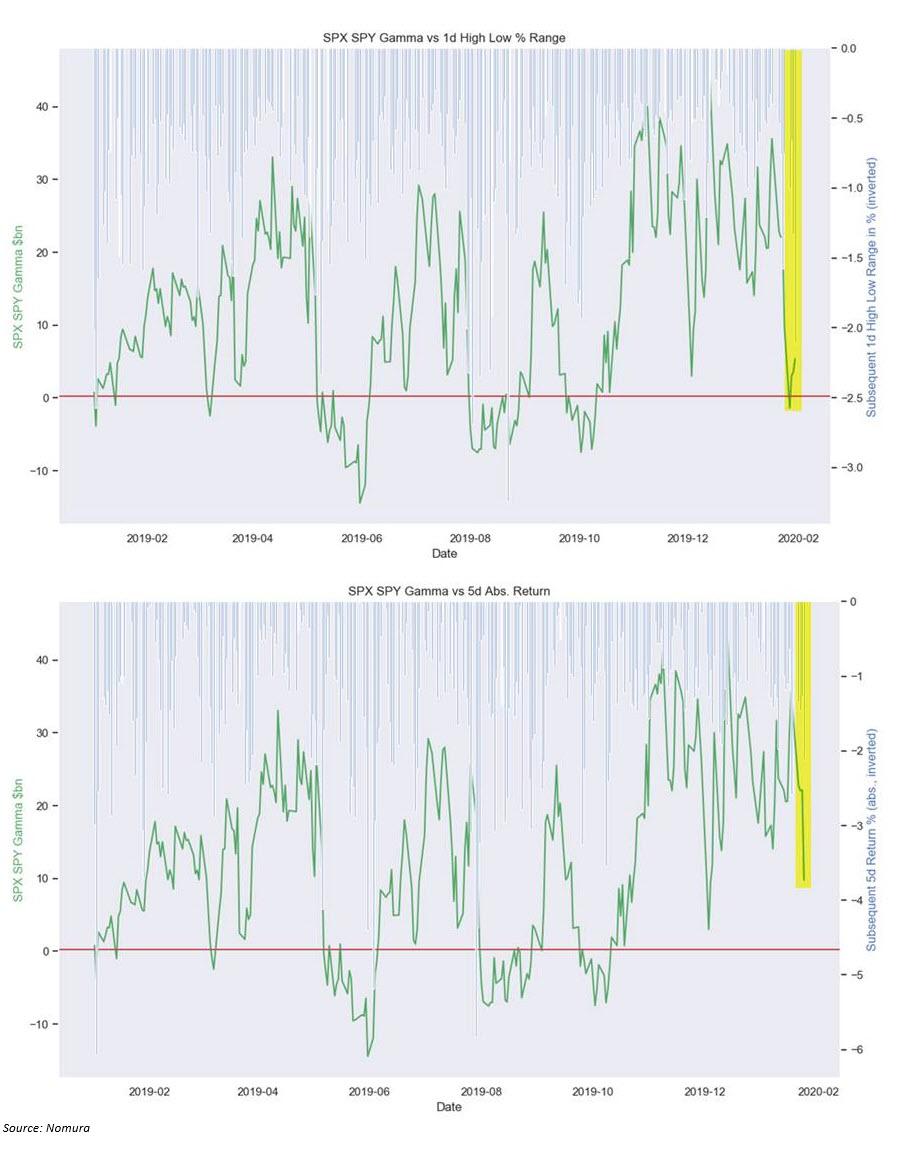
McElligott underscores this point, and notes that once again, the change in the gamma “impulse” took place concurrent with a large move in the S&P.
Alternatively, as a function of market reflexivity, one could claim that it is the drop in gamma that leads to higher vol, and lower prices. Direction of causality notwithstanding, the bottom line is simple: 3,254 is the one level that every trader should be focusing on to determine what the market will do in the very short term, and should SPX spot fail to rise above the gamma flip level, there is great potential for a period of higher turbulence in the short term.
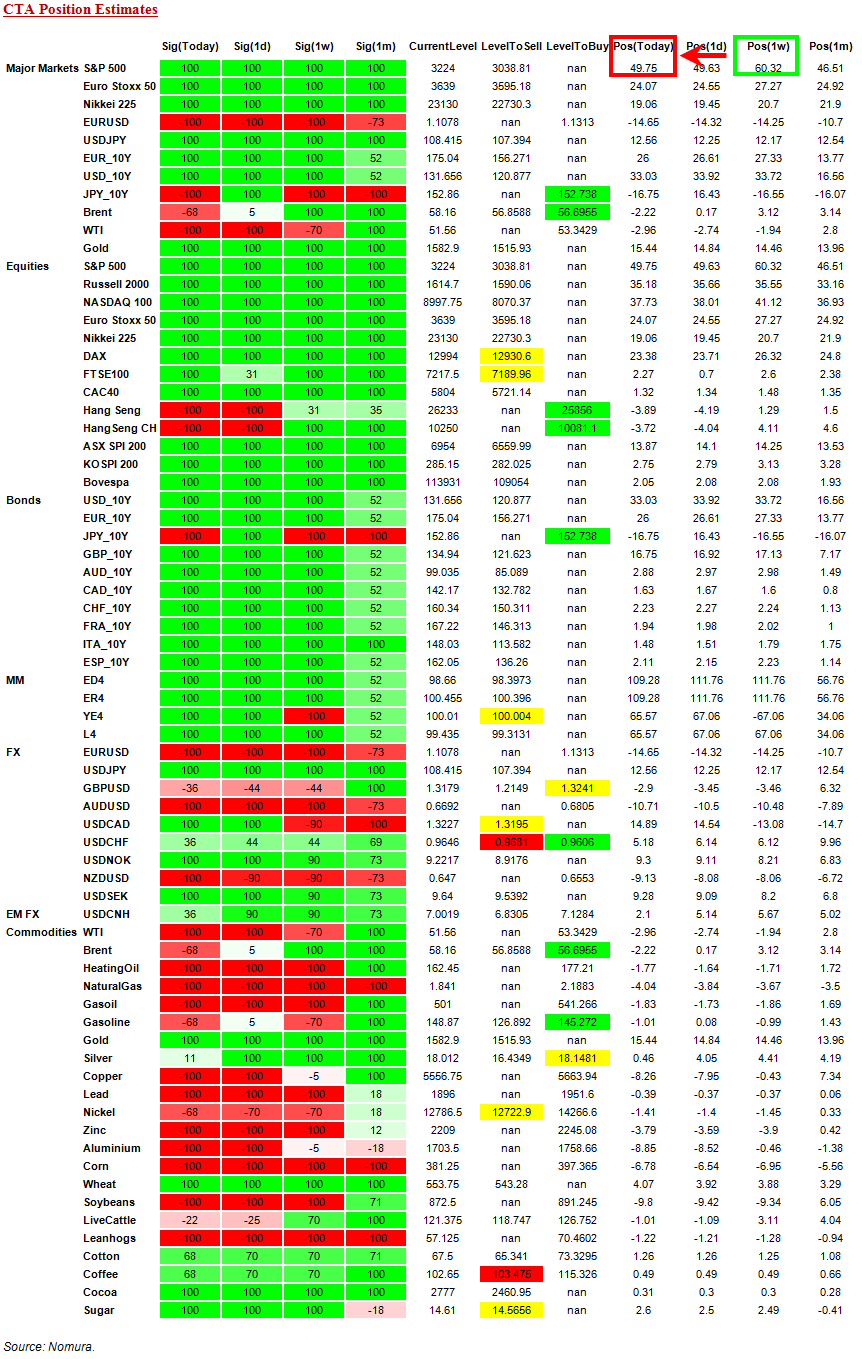
There is another reason why traders should be closely watching the battle over 3,250, and it has to do with an entirely different set of investors: CTAs.
According to Charlie, the Nomura QIS CTA model shows that despite the overall signal for the SPX position remaining “+100% Long” as of this morning (as all three time horizons with any “weighting”—3m, 6m and 12m—are all still “buy” signals), the short-term 2w window has flipped “Short” due to the recent impulse move lower/the jump higher in trailing realized vol — which means that the “gross” exposure in the SPX futures position has been deleveraged from the two year “high” of 60.3% made last week, now reduced to this morning’s 49.8% position
And while the 2-week signal in the CTA model is already a “Sell,” if today the S&P closes flat, or worse, red, McElligott would “expect to see the 1-month signal turn “Sell” tomorrow as well.” Still, the only signals that matter for now are the 3m, 6m and 12m models — thus the position maintains the overall “+100% Long” status.
But that too will change if SPX spot closes below gamma, as dealers now are “incentivized” to chase the market lower, resulting in lower prices, higher VIX, an even greater delta between spot and gamma, even more selling, etc. in a feedback loop; and with VIX spiking it would eventually push all CTAs signals more bearish, until eventually all those green “100% longs” start shrinking until eventually they all go flat, and then turn negative, as CTAs officially join the selling frenzy.
Bottom line: keep an eye on where S&P closes the day: 3,254 is all that matters.
Tyler Durden
Mon, 02/03/2020 – 14:25
via ZeroHedge News https://ift.tt/2ufqSFp Tyler Durden
