22 Market Observations From Goldman’s Head Of Hedge Fund Sales
Tyler Durden
Mon, 06/22/2020 – 20:10
By Tony Pasquariello, global head of HF Sales at Goldman
For the financial markets, the period since late February has been a watershed – a genuinely epic sequence of action and reaction.
In tactical terms, there’s no shortage of stories to recount. there was the day when S&P closed down … 12% (and, thereafter, the VIX touched 85). or, the time when the US long bond rallied 40bps … in 24 hours. and, to be sure, no greatest hits list would be complete without reference to the futures expiry when WTI sold off, ahem, 305%.
Jumping off those points, below is a simple layout of 22 line items that stuck out to me over the course of the past several months.
This sequence wasn’t constructed to represent a cohesive theme or directional bias, but I think we can agree on the following: this period has been epochal. we’re passing the early chapters. and, perhaps most importantly, the interplay between the financial markets and policy has been truly enormous and without precedent; the undeniable fact that government has been an overwhelming force in markets is shot through the list below:
1. 2020 has likely featured the sharpest — but, the shortest — recession in US history (certainly since the 1850s for the US, and since WWII on a global scale). credit: Jan Hatzius, GIR.
2. in turn, we’ve just seen the strongest rally out of a bear market since … 1932. credit: Ben Snider, GIR.
3. the US alone had conducted $2.3tr of QE in the past three months (Treasuries + mortgages). for those keeping score at home, that’s an average of around $35bn of bond buying per business day since mid-March. credit: David Mericle, GIR.
4. GIR expects zero interest rates in the US for several more years — until the economy reaches 2% inflation and full employment — which is perhaps not until 2025 (link).
5. GIR expects another $1.5tr of US fiscal support to come this summer (link).
6. largely thanks to fiscal support, GIR expects US disposable income to grow 4.0% in 2020 (link).
7. the US Treasury planned to borrow $3tr in Q2 alone (link); despite that supply glut, we’re just off the all-time low yields in US 2yr notes and 5yr notes.
8. in that same general context, US 30yr mortgage rates are down to all-time lows (link).
9. the past six weeks have seen the largest amount of global equity issuance on record, at $205bn (link).
10. March saw record outflows from corporate bond funds (-$42bn); we’re now witnessing record inflows to corporate bond funds (+$85bn since the start of April); link.
11. it’s not just that we’re witnessing record new issue in the credit markets, it’s that we’re also seeing record low corporate financing costs (e.g. AMZN raised $10bn of capital at the lowest 3/5/7/10 and 40yr yields ever; link).
12. March saw record outflows from equity mutual funds and ETFs; one can argue we’re now seeing legitimate signs of retail investor euphoria (e.g. a record # of account openings at US retail brokers; link).
13. buybacks: GS executed repurchase is down ~ 50% YTD (link). that said, it wouldn’t be surprising to see AAPL + MSFT + GOOG collectively buy back $75bn this year.
14. subject to your interpretation: the market cap of MSFT is larger than the entire US High Yield market (link).
15. Michele Della Vigna, GIR: “we estimate that clean tech can drive $1-2tr pa of green infrastructure investments and create 15-20mm jobs worldwide, mostly through public-private collaboration, low financing costs and a supportive regulatory framework … renewable power will become the largest area of spending in the energy industry in 2021” (link).
16. related: ESG funds comprised 31% of all YTD flows to global passive equity funds (link).
17. randomly found in a comment section on the world wide web: “does not capitalizing the first word in a paragraph make a writer appear to be cool or is it simply that Tony Pasquariello is an idiot.” I’m not bolding any part of this sentence.
Finally, these were some of the more striking charts from H1’20:
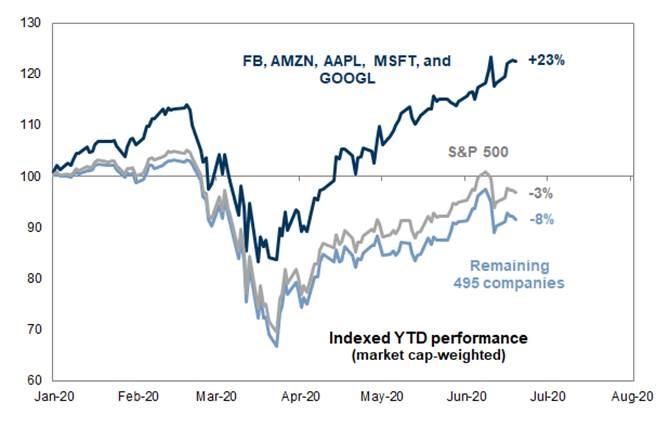
18. for better or for worse, this clearly illustrates the top heavy nature of S&P 500 returns YTD (credit to Cole Hunter, GIR):
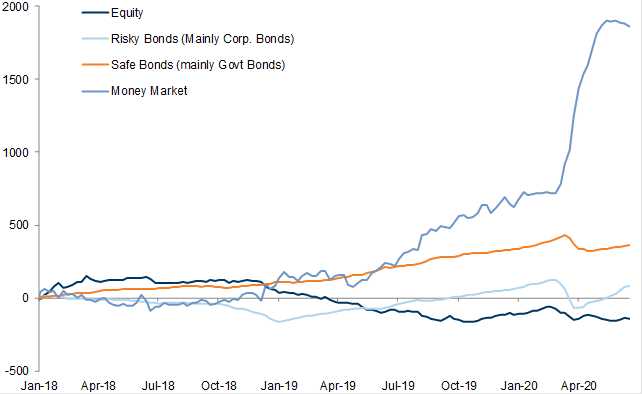
19. despite an absence of available yield, we live in a world of record inflows to money market funds (link). I find it a little interesting that we’re seeing a tentative inflection lower here:
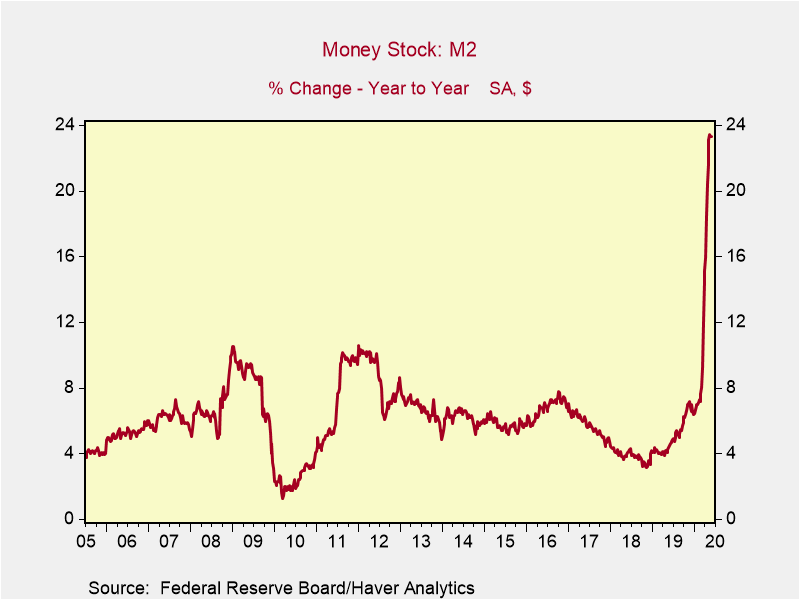
20. an updated chart of the y/y % change in US money supply (credit William Marshall in GIR. your interpretation of this chart may hinge on whether you’re a first or second derivative kind of person:
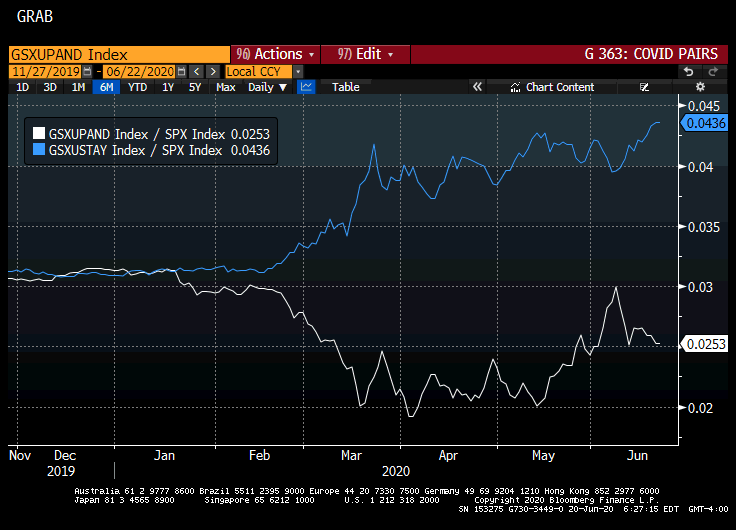
21. yes, there’s been some significant rotation of late in things like leaders vs laggards. for example, you can see there was some recent retracement in names were hit hard by the health crisis (see white line below, which is a ratio vs S&P). that said, note that the stocks most leveraged to the stay-at-home theme continue to outpace most everything else in the market (blue line):
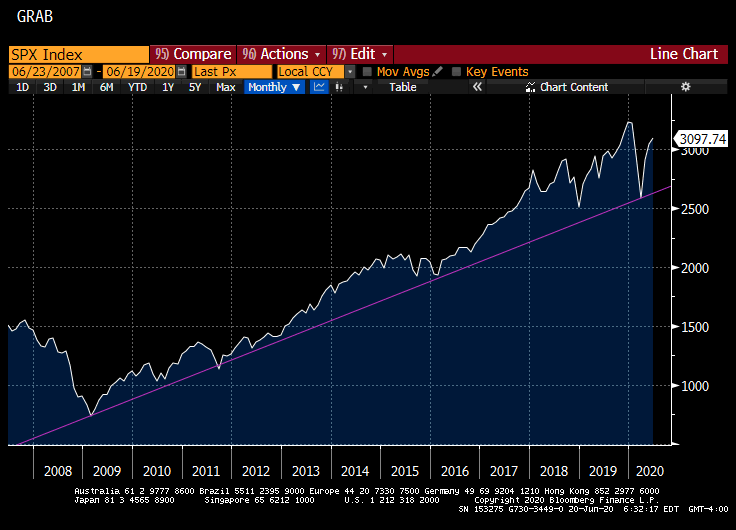
22. last but not least, through thick and thin, the big S&P bull trend line still holds:
via ZeroHedge News https://ift.tt/2Z1YamD Tyler Durden
