Two Profit Measures, Two Different Stories: GDP Profits Are Unchanged, While S&P Profits Soar
By Joseph Carson, former chief economist at Alliance Bernstein
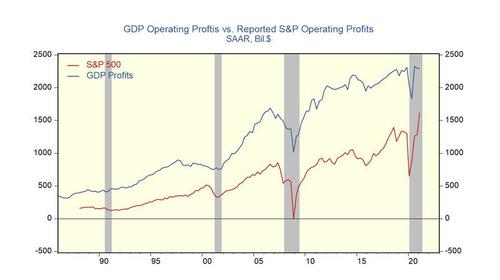
In Q1, GDP-based operating profits for all US companies were unchanged from the fourth quarter of 2020 and posted a 12.7% gain from the comparable period one year ago. The reported profit performance of S&P 500 companies was markedly better. Q1 reported operating profits for S&P 500 companies jumped 25% over the Q4 level and were up 150% in the past year. ,
The GDP-based measure of profits and the reported figures by S&P 500 companies are not strictly comparable because of different accounting conventions. The GDP measure is based on a tax accounting framework and only reflects the income generated from current production. In contrast, S&P 500 companies use a financial accounting framework to report profits to shareholders.
Financial accounting allows companies to include non-operating profits and losses. The most significant non-operating items are capital gain income and losses. Capital gains and losses can result from trading activities, a revaluation, or the sale of an asset. GDP-based operating profits exclude swings in capital income because they result from mark-to-market changes in asset values and do not reflect earnings from new production or output.
Past studies by the Bureau of Economic Analysis (BEA) have found that capital gain income and losses can amount to hundreds of billions in any given year. By itself, it can explain much of the difference in the operating profit measures.
The significant divergence in the two profit series in the past year reflects substantial capital losses in 2020 and considerable market capital gains in 2021. For example, S&P reported operating profits plunged 50% in Q1 2020 over Q4 2109, reflecting the plunge in equity prices, whereas GDP profits fell one-fifth as much. That reversed in Q1 2021 as equity prices surged to record highs.
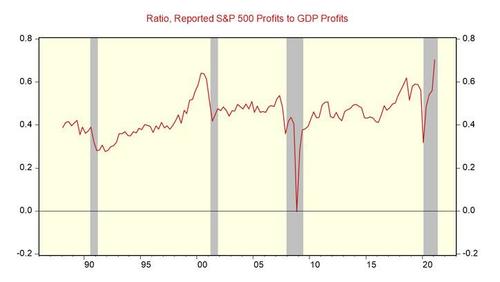
In Q1, the ratio of reported S&P 500 operating profits to GDP profits hit a new record of .70%, far above the previous high of .64% posted during the tech equity bubble of 2000.
That outperformance is a function of equity asset inflation and not a superior operational performance of S&P companies. In other words, an equity market correction would hit reported S&P reported profits doubly hard but will hardly move the needle on GDP profits.
Tyler Durden
Thu, 05/27/2021 – 12:39
via ZeroHedge News https://ift.tt/3fNISug Tyler Durden

