COT Primer: The Gold Trend Is Still Very Favorable
Authored by Mike Shedlock via MishTalk.com,
The gold commitment of traders report is bullish. Let’s start with a primer of what the COT report shows.
What is the COT Report?
COT reports show the positioning of commodity futures. There is a COT report for every commodity (gold, silver, lean hogs, live cattle, sugar, corn, the S&P 500, US Treasuries, etc.).
The reports are released every Friday but reflect futures positions as of the previous Tuesday.
In the futures world, the net position is always zero. For every long there is a short.
The Commodity Futures Trading Commission CTFC produces two sets of reports described below.
Legacy Reports
The legacy reports show large specs, small specs, and commercials.
-
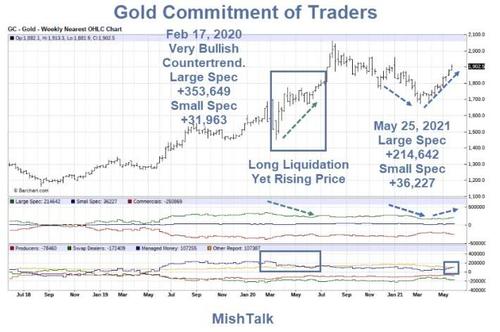
Large specs are hedge funds, pension plans, and individuals trading in sizes deemed to matter. (Top Green Line)
-
Commercials (Top Red Line) consist of three groups. Producers who sell the the gold they produce, merchants who use gold (e.g. jewelry makers), and market maker hedgers who take the other side of trade. The producers are net short and the merchants are net long.
-
Small specs are small traders. (Top Blue Line)
Disaggregated Reports
Starting September 4, 2009, the CTFC produced a second set of reports called the disaggregated reports.
-
Commercials – Producers and Merchant/Processor/Users (Bottom Red Line)
-
Swap Dealers (Bottom Green Line), the commercial hedger market makers
-
Managed Money (Bottom Blue Line), in general represents the large specs.
-
Other Reportables (Bottom Orange Line), in general represents the the small specs.
Market Makers Have No Say in the Matter
The commercial market makers have no say in what they do.
Q: How So?
A: By definition there is a short for every long. Speculators place their bets, producers sell what they produce, merchants buy gold and take delivery. The market makers net the entire position to zero. They have no say.
I have not heard it phrased that way but that is the mathematical truism.
Curiously, many gold bulls blame the market makers for being short and suppressing price although they have no say in what they do.
You frequently hear statements such as “The market makers increased their shorts and will get blown out of the water if the price rises.”
They will not get blown out of the water because they are hedged, and they had no say in being short.
It’s more accurate to state speculator long accumulation or liquidation as the driving force.
What About Manipulation?
Theoretically, the commercial hedger market makers do not care which way the market goes because they are hedged. If they were not hedged, they would have blown up long ago.
Gold rose from $250 to $2000 with the hedgers short nearly the entire way.
However, the commercial hedgers can and do manipulate the market when their hedges get out of whack or they see an opportunity for a quick gain.
They have admitted to manipulation and have been fined for that manipulation.
Cot Report Bullish or Bearish?
- In general, when the speculators are building their positions, the price of the commodity is rising.
- In general, when speculators are unwinding their positions the price of the commodity is falling.
The lead chart shows the last two years with a couple of arrows that spotlight the generalities.
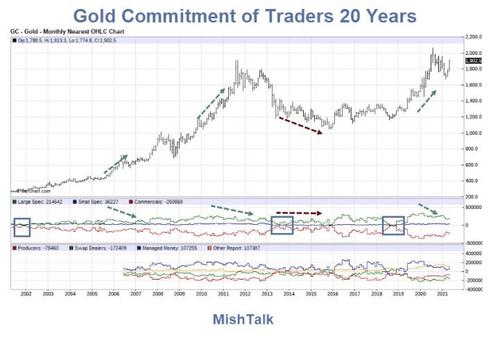
But generalities can get you in trouble as the lead chart also shows. Here is a 20-year look.
Gold Commitment of Traders 20 Years
Notes On Generalities
-
Don’t count on generalities.
-
The green arrows show periods of long liquidations in which the price of gold rose anyway. These are very bullish setups.
-
The red arrows show periods when gold fell where long liquidation did not take place.
-
The blue boxes show wipeouts where speculators threw in the towel. That’s when commercial hedgers are likely to be net long. In general, those are excellent time to buy with the least risk. Yet, one must be patient as the red arrows show.
Current Setup is Bullish
Q: How so?
A: Speculator position is building, but nowhere near extreme and the price is rising.
Take another look at the lead chart.
Managed money started unwinding contracts (long liquidation) in February 2020 yet the price of gold, albeit with one dip, exploded higher.
That was a very bullish setup.
Current speculator positioning is nowhere near extreme. Their position is building and the price is rising.
This is a bullish setup. Those who expecting another washout (blue box) and waited for it missed much of the move.
Gold vs the Dollar
In related generalities, we hear things like “The dollar is rising and that is bad for gold“.
On a day to day basis the conventional wisdom is generally true. Long-term and even intermediate-term such statements are laughable.
Charts of gold vs the dollar highlight the silliness of conventional wisdom.
For discussion, please see Nonsense from the WSJ on Gold vs the Dollar
In the above post I also discuss conventional wisdom on jewelry demand and the real driver for the price of gold.
The US dollar may be poised for a rally, but don’t presume gold is destined to sink in response.
Tyler Durden
Sun, 05/30/2021 – 14:59
via ZeroHedge News https://ift.tt/3fUO3bN Tyler Durden

