“10 To 20 Asset Managers Are Being Liquidated” – Rate Vol Exploding Just As Funds Pile Into Repo Trade That Blew Up Market
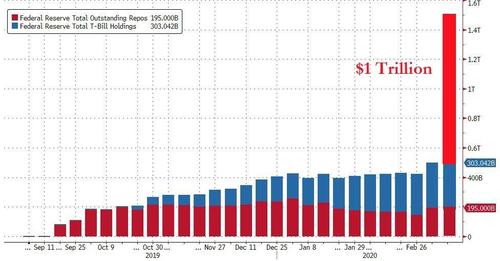
A little over two years ago, on the 11th anniversary of Lehman’s bankruptcy, a “repo crisis” shocked Wall Street when on Sept 16, 2019 it suddenly became apparent that despite $1.3 trillion in “excess” deposits and years of QE, there was not nearly enough liquidity in the system. A month later we were the first to piece together the puzzle, which confirmed that it was JPMorgan’s drain of over $100 billion in repo and money market liquidity that was the precipitating factor for the repo market collapse. In other words, not only did JPMorgan precipitate the repocalypse (and was not just us who made this claim, but other websites websites and news sources), but with its actions it also triggered the launch of the repo liquidity flood and, a few weeks later, the Fed $60BN in T-Bill purchases, aka QE4.
But while it was JPMorgan’s direct actions that soaked up enough liquidity from the market to start a cascading crisis, the actual trades in question were highly levered positions involving a relative-value compression trade in the Treasury cash/swap basis, similar to what LTCM was doing ahead of its 1998 bailout (we described this dynamic in detail in in Dec 2019 in “The Fed Was Suddenly Facing Multiple LTCMs.”)
For those who missed it, a quick refresh: for much of 2017 and into 2019, as volatility collapsed, one increasingly popular and extremely levered hedge fund strategy involved buying US Treasuries while selling equivalent derivatives contracts, such as interest rate futures, and pocketing the arb, or difference in price between the two. While on its own this trade is not very profitable, given the close relationship in price between the two sides of the trade. But as LTCM knows too well, that’s what leverage is for. Lots and lots and lots of leverage.
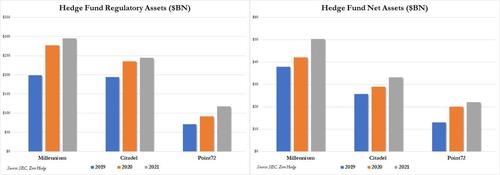
We also said that “hedge funds such as Millennium, Citadel and Point 72 are not only active in the repo market, they are also the most heavily leveraged multi-strat funds in the world, taking something like $20-$30 billion in net AUM and levering it up to $200 billion. They achieve said leverage using repo.” The chart below shows the regulatory assets among the 3 biggest hedge funds: despite the 2019 repo crisis, asset growth has only accelerated…
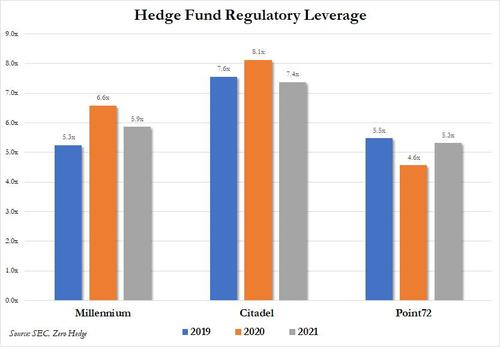
… or rather precisely because the repo crisis showed that the Fed would always bail out the super large hedge funds (and with its Form ADV at 261 pages, it’s clear that Citadel would never be allowed to fail), that asset growth has continued with regualtory leverage still in the stratosphere.
And while individual firms borrowing is a closely guarded metric, and changed day to day depending on market conditions such as volatility and overall liquidity, in March 2020, Bloomberg reported that some fund were levered up as much as 50 times their own wagers. Leveraged funds exposure to the basis strategy could be as much as $650 billion, JPMorgan strategists said.
Why do we bring all of this up now?
Because as Bloomberg’s Edward Bolingbroke writes, picking up where we left off in “Treasury Market Becoming Increasingly Distorted By Record Bearish Sentiment“, a little over two years after the basis trade implosion that sparked the repo crisis and led to “NOT QE”, hedge funds are piling right back into precisely the same basis trade that nearly blew up the world in late 2019 and again in early 2020…
… as surging expectations for Federal Reserve rate increases create dislocations in the market, particularly for two-year notes.
As we have repeatedly explained over the years, the infamous Treasury basis trade involves pairing a position in highly liquid futures with an opposite position in the underlying (and usually less liquid, thus arbable) note or bond, and futures positioning data from the Commodity Futures Trading Commission suggest it’s having a moment. The trade makes sense because, as Bloingbroke notes, the increasing threat of Fed rate hikes last week caused a surge in two-year yields that disrupted the cash-futures relationship.
As interest-rate swaps repriced the Fed’s path to over two hikes next year, compared with less than one a month ago…
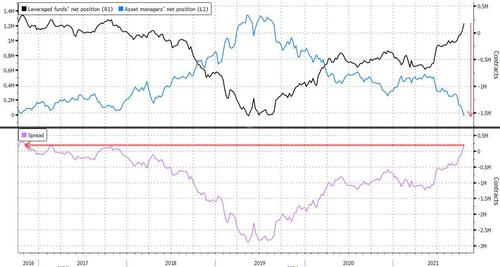
… interest in being short the two-year note inflated its value relative to futures, something we first discussed last Monday. And, as Bloomberg reports, this relative cheapening in futures apparently enticed hedge funds to enter into short basis trades, in which they’re long futures and short cash. Curiously, at the same time, the latest CFTC data shows that hedge funds last week extended their net long in two-year note futures to the most since October 2017, as asset managers cut their net long position. The positioning spread reached the widest since 2016.
Furthermore, as we also address last Monday, the rate at which short positions were established in two-year Treasuries last week was reflected in the high cost of borrowing the newest one, which was “trading deeply special in repo markets, and the specialness is expected to persist through the end of November,” Deutsche strategist Steven Zeng said in an Oct. 22 report. With the Fed’s rate near 0%, a security trading special has a negative financing rate that is beneficial to the owner and punitive for a borrower. It’s also why last week’s 2Y auction were so stellar: not because funds wanted exposure to rates on the short end, but because they were desperate to get their hands on more physical paper to put on even more basis trades.
Barclays strategists Anshul Pradhan and Andres Mok confirmed these observations when they said that the extraordinary demand for the newest two-year notes made them “a potential candidate for investors to be short against TU futures and likely why the issue has been funding special in repo as of late.”
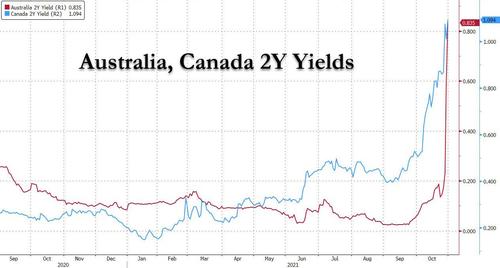
Translation: the higher rates expectations rise, the more dislocated the cash-futures arb gets, the more hedge funds pile into the same trades which by definition soak up market liquidity and become ticking timebombs should there be a violent, sudden reversal in market sentiment…. Just like the one we saw last week when Australian and Canadian 2y yields did this:
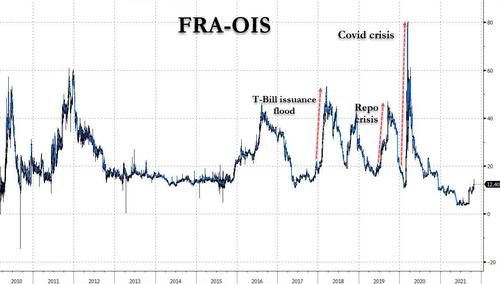
And this is where things get interesting, because even Bloomberg admits that “past episodes involving hedge funds and the basis trade ended in tears, notably in 2020, but this one has been fairly orderly so far.” As Bolingbroke notes, the FRA/OIS spread, “a key gauge of banking-sector risk that moved 70 basis points during the first quarter of 2020, has remained within a three-basis-point range over the past month.”
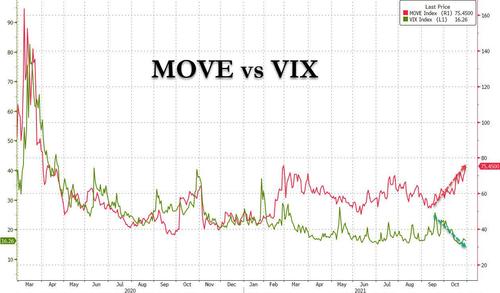
While that’s certainly true, don’t expect this level of calm to persist, and in fact, if former Lehman trader and current author of the Bear Traps report is correct, all hell may be about to break loose. Writing in his latest report, McDonald says that “we are hearing 10 to 20 different asset managers across the industry are being liquidated or are under review for liquidation due to interest rate derivatives, it’s a bloodbath.The VIX (equity vol) looks wildly mis-priced relative to what is happening ) in fixed income markets.”
As McDonald continues “when you have a book that is wounded, they need to sell liquid assets. When you don’t allow business cycles to function and you don’t allow price discovery in global capitalism for long periods of time and then academics who don’t understand anything about risk all of a sudden unleash price discovery too fast, they destroy things – and that is what is happening.“
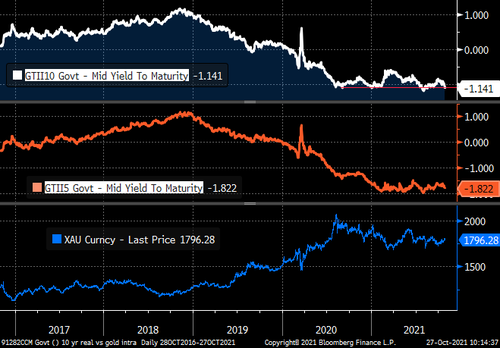
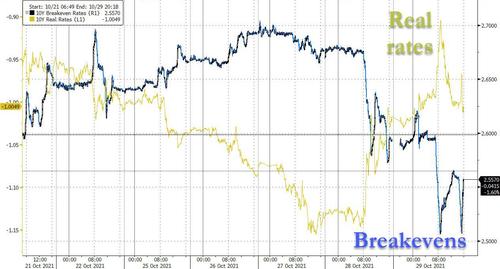
Citing a London CIO, McDonald asks “did the yield curve kill rumors that this move has taken out another fund, ala Alphadyne.” As a reminder, overnight Bloomberg reported that steepening bets gone terribly wrong is why macro hedge fund giants Rokos and Alphadyne suffered huge losses in recent weeks). The question of course is who else got steamrolled and whether they will have to liquidate performing assets to plug the VaR shock crisis hole. Indeed, as McDonald notes, “the rally in nominal yields pushed real yields further negative, which should have led to a surge in gold and silver, but didn’t – this speaks to an Alphadyne-like situation.”
So besides real vs breakeven rates – which over the past two days have violently zigzagged…
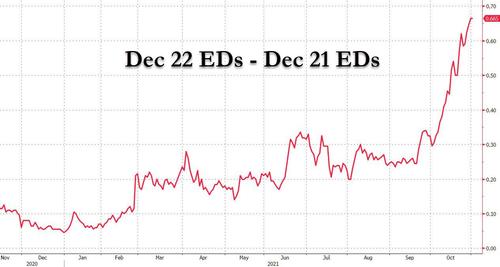
… as more funds were stopped out with massive losses, leading to a collapse in Eurodollar open interest as the net change in white-pack (Dec21-Sep22) eurodollar futures was -113,546 contracts, while open interest plunged -84,014 in red-pack futures (Dec22-Sep23), with the plunge in OI suggesting the trades were done to exit steepeners, another place to watch for early signs of trouble is junk spreads.
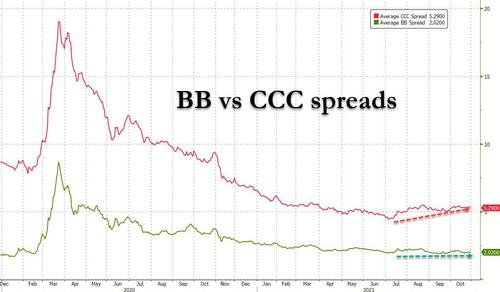
And indeed, as McDonald observes, the weakest links in the credit market have seen spreads consistently widen (weaken) over the past 2 months, and it is only a matter of time before BBs start trending weaker along with CCCs.
As McDonalds warns, “the weakest links in the credit market have seen spreads consistently widen (weaken) over the past 2 months. We expect BBs to soon start trending weaker along with CCCs.”
“The entire leveraged finance complex is based on low borrowing costs – the high yield market is at 4% and even CCC bonds (50%-60% historical default rates) are at an average yield of about 7%.”
Corporate credit moves notwithstanding, the bigger concern is that while equity implied vol remains subdued and almost ominously low, rate vol is not only surging domestically, disconnecting from the complacency in stocks…
… but has exploded globally especially in places like Australia, Canada and the UK (see 2Y Yield charts above). This is how the Bear Traps summarizes this dynamic:
For much of the last two years, price discovery across global government bond yield curves has been suppressed. As we stressed in recent months, “Adam Smith’s hands are being tied behind his back.”
Free markets have not existed in a covid world. Now central banks are pulling away and the moves across the front and long-end of yield curves are colossal. It’s ALL ABOUT the rate of change. In macro rates, the body bags are piling up this week. The losses are enormous across this section of the hedge fund community. As one large whale gets stopped out, he takes the smaller players with him / her. There is a lot more risk out there than meets the eye.
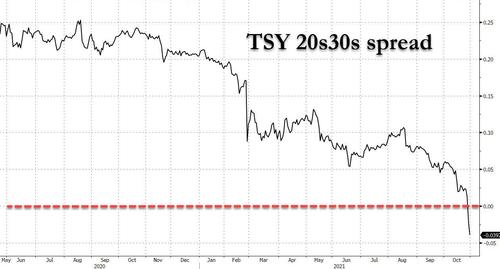
In US rates, the 20 and 30-year bonds both yield 1.77%, we touched inversion today. We are NOT seeing real economic growth, bonds are telling us real demand destruction is here. Inflation has already hiked rates 200bps for the Fed.
And here is the problem: in his latest weekly note, JPM’s rates strategist Alex Roever echoed what DB’s Zeng said last week and writes that the recent volatility in rates markets has ushered in with it an increase in dislocations along the Treasury curve:
Exhibit 5 shows that the root mean square error (RMSE), of our par fitted curve, a measure of aggregate dispersion, has nearly doubled this month, rising to levels last seen in March 2020. The rise in RMSE at that time was a clear early indication of dysfunction within the Treasury market and driven by record-sized deleveraging in various forms of carry trades within the Treasury market. This time around, we do not think this rise portends the same historic disruptions that we saw in early 2020, especially with policy rates at the ELB, the Fed still buying $80bn in Treasuries per month, and financial conditions are broadly easy.
Yet while JPM is – as always – complacent about bond market risks, the bank concedes that “this does indicate that relative value trades which traded like short volatility positions have been unwound in recent days” and nowhere is this more evident in the 20-year sector of the Treasury curve, as 20s/30s flattened 4bp this week amid the broader long end flattening, moving into inverted territory
This violent shift in the 20s30s yield curve is merely the latest confirmation that liquidity across the curve is collapsing; here is Srini Ramaswamy from JPM’s rates derivatives team explaining why:
It was a wild ride in markets this week, with front end yields decoupling from longer maturity sectors of the curve. At the very front end of the curve, the drumbeat of rising inflation concerns continued to pressure front end yields higher and money-market sector yield curves steeper. Long end yields on the other hand, fell sharply this week. As the week came to a close, yields were higher by 4bp in the 2-year sector, but lower by 10bp and 15bp, respectively, in the 10- and 30-year sectors of the curve.
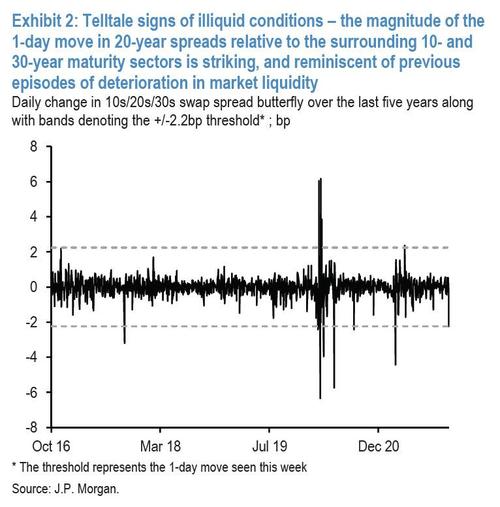
These sharp idiosyncratic moves are a clear sign of thin liquidity in markets, even as major thematic shifts are underway. Exhibit 2 shows, for instance, daily changes in the 10s/20s/30s swap spread butterfly over the past 5 years, with the bands representing a 2.2bp move (the size of Thursday’s move) in either direction.
As can be seen, moves this large are very unusual – outside of the March 2020 immediate aftermath of COVID-19, such a large move has only happened three other times in the past 5 years – Oct 2nd 2017, Aug 19th 2020 and Feb 25th 2021. When individual issues in the Treasury market become dislocated from the Treasury curve, it generally represents periods of thin liquidity.
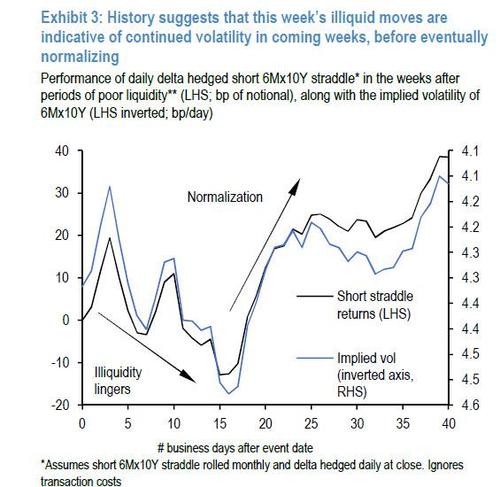
Even assuming JPM’s optimistic take is accurate what happens next? As the bank’s rate derivatives analysts concludes, “liquidity driven dislocations should ultimately fade, but could linger for a few weeks. One way to see this is to look at the performance of short gamma positions after periods of poor liquidity. Exhibit 3 shows the performance of delta-hedged short 6Mx10Y straddles in the weeks following periods of poor illiquidity (identified as periods when the 10s/20s/30s swap spread butterfly changed in magnitude by 2.2bp or more in a day). As can be seen, history suggests that the first few weeks following such episodes could stay volatile.”
Putting it all together:
- The liquidity in what is supposed to be the deepest, most liquid market in the world, is collapsing.
- In a time when the Fed is still injecting $120BN in liquidity every month, we just observed an event that has only happened on prior previous occasions – Oct 2nd 2017, Aug 19th 2020 and Feb 25th 2021. One can only imagine what happens to liquidity when the Fed begins to taper.
- As liquidity evaporates, rate vol is accelerating and dislocations across the yield curve accelerate, with bond vol surging while equity vol is completely ignoring the turmoil in the bond market. Eventually equity vol catches up to rates.
- Some extremely levered multistrat hedge funds are reprising LTCM and piling into treasury/futures basis trades – the same trades that blew up spectacularly in Sept 2019 and March 2020.
- As hedge funds pile into new flattener basis trades, others are liquidating basis steepeners, in some cases at huge margin call inducing losses, which force them to liquidate other performing assets.
- A positive feedback loop emerges as liquidity shrinks further while volatility rises as the basis trade funnel gets wider, and more enter while those hoping to exit hold off until the last moment.
- We hit a tipping point where all basis trades are no longer viable as there is simply not enough liquidity to put new trades on. That’s the moment everyone starts rushing for the exits, and as Sept 2019 and March 2020 showed us, that’s precisely the catalyst for a cross-asset crash, as basis trading funds scramble to boost liquidity while repo markets lock up. The result is a surge in volatility in underlying assets (TSYs), but also a freeze in the funding pathways (i.e. repo) that are used by the funds to fund said trades.
- Eventually, Fed steps in to bail out some of the world’s richest hedge fund managers, usually under the guise of some social calamity, like – for example – a viral pandemic.
We are currently toward the end of step 6 of this checklist.
As usual, all the supporting docs are available for professional subs.
Tyler Durden
Sun, 10/31/2021 – 09:55
via ZeroHedge News https://ift.tt/2Y4RMPk Tyler Durden
