Is A Stock Market Crash Like 2000 Possible?
Authored by Michael Lebowitz via RealInvestmentAdvice.com,
“Say say two thousand zero zero party over, oops, out of time
So tonight I’m gonna party like it’s nineteen ninety-nine” -Prince 1999
Prince wrote the song “1999” in 1982, 18 years before the clock ran out on the 20th century and possibly the greatest stock market run in American history.
In 1999, equity valuations stood at unprecedented peaks, even dwarfing those of 1929. At the time, investors were euphoric as if the rally were eternal. Newbies were killing it, and veterans were cleaning up like never before. Some stocks were rising 10, 20, and even 30% or more in a day. Companies adding dot com to their name or discussing new internet technology saw huge pops in their share prices. Investors bought the narrative with little to no due diligence.
Sound familiar? Not only is today’s speculative environment eerily similar to the late 90s, but valuations, in many cases, are frothier than that period.
Comparing valuations from separate periods is inaccurate as economic and earnings environments can be different. This article contrasts the valuations and environments to consider if it’s time to leave the party or stay and rock on. To help you decide we provide a statistical analysis showing the potential downside risk facing the S&P 500.
First, however, let’s look at a few valuation measures to provide context between today and 1999.
S&P 500 Price to Earnings
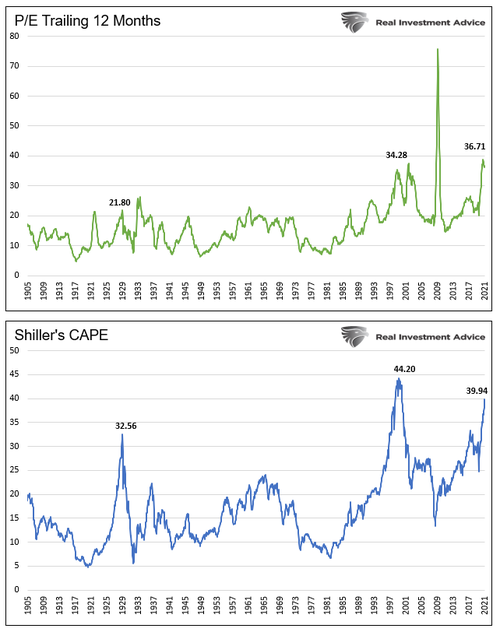
Price to earnings (P/E) is the most often used method to value stocks. It’s common for investors to use the trailing 12 months (ttm) of earnings in the P/E denominator, as shown in the first graph.
Some investors, including ourselves, prefer using the CAPE P/E. Robert Shiller’s CAPE method uses the last ten years of earnings to better factor in secular earnings trends and avoids one-off events that distort valuations.
P/E valuations are grossly extended, and in both calculations nearing or surpassing levels in 1999. The graphs also show valuations are well above those of 1929.
Price To Sales
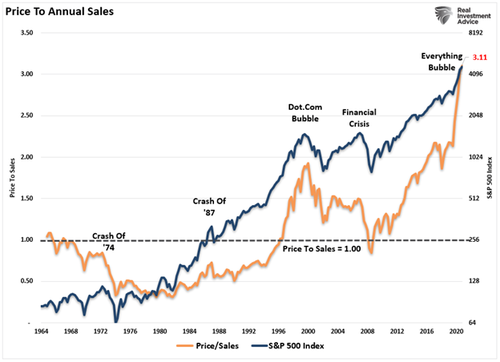
The benefit of using the ratio price to sales (P/S) versus P/E is that sales, or revenue, are not easy to manipulate by executives.
The graph below shows the price to sales ratio (P/S) is now 50% above where it was in 1999.
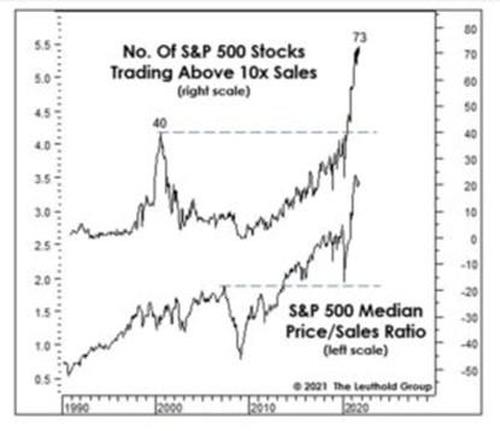
The charts below, courtesy of the Leuthold Group, provide further context. The top chart shows 15% of the S&P 500 stocks have a P/S ratio greater than ten. That compares to 8% in 1999. The bottom graph shows the median P/S ratio is nearly double the 1999 level.
To highlight what a P/S ratio of ten entails, we quote Scott McNeely, the CEO of Sun Microsystems, from 1999.
“At 10 times revenues, to give you a 10-year payback, I have to pay you 100% of revenues for 10 straight years in dividends. That assumes I can get that by my shareholders. It assumes I have zero cost of goods sold, which is very hard for a computer company. That assumes zero expenses, which is really hard with 39,000 employees. That assumes I pay no taxes, which is very hard. And that assumes you pay no taxes on your dividends, which is kind of illegal. And that assumes with zero R&D for the next 10 years, I can maintain the current revenue run rate. Now, having done that, would any of you like to buy my stock at $64? Do you realize how ridiculous those basic assumptions are?”
More Valuation Metrics
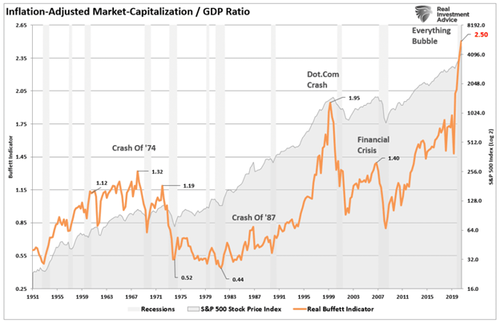
The following graph is purportedly Warren Buffet’s favorite valuation technique. The measure compares the inflation-adjusted market cap of the S&P 500 as a ratio to the economy. Given that earnings and economic growth correlate well over time, the ratio effectively points out valuation extremes. Currently, the ratio is at 2.50, well above the 1.95 from 1999 and 1.40 leading into the Financial Crisis.
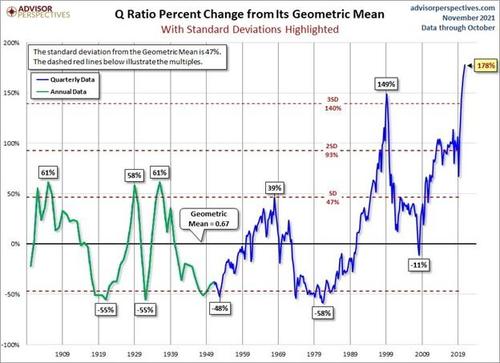
The Q-ratio takes the S&P 500 market cap and divides it by the aggregate replacement costs of the assets held by the companies in the index. It effectively quantifies how much an investor is paying for the underlying corporate assets. As shown below, courtesy of Advisor Perspectives, the ratio is now over 3.5 standard deviations above its norm. It is also higher than it was in 1999 and multiples of any other prior peak.
Compared to What?
Conservatively speaking, current valuations are on par or greater than those in 1999 and any other period. Such a statement is statistically factual, but it ignores the economic environments of both periods. For instance, if you think the economy and corporate earnings will grow at double-digit rates for years, we can make the case valuations are fair today.
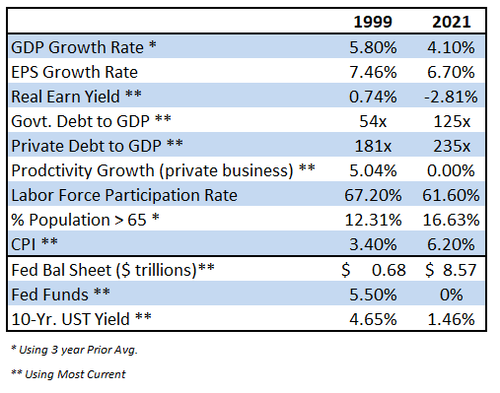
The table below compares economic environments from both periods.
Economic and earnings growth rates today are weaker than 20 years ago. Further, debt levels, measured as a ratio to GDP, are much higher today. Productivity growth and demographics, two significant factors determining economic growth, are weighing on economic growth today. In the 90s, they were strong economic tailwinds.
The last three indicators show the amount of monetary stimulus via low-interest rates, and the Fed’s enlarged balance sheet is much more accommodative than in 1999.
Fundamentals and the economic/earnings outlook are weaker today than in 1999. As a result, investors were better off paying higher valuations in 1999 than today.
However, the Fed is, directly and indirectly, bolstering asset prices and, therefore, valuations via their excessive actions. Low-interest rates promote the use of leverage and encourage buybacks which fuel stock prices. Additionally, investors shun low-yielding bonds to chase stocks to pick up needed returns. For more, please read The Fed is Juicing Stocks.
The Fed is the Fundamentals
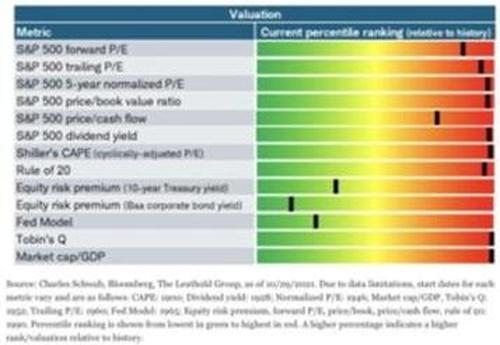
The bottom line is investors are paying more and getting less compared to 1999. The graph below shows numerous measures of valuations are at extremes except three. Those three in green shading use comparisons of stock prices to interest rates. They are “fairly valued.”
Whether they know it or not, investors are betting the Fed continues to levitate the market. Can stocks remain at extremely lofty valuations while lacking fundamental backing if the Fed continues to reduce QE purchases and ultimately raises interest rates?
Essentially the real gamble investors are taking is that inflation will be transitory. If high inflation is persistent and not transitory, the Fed will find it increasingly challenging to continue current policy.
Without the Fed’s enormous liquidity, valuation gravity will reassert itself.
Statistics Warn of 2650
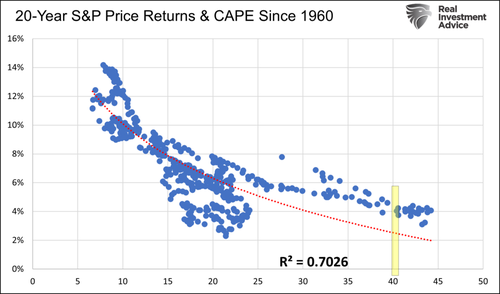
The graph below shows the strong correlation between CAPE valuations and future 20-year returns. At current levels, highlighted in yellow, we should expect annualized returns ranging from 2-4% for the next 20 years.
You may be thinking 2-4% doesn’t sound too bad considering how high valuations are. The problem, however, with such a long-range forecast is there may be periods with negative growth and others with double-digit growth within the twenty years.
While the regression allows us to form 20-year expectations, it also gives us the ability to forecast shorter periods.
Eighteen years ago, in October 2003, the S&P stood at 1019.50. Based on the regression above, investors could expect 4.90% annualized returns at that time. At such a growth rate, the S&P would rise to 2655 in October 2023. Currently, the S&P 500 is around 4700. Assuming the regression holds and history has favorable odds of that occurring, we should expect the S&P 500 to fall to 2650 in the next two years. A 43% decline is harsh, but it will only leave the index at fair value based on the last 40 years of CAPE levels. Quite often, markets revert below their means.
Before you dismiss our statistical analysis, let’s look back to 1999.
Prince wrote “1999” in 1982. When he wrote it, the S&P was at 111. Using the same math, investors could have expected 12% annualized returns, putting the S&P 500 at 1068 on New Year’s Eve 1999. The S&P, at the end of 1999, was 1450, offering investors a two-year expected return of -26%. Statistics delivered right on cue, and just two years later, the S&P hit 1068. The index ultimately fell to the low 800s before the stock market crash ended.
Summary
Every era of speculation brings forth a crop of theories designed to justify the speculation, and the speculative slogans are easily seized upon. The term “new era” was the slogan for the 1927-1929 period. We were in a new era in which old economic laws were suspended.” -Dr. Benjamin Anderson – Economics and the Public Welfare
Investors are making a big bet on the Fed and a “new era.”
On the eve of the stock market crash in 1929, Irving Fisher erroneously declared that stocks hit “what looks like a permanently high plateau.” Fisher could not have been more wrong. Same with investors in the “new era” of the internet of the late 90s.
Do you have faith the “new era” of Fed-managed markets can levitate stocks well above historical norms and prevent a stock market crash? Or will this “new era” resolve itself like prior “new eras” with a stock market crash?
Tyler Durden
Wed, 12/01/2021 – 08:46
via ZeroHedge News https://ift.tt/3IchfbO Tyler Durden
