What’s Behind The Surge In Yields That Sent Tech Stocks Tumbling, And What Happens Next
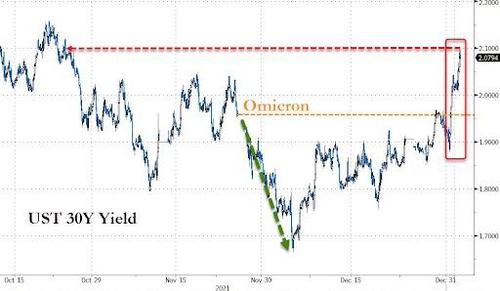
For a while it appeared that stocks, and especially giga-techs, were willing to ignore the plungefest in Treasuries and were riding the wave of new capital (some $125 billion according to Goldman) allocated to stocks of all stripes to start the new year. However, it wasn’t meant to last, and with yields suffering their biggest 2-day surge since the chaos in March 2020…
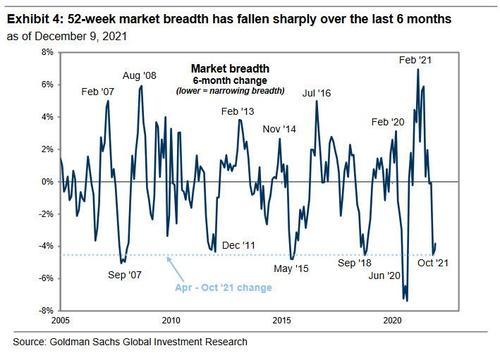
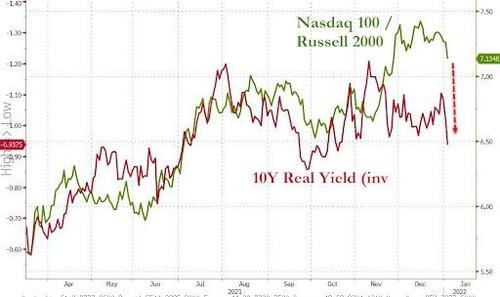
… high-duration names, which just happen to be the market’s all-important generals, are finally sliding which in a market with as little breadth as this one…
… is a very big problem because as Goldman warned a few weeks ago, a crack in the largest market leaders (the FAAMGs of course) could result in major pain: for those who forgot, the five most popular tech names – AAPL, MSFT, NVDA, TSLA, GOOGL – have contributed 51% of S&P 500 returns since April.
And what goes up can just as easily go down if rates rise high – and fast – enough. Which brings us to the big question: what’s behind the puke in Treasuries and will it persist?
From 30,000 feet, the catalyst for the selling in Treasuries is hardly a surprise: the Fed is all hawked up and with the accelerated taper, rate hikes are scheduled to take place potentially as soon as April, with some speculating that the Fed may hike more than 25bps at a time (we seriously doubt it absent inflation truly spiraling out of control in the coming weeks).
More likely, however, the recent yield spike is tactical (flow/positioning/liquidity-driven), and so we go to one of the most fastidious market tacticians, Nomura’s Charlie McElligott who in his morning notes today does a post-mortem of the selloff that started yesterday and has continued for much of Tuesday.
According to Charlie, the selloff in US Rates and Treasuries turned violent by the US midday on the first day of the new PNL year as bearish bets were re-engaged (with UST 10Y Yields now cleanly through 50, 100 and 200 DMA’s to the upside, while 30Y Yields are nearing a test of the 200 DMA themselves), and shares the following thesis checklist as a list of the drivers behind the move:
- Inflation “stuck” and currently unrelenting at multi-decade highs, with more Omicron supply-chain snarls further squeezing prices
- Still above multi-year trend growth in US (Atlanta Fed GDPNow @ 7.641% last)
- US Employment pushing “near full” again (4.2% U-Rate back to levels last seen pre-COVID)
- Imminent (obvious) Fed tapering commencement, but now, with actual balance-sheet runoff (QT) potential thereafter in UST and MBS being socialized by some Fed members, all of which would mean the need for actual (gasp) price-discovery for “private side” buyers–including convexity hedgers in Mortgages. Translation: we may very soon discover what the true yield of TSYs should be.
- Start-of-year resumption of heavy Corp debt issuance calendar @ ~ $11.25B of paper (Street expectations of ~$140B for the full-month of January), with a particularly duration-heavy (> 10 years) WAM seen in yesterday’s paper (note: more of the same today, with another 7 deals early, mostly Financials)
- Last but not least, we have seen the shift to the market not just pricing-in 3 full FOMC hikes this year, but pulling the liftoff forward almost every day, with the March meeting now ~ 72% “priced”
These key drivers behind persistent Treasury weakness were not lost on the market, and as Charlie writes, there was lumpy Duration selling in both Cash and Futs on Monday (especially a notable late-day WN block seller ~ $1.1mm in DV01), which was matched by “particularly aggressive options flows”, including what McElligott calls “an eye-wateringly ENORMOUS buyer of TY downside, where HUGE prem was spent on 71k of the TYH2 127 Puts (~1.95% yield target by mid-Feb exp) at nearly ~$5.5mm bp dv01″ (here he notes that this was an ADD to a view, with OI on Dec 31st at 161k, but now 231k as of Jan 3rd). The move has led to Treasuries posting their worst start to the year since 2009, sending ripples through markets from Australia to the U.K.
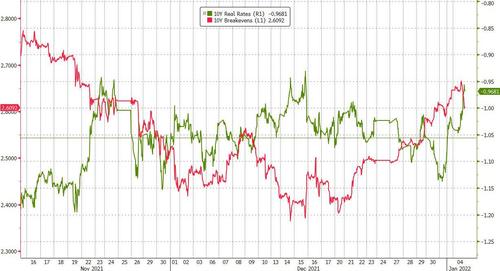
Adding to this, and in agreement with point 1 above, Bloomberg adds that Treasury traders “are betting the rapid spread of the omicron variant will increase inflationary pressures in the U.S. economy, rather than weaken them.” Specifically, the article looks at 10-year breakeven rates which climbed to as high as 2.66% on Tuesday, the most since November, and up from as low as 2.36% on Dec. 14. Even real rates jumped from as low as -1.13% at the end of 2021 to -0.96% today.
“Inflation continues to be the major theme of the market given life with the coronavirus,” said Makoto Noji, chief currency and foreign bond strategist at SMBC Nikko Securities Inc. in Tokyo. There is speculation that “the widening spread of the virus will lead to a decline in labor participation and supply constraints,” he wrote in a research note.
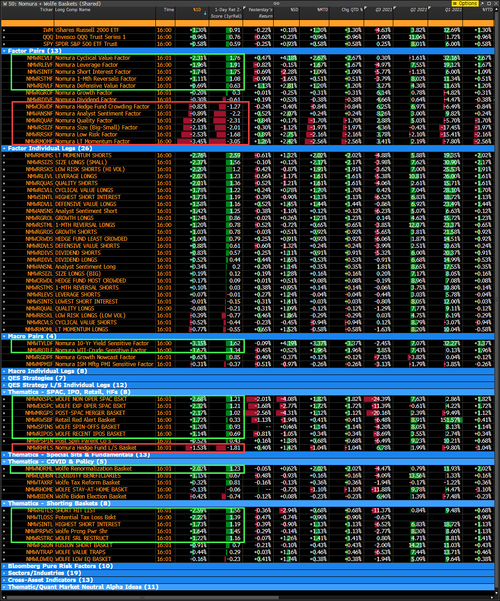
So how has this rate puke impacted stocks? Well, as McElligott continues, yesterday there was an outright “Momentum Shock” in the US Equities factor space, with the “Long-Term Momentum” factor absolutely “rekt” -3.5%, a 1d -3.1 std dev move over the past 1Y window and the largest drawdown in the factor since the peak of the meme stock / HF unwind on 1/27/21!
Furthermore, the Nomura quant writes that the rally/short-squeeze in “Low Quality/High Vol” stocks seen yesterday – i.e. “Leverage” and “Short Interest” factors booming – was a stark contrast to the recent theme of the grab into “Quality” (high over low), “Size” (large over small), “Low Risk” (over high vol).
Putting this together, this end-of-’21 “up in Quality” dynamic noted above was a large part of the blow-up in “Unprofitable Tech/Highly Speculatives” trade seen since the start of Nov ’21 into year-end (as the “short” leg of the trade), but yesterday, all of that “high spec” stuff really squeezed higher again, according to McElligott, as it looks like short books were de-grossed in a major way, while some too simply were taking discretionary punts on “high beta” to play for the January effect raising all boats, but particularly in the stuff which has just been the most beaten-down and ripe for O/P.
Of course, this “Momentum shock” reversal (lower in Size, Quality, Low Risk “longs” vs the squeeze in “junk” Leverage / High Vol / Cyclical Value) also meant a frustrating day for hedge fund long & short “Crowding” proxies on the first day of the year, as both suffered outsized losses:
- Hedge Fund Crowding Factor -0.8% (-1.3 z-score)
- Hedge Fund L/S Proxy -1.5% (-1.8 z-score)
Adding to the confusion, while hedge funds were clearing out their 2021 short-book leftovers, CTA/vol control funds were mechanistically rushing back into stocks, leading to the overall market ramp. According to McElligott’s calculations, the Nomura QIS CTA model showed +$16.4B of fresh buying in Global Equities on the day (particularly focused in Asia with the Nikkei signal flipping from “-49% Short” to “+100% Long”—notionally buying +$15.6B, on top of +$800mm in US and and +$100mm in European equity futs).
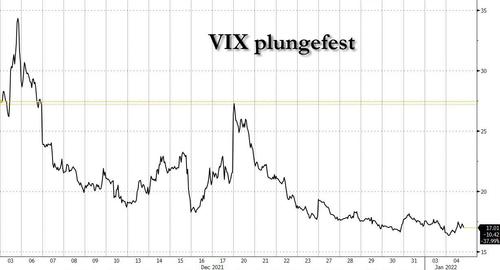
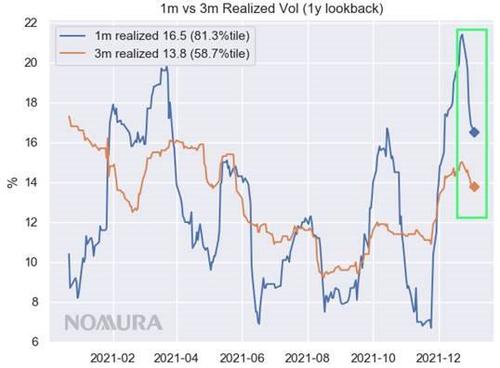
In the US, Nomura’s Vol Control model estimated another +$3.8B of S&P futures buying as 1-month Realized Vol continued its collapse with a 6th straight day of buying, and now +$23.3B over the past 2 weeks (take a look at where the VIX is and compare it a month ago (spoiler alert: it has been cut in half).
So what happens next? Well, as the Nomura strategist reminds us, next week should see the concentration of the forward buying – with particular focus on tomorrow (he is projecting a 1.0% chg = +$7.8B buying; 0.5% chg = +$14.5B buying; 0.0% chg = +$16.9 buying).
Yet mechanistic buying aside, the risk is that with Index Options Gamma- and Delta getting longer/more positive, McElligott warns that we are slowly inching nearer towards “potential for a pullback” territory, and as usual Nomura’s clients are urged again to focus on the monthly Op-Ex as the “unclench” catalyst there later mid-month January
- QQQ $Delta back to $13.2B, 94.9%ile
- SPX / SPY $Delta back to $291.6B, 80.1%ile
In conclusion, the Op-Ex tied “window for a pullback” also corresponds with again “stress-y” vol signals as spot indices trade to new highs, and with “Skew” and “Put Skew” flashing again – but particularly noting that “Term Structure” is screening “extreme” and to the point made at the top of the note on the heavy selling of Vol / optionality.
Translated to plain English, what all of the above means is that instead of waiting until Friday to see where this week’s op-ex chips may fall, the market is trading more or less as it should, and high duration giga-techs are dumping as yields are spiking… just as one would expect. The only question is whether this “logical” behavior will continue – one look at the chart below shows that the Nasdaq has a ways to drop if indeed it is allowed – or alternatively, if the remarkable bounceback from every op-ex makes another appearance, and spoos trade solidly back over 4,800 on their way to fresh all-time highs.
Tyler Durden
Tue, 01/04/2022 – 15:01
via ZeroHedge News https://ift.tt/31qNaEJ Tyler Durden
