After A Record $1.2 Trillion In Monday Cash Volume, What’s Next For The Market
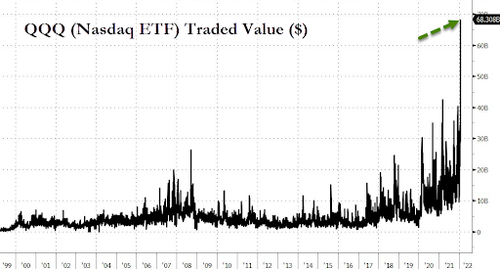
In perhaps the best post-mortem of yesterday’s insanity, Morgan Stanley Quantitative And Derivatives Trading Desk (QDS) writes that yesterday intraday volatility was absolutely extraordinary with record cash volume of $1.16tr.
The good news according to Morgan Stanley is that a tame close-to-close return has kept systematic supply at bay, and the rebound in growth stocks helped stem the P/L drawdowns for both HFs and retail traders alike. The bad news according to the QDS trading gurus is that the afternoon rally was likely driven by short covering, and it is hard to draw a read from this into the future – i.e., not much has changed, and the market is still grappling with the concern of a growth shock while the Fed is likely on autopilot.
Below we excerpt from the full QDS notes which lays out several thoughts on the flows, what big reversals usually mean for the market going forward, what the market needs to rally beyond a bounce, and the retail and systematic positioning setup from here.
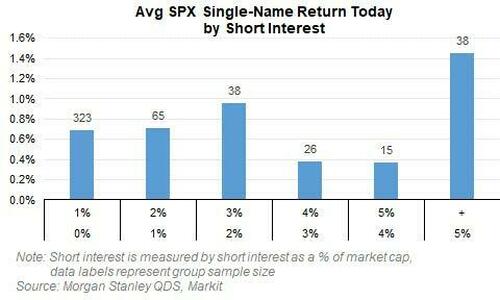
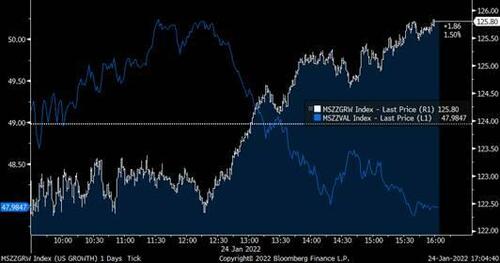
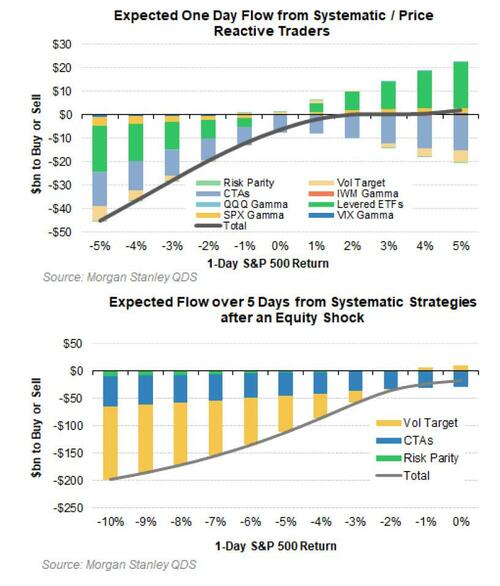
Flows: The morning saw heavy retail supply, and some traders likely got overly short on expectations of heavy systematic supply. But retail turned buyers in the afternoon, there were signs of single-name short covering as oversold growth stocks led the rebound, and futures went bid into the close. The retail supply from 9:30-12 was a new record for that time period at $3bn sold on QDS estimates*. And when the market was down 4%, QDS estimated that there would be nearly $30bn of forced selling today from systematic strategies and levered ETFs. Traders likely put on shorts on expectations of that systematic supply, and the down 7/8% moves in expensive and unprofitable Tech indicated some derisking. But then retail turned buyers shortly after noon, buying back $2.7bn of what was sold in the morning – the largest amount ever bought in that time period. Shorts were likely covered as long duration Tech rallied ~10% – high short interest names outperformed, and the MS high short interest basket (MSXXSHRT) outperformed SPX by 4 standard deviations today. Then into the close futures had to be covered with MS Trade Pressure showing ~$5.6bn of SPX futures bought on the day (97th 1y %ile), with most that coming through post 3pm
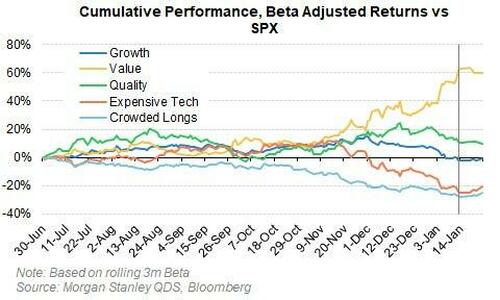
QDS’ client conversations even on the lows today were concerned, but not panicked. This is likely because alpha has been improving even as beta hurts returns. As the market has turned to worry more about a growth slowdown, expensive Tech and the Growth factor fared better, while Value is starting to fare worse, benefiting the typical portfolio skew. Of course it didn’t feel that way on the lows when Expensive Tech was down 7%… but relative strength in growth stocks was a pattern that began last week, and re-asserted itself strongly into monday afternoon.
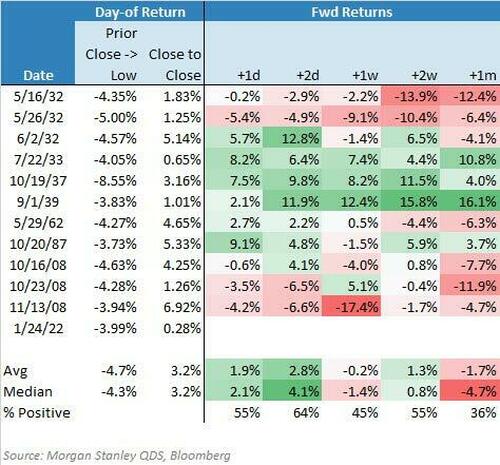
Monday’s sharp reversal was a rare event, but the signal power is mixed. Only 8 times since 1928 has the S&P 500 moved down more than 4% and then rebounded to close up on the day. 12 times the market fell 3.5% or more to rebound – events listed below. On average the market rallied in the subsequent few days, but looking out a month the results turned more bearish.
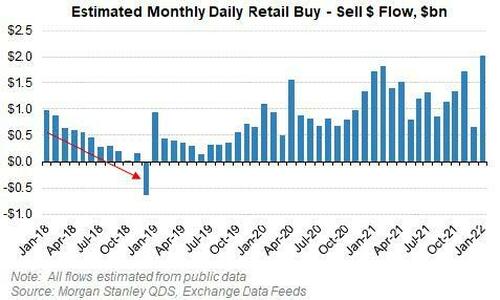
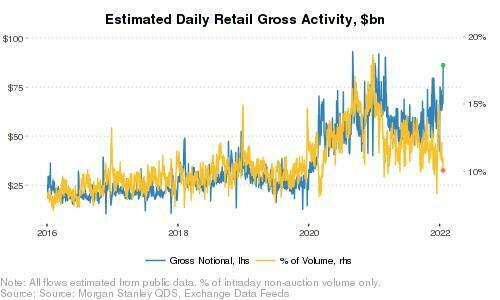
Retail flows remain a wildcard. By midday, retail had sold $3bn on QDS estimates – and the only other periods with such aggressive selling were December 2018 and March 2020. But in contrast to 2018 and 2020, retail turned it around and bought $2.7bn in the afternoon – there have only been 2 other times when net buying between 12:30pm and the close has surpassed ~$2.5bn. Despite the spike in retail activity, retail’s share of market volumes have still fallen.
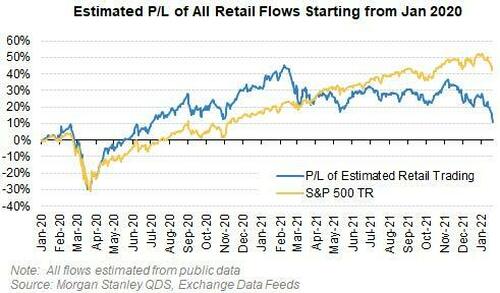
Still, retail remains an important driver in QDS’s view, and commonly asked question was “how much could retail have to sell?” and “how long will retail selling likely persist?” Retail flows remain hard to predict, but for context retail bought an estimated of $25bn YTD on QDS estimates ahead of the recent selloff, with likely $300bn of ‘above trend’ purchases since COVID. It’s unlikely more than a small portion of that would be reversed though – the only time retail consistently sold equities on QDS estimates was in Dec 2018, with $15bn in supply. While Dec 2018 is becoming an increasingly comparable macro period (‘growth scare + Fed on autopilot’), for retail the driver now is deteriorating P/L (-12% YTD on QDS estimates), while then it was that retail likely had to sell stock before year-end. But if the Dec 2018 similarities continue, $15bn to $30bn of retail selling is likely a reasonable handle for the potential supply (on QDS’s model, which likely captures ~50% of total retail flow, so true numbers are ~2x higher).
Systematic supply should be limited going forward – for now. QDS estimates systematic macro strategies (Vol Target Funds, Risk Parity Funds, and Trend Following CTAs) will have equity supply of $15-20bn over the next week ($3-4bn / day). But had SPX closed on its lows down ~4%, QDS estimates the group would have had at least ~$90bn of equity supply over the coming week. Most of the forecast supply comes from CTAs as many short momentum triggers are now being hit, with ~50% of QDS’s CTA models are still long SPX and NDX futures as longer-term trend signals are still positive. But vol target funds have not delevered much yet, meaning they remain a future risk.
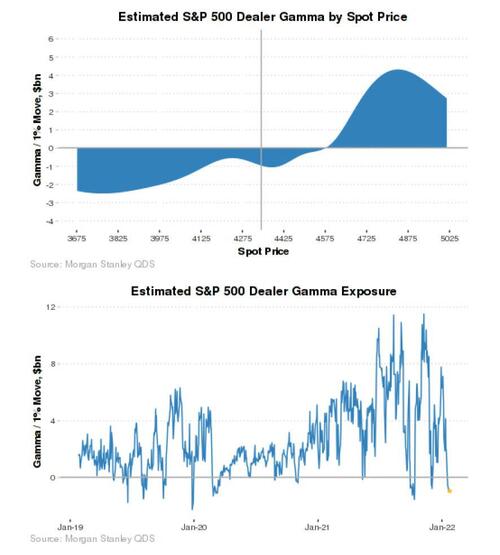
Dealers remain slightly short SPX option gamma, short ~$1bn of gamma / 1% move in SPX on QDS estimates (the 2nd %ile since 2019). This has left the market more free to move intraday, versus a few weeks ago when dealers were buying several $bn of equities on each 1% dip in the market, contributing to high levels of intraday volatility. This also allows the market to ‘gap’ more intraday – seen by S&P 500 intraday autocorrelation rising over the last two weeks to the most positive it’s been since April 2020 (positive autocorrelation = prices trend in the same during the day rather than exhibiting mean reversion from one second to the next).
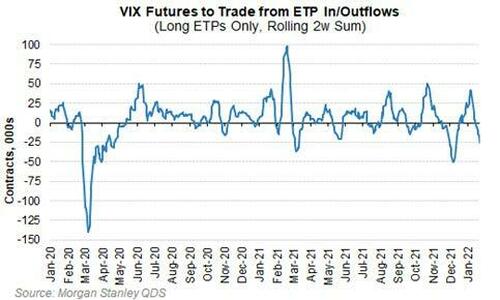
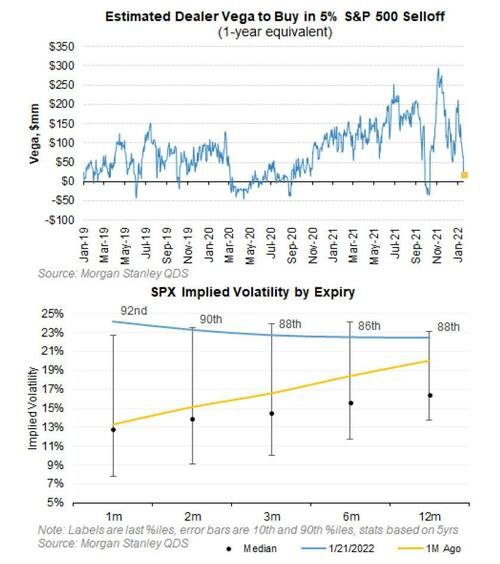
VIX briefly gapped higher – but future prospects for a sharp vol spike are hard from current levels. While VIX ended the day up only 1 point, at its peak today, VIX hit nearly 39 before resetting lower by ~9 points. This is a stark difference to its lack of reactivity in the last few weeks, which was a result of a lack of demand for customer hedges combined with outflows from long VIX ETPs of ~25mm of vega (10th %ile since 2020 and the 4th time since 2020 that two week vega supply has exceeded those levels). Monday’s price action was different though – at its peak, VIX squeezed higher at a ratio of ~2.5 points per 1% move in SPX, likely a function of market makers that are short vega. But those short vega positions do not grow in a further selloff, which should make it harder for vol to spike sharply from here.
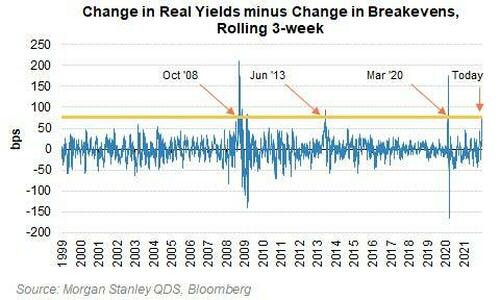
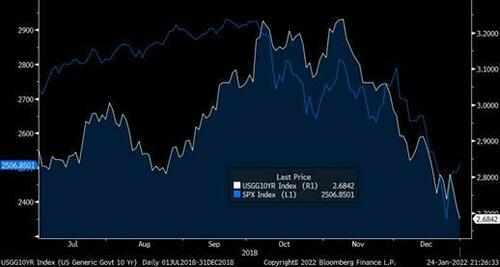
Finally, and most importantly, what does the market need to move sustainably higher? The Fed or rates are unlikely to be the catalyst in QDS’s view – economic growth concerns need to be alleviated. A Fed that is not-too-hawkish could drive another bounce, but near-term, earnings and future growth expectations will likely dictate the direction of the market. While the market volatility started because of the Fed and rates, it is now more about growth – playing out in the rates market where 10 year real yields are up by over 50 bps over the last 3 weeks, while 10y breakevens are down by more than 25 bps – an event that has only happened before in Oct ‘08, March ‘09, June ‘13, and March ’20. From here, rangebound or even lower yields aren’t necessarily going to be bullish for stocks – stocks and yields are following the typical pattern of a growth shock – it starts out with yields higher + equities higher, then initially yields higher + equities a little lower, then as equities start to really move lower bonds get bid from the flight to safety – just like they did in 4Q18.
d
d
Tyler Durden
Tue, 01/25/2022 – 14:23
via ZeroHedge News https://ift.tt/3g27orW Tyler Durden
