Here Is What’s Behind Today’s Stunning Payrolls Beat
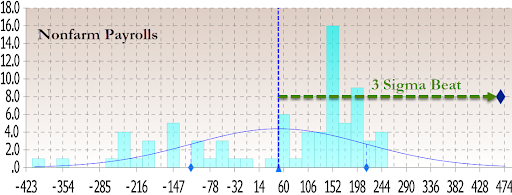
For those who only look at headlines, today’s payrolls report was a veritable shock: coming in at 467K, it was almost 4x the consensus median expectation of 125K, and was orders of magnitude above Goldman’s forecast of -250K. Putting the stunning, 3-sigma beat in context, it came above all 78 estimates, and was more than double the highest forecast of 225K from HSBC. Even more ludicrous were historical adjustments which saw December increased from 199K to 510K, November from 249K to 647K and so on.
How is that possible?
After all even CNBC – while interviewing labor secretary Marty Walsh – couldn’t believe the BLS data, prompting the secretary to repeat on many occasions that the numbers are “credible” and he “stands behind them” and of course he will: after all, taken at face value the numbers signal a resilient labor market and demand for workers despite omicron’s hit. The gains were broad-based, spanning retail, hospitality, transportation and warehousing, business services and others. In short, contrary to data from even the Atlanta Fed whose GDPNow shows Q1 GDP rising just 0.1%, the labor data indicates an economy firing on all cylinders and growing strong.
But is that true?
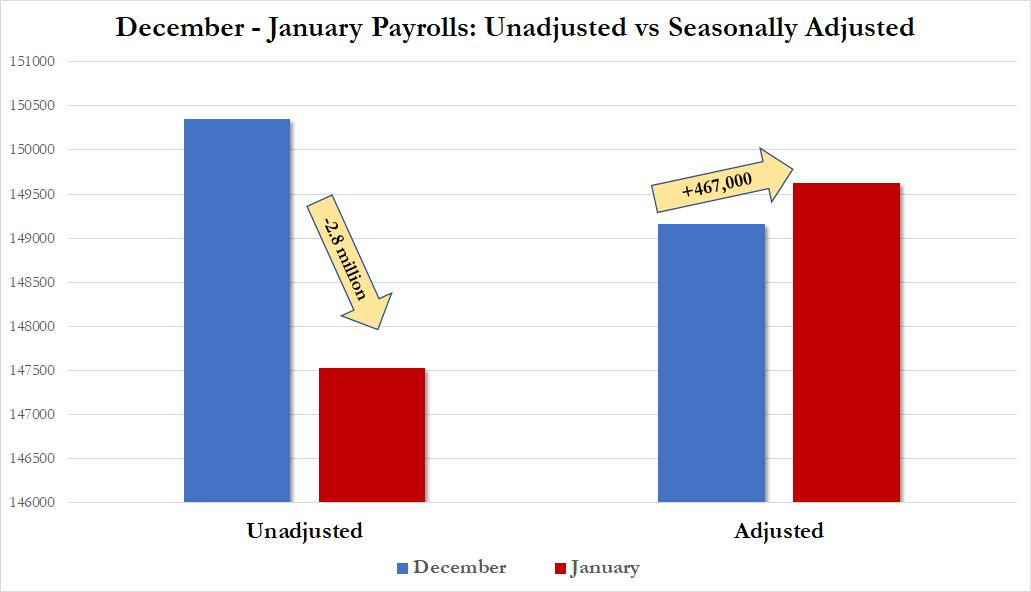
Well, here’s what happened. First, looking at just the December to January change we find that while the seasonally adjusted number rose by an impressive 467K, the unadjusted number collapsed, tumbling from 150.349 million to 147.525 million, a 2.8 million drop!
The plot thickens, and indeed, one thing that analyst apparently forgot when they were submitting their forecasts for January’s payrolls is that this is the month when the BLS adjusts data for the past 10 years as part of its population estimates revisions, which impact both the Household and more important, Establishment, surveys.
In summary, what these revisions did was to revised 2017 job growth lower by by -61,000, 2018 lower by -26,000, 2019 revised lower by -43,000, while 2020 was revised higher by 124,000, and 2021 was also revised up 217,000, or in total a 211,000 upward revision over 5 years or 3,500 jobs per month.
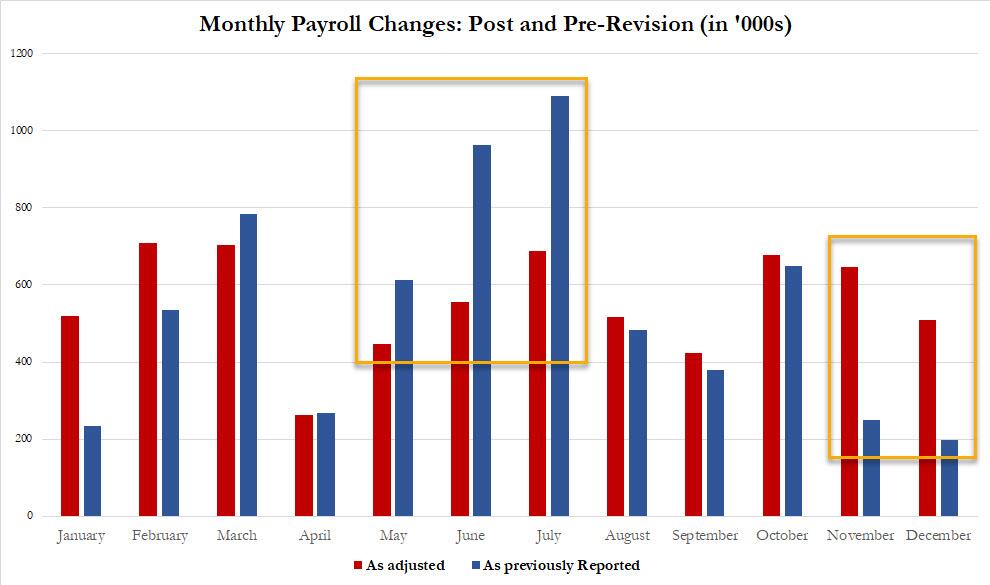
Focusing on just 2021, we find something curious: the stunning print from the summer which saw June and July print at or over 1 million, have been slashed by almost 50%, at the expense of most recent months such that October added 29K, November added 398K and December added 311K jobs to what was the original print only as a result of seasonal adjustments. Said otherwise, March-July was revised lower by -1,061,000 while Aug-Dec was revised up by +817,000.
At this point the answer what is behind the massive January beat should be becoming clear: how did a -2.8 million actual drop in jobs translate into an adjusted 467K? If you said seasonal, covid and population control adjustments, you are right. And to be sure, this is something both we and others flagged, when we lamented that month after month, the BLS appeared to be using stale seasonal adjustments.
But digging deeper shows that this was not just an ordinary seasonal adjustment.
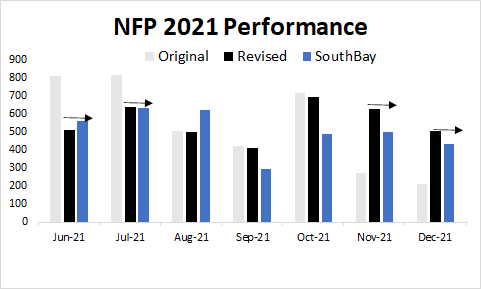
As SouthBay Research notes in his NFP postmortem, “there has never been a January Seasonal Adjustment of this magnitude” and visually:

If only normalizes the January seasonal adjustment, the payrolls number is some 309K lower, or ends up being 166K, right on top of expectations.
The seasonal adjustment for Private payrolls was even more ridiculous:
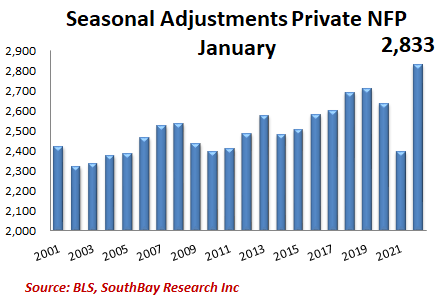
Where it gets even more bizarre, is that as SouthBay notes, January’s Private NFP (NSA) of -2391K was almost exactly the 10-year and 20-year median 2384K. So why the BLS is applying such a grotesque seasonal adjustment to it, is unclear (actually, if one assumes that the Biden admin tapped the BLS secretary on the shoulder, then it is very clear).
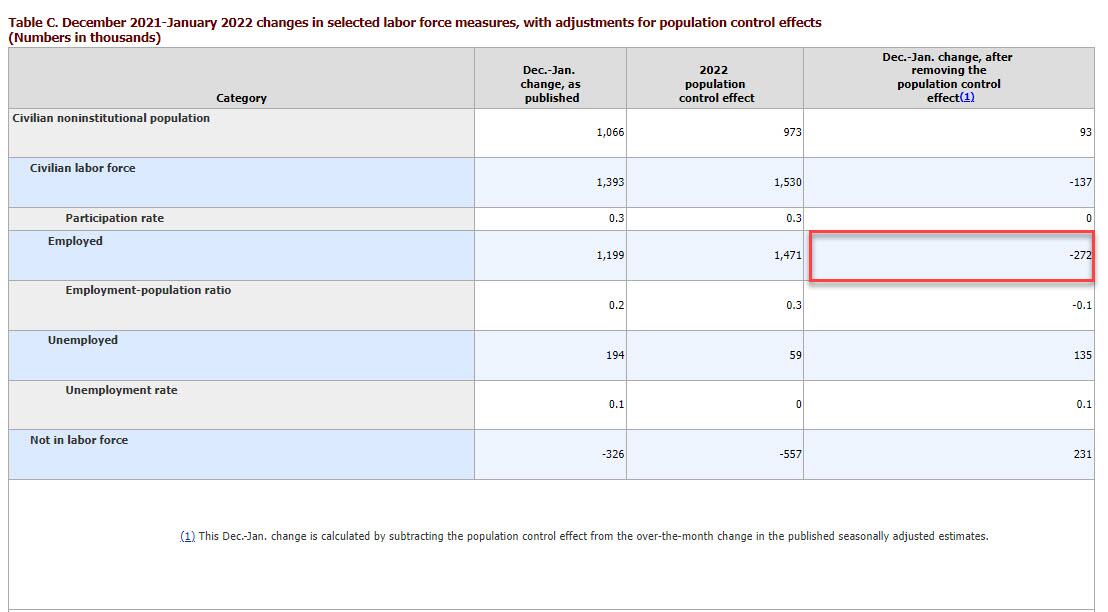
It’s not just outside analysts who reach this conclusion: in Table C to its report, the BLS showed “December 2021-January 2022 changes in selected labor force measures, with adjustments for population control effects” and confirmed that if one had used an apples-to-apples basis for the January numbers, the number of Employed workers (from the Household Survey) would be down -272K. Instead, thanks to the population control effect adjustment of 1.471 million, the final number was 1.199 million!
In summary, while the markets had been trading for months on fake data when the BLS failed to catch up to covid reality, and was applying stale seasonal adjustments, they are doing so again today, only in the opposite direction with the BLS now overextending itself in the opposite direction, with a January seasonal adjustment that has never been greater!
So for those who feel like discounting the Seasonally Adjusted data, please do: the bizarre Seasonal Adjustment that created distortion and distorted the underlying trend for much of 2021 is back, only now it’s in the other direction.
What is the take home message? It’s two fold:
- First, we can effectively ignore covid’s effect going forward. As Southbay notes, “It would appear that COVID is no longer a brake on employment or on the economy” which is good news: the end of the artificial covid restrictions couldn’t come too soon.
- Second, while the January report was stellar, its all downhill from here, because “January’s win is a loss for February payrolls” or put otherwise, this month’s strong payrolls will come at a price: i) Seasonal Adjustment will unwind – reducing payrolls in future months and ii) Seasonal workers will be laid off, resulting in a roughly 100K downside to February and/or subsequent months.
Tyler Durden
Fri, 02/04/2022 – 10:18
via ZeroHedge News https://ift.tt/2S8EXi3 Tyler Durden