Mish: The Technical & Fundamental Case For Buying 10-Year Treasuries Now
Authored by Mike Shedlock via MishTalk.com,
An interesting Tweet came my way yesterday on the technical case for treasuries. Let’s compare the technical case to the fundamentals.
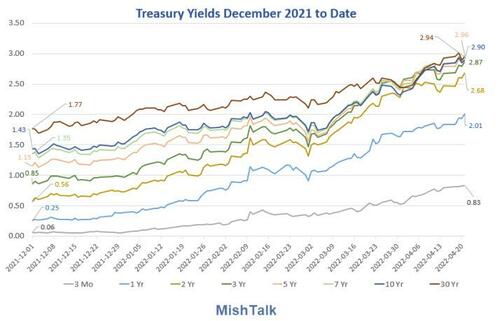
US Treasury Yields from New York Fed, chart by Mish
Chart Comments
At first, second, and possibly even third glance that chart is a total disaster for long-dated treasury buyers.
At the long end of the curve, bond buyers gain as yields declines. Those buying 3-month or even some mid-term bonds cheer the rise in yields, but those holding 10-year or 30-year bonds have been hammered.
Technical Case
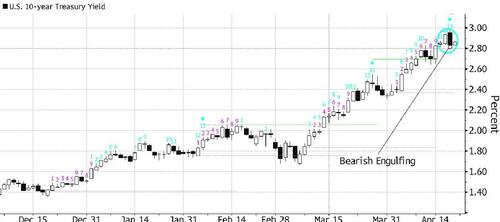
$TNX is printing just about every available upside exhaustion count on daily & wkly timeframes. Monthly has still a bit to go, but it’s about to hit TDST Level Up (3.041).
Even if rates r at the beginning of 40yr upside cycle, I doubt this move won’t retrace some.$ZN_F $SPY $QQQ— FZucchi (@FZucchi) April 19, 2022
$TNX is the 10-year Treasury.
-
$TNX is printing just about every available upside exhaustion count on daily & weekly timeframes. Monthly has still a bit to go, but it’s about to hit TDST Level Up (3.041).
-
Even if rates are at the beginning of 40yr upside cycle, I doubt this move won’t retrace some.
Fil Zucchi is a straight shooter, not a permabear or permabull on anything. TDST is a DeMark technical analysis term.
In general, DeMark looks for trend exhaustions. Fil notes exhaustion counts on daily and weekly terms.
Misunderstanding Technical Analysis
Although there are implied targets on some TA patterns, they should not be considered predictions. Nor does TA assign probabilities.
Rather, the primary purpose of TA is to provide a safe entry where one can set a stop nearby that won’t get whipsawed in normal volatility.
Moreover, in bull markets, bearish patterns are highly unreliable, often blasting to new highs. The reverse is true in bearish markets, where bullish patterns and counts fail most of the time.
Thus Fil’s caution, “Even if rates are at the beginning of 40yr upside cycle, I doubt this move won’t retrace some.”
What About Inflation?
Please don’t tell me about inflation because literally everyone is discussing it, including me.
There’s not a lot of money to be made on something that’s been on the cover of the Wall Street Journal every day for months (except perhaps betting against it, with obvious risks until the trend changes).
Fundamentally, Where Are We?
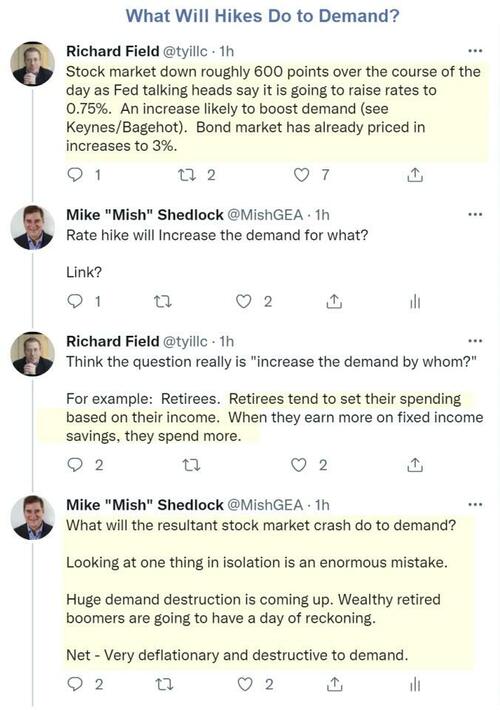
To answer that question we need to understand demand and what rate hikes are likely to do to demand.
Tweet Chain Discussion On Demand
Income may rise for those heavily in bonds, However, what about losses?
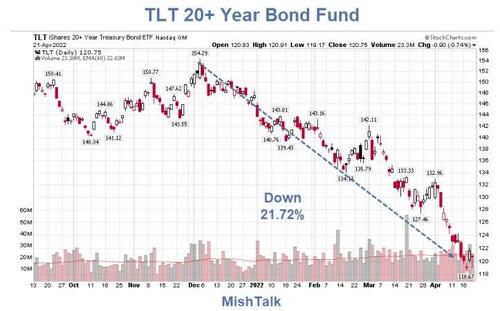
TLT 20+ Year Bond Fund
TLT chart from stockcharts.com, annotations by Mish
Long dated bond holders are now making 3% on their portfolio. Hooray! But the value of their holdings are down nearly 22% in four months.
Bond Bulls? Why Now?
To understand the case for bonds, we must first understand the stock market picture.
Let’s start with a real disaster case, then discuss the S&P 500.
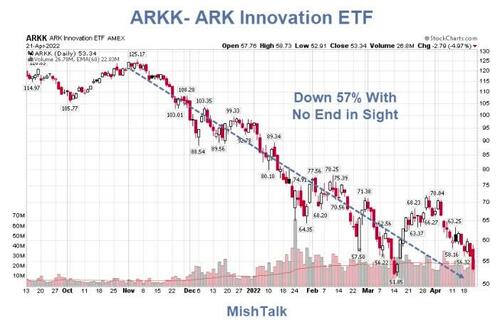
ARKK – ARK Innovation ETF
ARKK chart from stockcharts.com, annotations by Mish
Anyone in that basket of innovative garbage had a nice wealth impact in 2021. The wealth impact has now vanished to say the least.
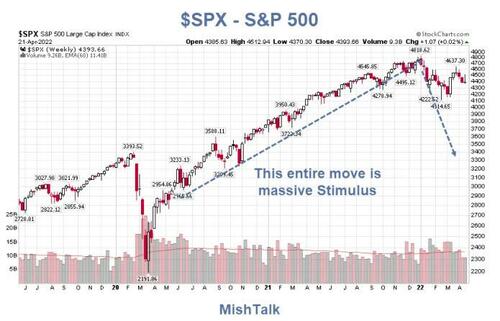
S&P 500 Weekly
$SPX chart from stockcharts.com, annotations by Mish
That entire move, and then some, is the result of insane amounts of Fed stimulus followed by three rounds of fiscal “free money” stimulus from Congress.
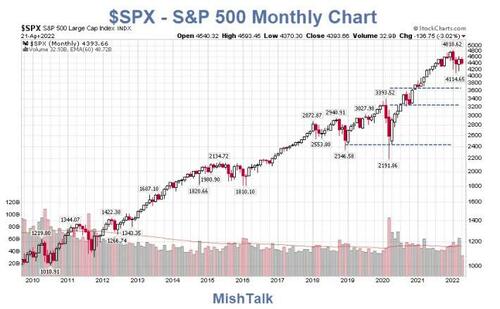
A monthly chart puts things in better perspective.
S&P 500 Monthly Chart
$SPX chart from stockcharts.com, annotations by Mish
We have had reckless amounts of fiscal stimulus for over a decade.
The dotted lines represent technical support levels. But recall what I said above about TA patterns.
The key point here is that “support” fails in bear markets while resistance fails in bull markets.
Take a look at the ARKK chart to see what I mean. ARK bounced a whopping 39% off monthly support in mid-March. That entire gain has now been wiped out.
It’s now back at support, with every technical (and I believe fundamental) reason to fail.
S&P 500 Support Levels and Percent Decline From the Top
-
3600 – 25%
-
3200 – 34%
-
2400 – 50%
-
2000 – 58%
I am confident 3600 will not hold. But even if it did what would the wealth impact have on demand destruction?
The minimum decline I see from the top, based on valuation, is 50%. With that decline on the S&P 500 the more speculative Nasdaq will be down 70% or so and things like ARKK 90% or so.
Blame the Fed for hiking or for blowing bubbles. It’s irrelevant, but bubbles is the best blame.
Hikes undoubtedly will reduce demand for housing, equities, and NET demand in general.
Market this year is barely a down payment
A 30% market decline from here, minimum, is likely.
— Mike “Mish” Shedlock (@MishGEA) April 21, 2022
Demand Destruction
There will be far less retirement spending as a result of Fed actions.
Expecting an increase in spending with stock market stumbling and boomer retirements soaring is economic Fantasyland.
— Mike “Mish” Shedlock (@MishGEA) April 21, 2022
A Word of Caution From Lacy Hunt on Inflation, Treasury Yields, Wages
I discussed the problem for the Fed yesterday in A Word of Caution From Lacy Hunt on Inflation, Treasury Yields, Wages
Hobson’s Choice
The Fed has a Hobson’s Choice. What decision will it make?
I do not believe anyone knows, including the Fed. A volatile bond market is the current result.
Making matters extremely difficult for the Fed is the simple fact that much consumer demand is inelastic while hikes are a very blunt instrument.
I expect a hard landing. And slower hikes, even 50 basis points a pop, will have a bigger negative impact on the stock market than getting it all done at once.
Will Housing Crack?
Some do not expect housing to crack. I am not one of them but here’s the discussion.
Yes – but what were home prices in 2008 and what are they now?
Let’s checkhttps://t.co/sAfNndzr5I https://t.co/1JAyDklpBB
— Mike “Mish” Shedlock (@MishGEA) April 21, 2022
Housing Shortage
Hikes may be faster but if there is a genuine shortage of houses as some believe, then what about rent?
Hikes will undoubtedly kill existing home sales. But in the process, rate hikes will impact construction of all kinds, including multi-family.
So what will that do to rent prices?
In the Fed’s ridiculous inflation model, rent impacts inflation while home prices do not.
This is another blunt impact the Fed and market participants have not thought through. Like 2007, the Fed will not see it until there is a recession.
Spotlight on the Previous Housing Bust
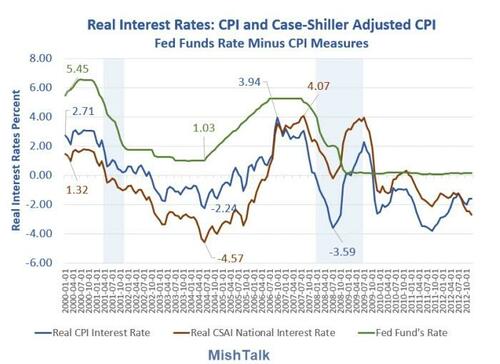
Real Interest rates via Mish Calculation
Real interest rates were -4.57% factoring in housing. When the bubble burst the Fed went from being way behind the curve to well in front of the curve to quickly behind the curve again after the Fed slashed rates to zero.
The Fed Searches For the Neutral Interest Rate, Where the Heck Is It?
I discussed the above chart in detail in The Fed Searches For the Neutral Interest Rate, Where the Heck Is It?
Neutral is Constantly Changing
My message is the same today as it was in 2006. Another deflationary bust is coming.
The Fed will not see it because it clueless not only about where neutral is, but also because the Fed is clueless about the asset bubble boom-bust cycles that it is perpetually blowing.
Given the massive amount of debt and leverage, neutral is likely far lower than most presume.
Meanwhile, the asymmetric policy of the Fed continually adds to the problem. Look again at my previous chart to see what’s happening.
If I am correct, betting on long-durations bonds at these prices will be a winning bet by the end of the year.
Is the 40-Year Bond Bull Market Over?
I believe the long secular bull market is over. However, that’s a complex discussion that requires analysis of short- mid- and long-term inflationary and deflationary forces.
That will be the subject and title of an upcoming post.
For now, the demand destruction from a stock market crash will overpower any inflationary forces.
With that, let’s return Lacy Hunt’s most recent outlook as discussed yesterday in A Word of Caution From Lacy Hunt on Inflation, Treasury Yields, Wages
“At this current level, the long-end treasury market has value considering the impending recessionary conditions which have always reduced inflation and interest rates. However, should the Federal Reserve cease in their efforts to calm inflation before it has been fully restrained, bond investors should be wary,” said Lacy hunt.
Spotlight on Now
Technically and fundamentally one needs to overlook front page news on inflation and instead put a spotlight on the massive demand destruction from the upcoming recession.
It’s important to understand that asset bubble pops are hugely deflationary.
Looking further ahead, we will then need to see how the Fed reacts or overreacts yet again to promote a recovery from the recession and bubble largely of its own making.
* * *
Tyler Durden
Fri, 04/22/2022 – 15:26
via ZeroHedge News https://ift.tt/MGoNx2V Tyler Durden
