Global Breadth Signals Major Double-Top For Stocks, Here’s What Levels To Watch For Next
The S&P 500 is down five straight weeks… it can’t fall again right? This must be a buying opportunity right?
Unfortunately, the data says the S&P can still continue to struggle even after weeks of failure.
As BofA’s Stephen Suttmeier writes in his latest note, this is the 41st time – going back to 1928 – that stocks have suffered a 5-week losing-streak.
This scenario shows more robust SPX forward returns for the following week but much less vigorous returns going out two weeks to 52-weeks after the signal. The 8-, 13- and 26-week periods show negative average and median returns after the SPX is down for five weeks in a row.
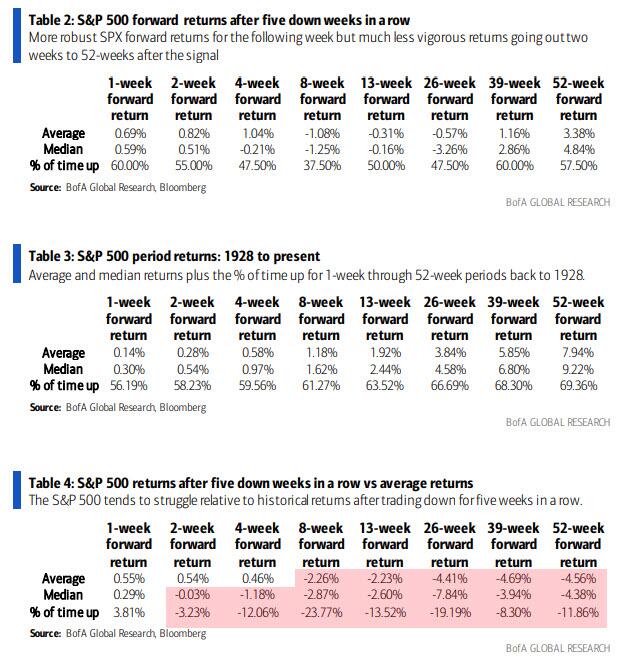
This confirms the seasonality risk for 2Q and 3Q during the midterm year of Presidential Cycle.
On an even longer-term basis, the weekly global A-D line of 73 country indices may have double topped within a mature bullish cycle…
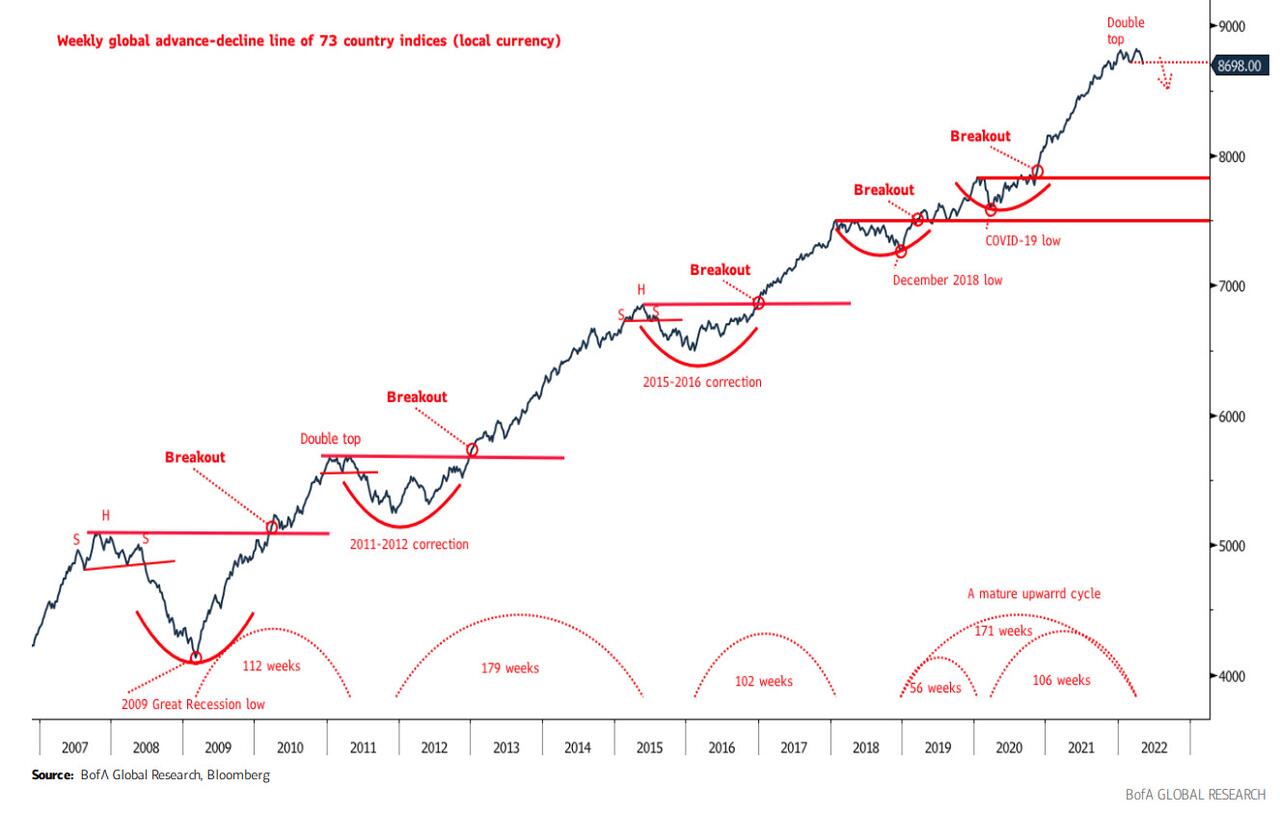
Strongly suggesting more downside. So what are the levels to watch for the S&P 500 in the short-term?
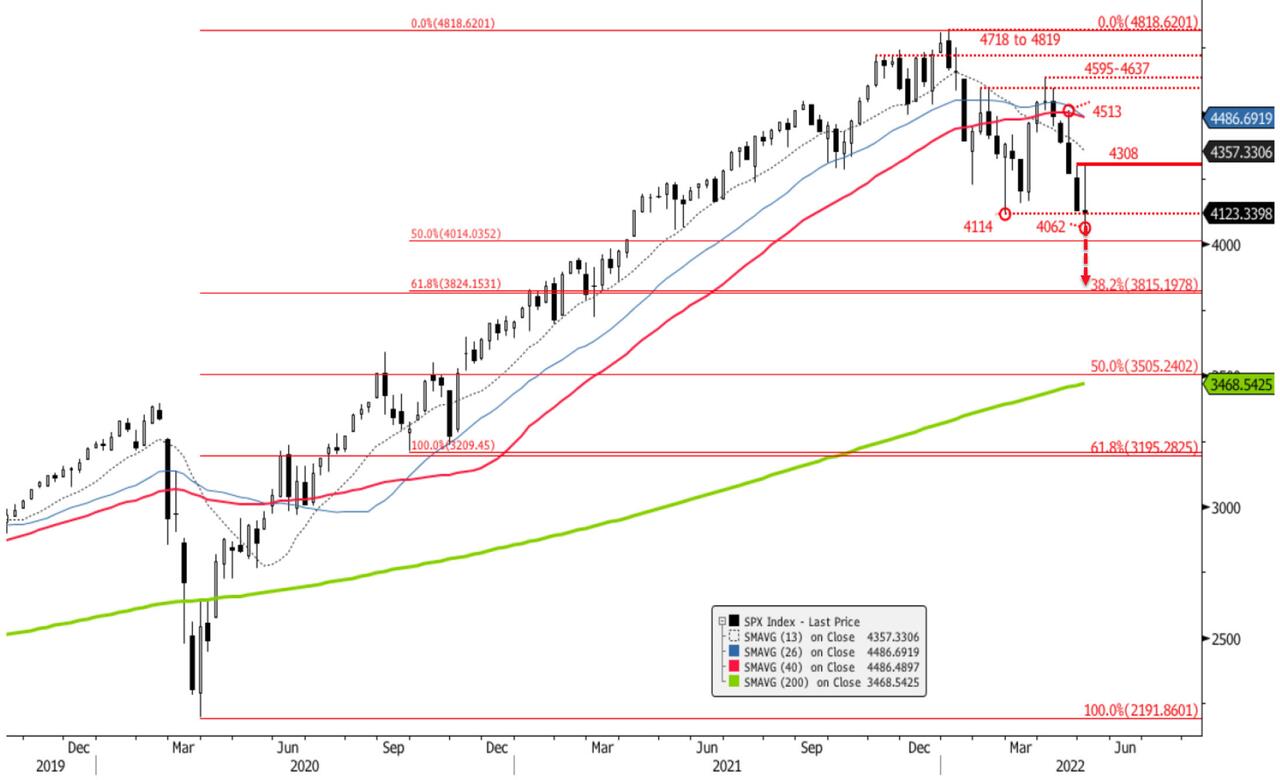
As Suttmeier noted earlier in the week, with the S&P below first resistance at 4308, the risk is for a deeper decline to longer-term retracements levels from 4014 to 3824-3815. A drop into the 3800s would be consistent with the average and median midterm election year drawdowns for the SPX.
If the SPX musters the strength to clear 4308 resistance, the potential is for a stronger rally within the 2022 corrective phase. The next levels to watch are 4357 (declining 13- week MA), 4486-4487 (declining 26- and 40-week MAs), 4513 (4/21 peak), and 4595- 4637 (February and March highs).
Tyler Durden
Wed, 05/11/2022 – 14:24
via ZeroHedge News https://ift.tt/f9TOotr Tyler Durden