US Pending Home Sales Are Down Most Since 2011 YoY (Ex-COVID)
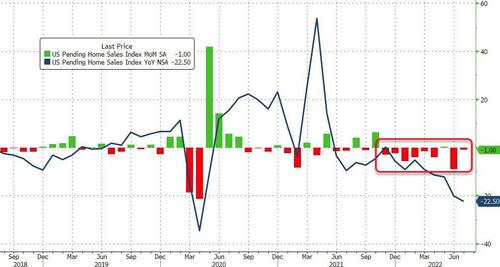
After yesterday’s dreadful collapse in new home sales (and Toll Brothers’ less than rosy picture overnight), analysts expected another monthly decline in pending home sales in July (though not as violent as the June plunge). They were right as pending home sales dropped 1.0% MoM (beating expectations of a 2.6% drop but that was largely driven by a downward revision for June data)…
Source: Bloomberg
This is the 8th monthly drop in the last 9 leaving sales down 22.5% YoY. Aside from the COVID lockdown, this is the biggest YoY drop since April 2011
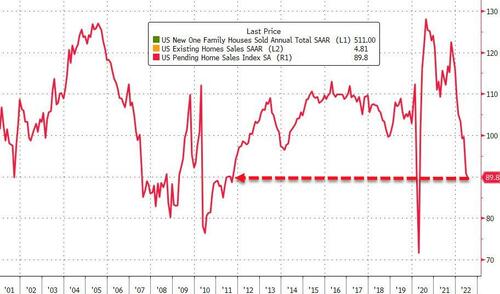
Aside from the COVID lockdown crash, this is the weakest Pending Home Sales Index level since Oct 2011
Source: Bloomberg
The monthly bill on a typical home with a 20% down payment rose to $1,841 in the second quarter, according to a separate NAR report out earlier this month. That’s up 32%, or $444, from the first quarter and a 50% jump from a year earlier.
“This month’s very modest decline reflects the recent retreat in mortgage rates,” Lawrence Yun, NAR’s chief economist, said in a statement.
“Inventories are growing for homes in the upper price ranges, but limited supply at lower price points is hindering transaction activity.”
Contract signings decreased in three of four regions, led by a 2.7% drop in the Midwest. Pending home sales rose in the West.
Pending home sales are often looked to as a leading indicator of existing-home purchases given properties typically go under contract a month or two before they’re sold.
Is this what Mr. Powell wanted?
Tyler Durden
Wed, 08/24/2022 – 10:05
via ZeroHedge News https://ift.tt/tYoX29Q Tyler Durden

