Q4 GDP Stronger Than Expected Due To Surge In Inventories, Offsetting Drop In Personal Consumption; Sets Up Negative Q1 Print
The Biden admin has picked a “soft landing” narrative as the hill it will die on, and it will hold on to its until the last possible moment, damn it.
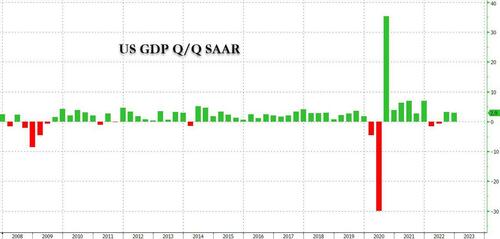
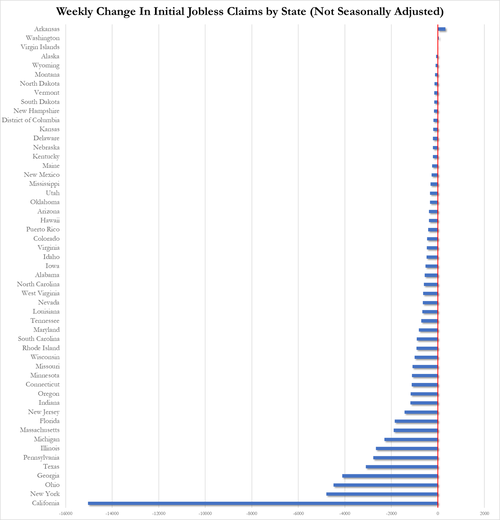
Moments ago, alongside other strong macro data, including blockbuster initial jobless claims which were driven by a Bizarro plunge in California initial claims, and stellar Durable goods propelled higher by a freak number of near-record non-def aircraft orders in December, the BEA reported that in Q4, US GDP rose by a stronger than expected 2.9% (or 2.880% to be precise), a modest drop from the 3.2% in Q3 and well above consensus estimates of 2.6% (where the range was from 1.2% to 3.9% from 73 economists).
The fourth-quarter increase in real GDP reflected increases in inventory investment, consumer spending, government spending, and business investment that were partly offset by decreases in housing investment and exports. Imports, which are a subtraction in the calculation of GDP, decreased.
- The increase in private inventory investment was led by manufacturing (mainly petroleum and coal products as well as chemicals) and mining, utilities, and construction industries (led by utilities).
- The increase in consumer spending reflected an increase in services (led by health care, housing and utilities, and “other” services) and goods (led by motor vehicles and parts)
- The decrease in housing investment was led by new single-family housing construction and brokers’ commissions
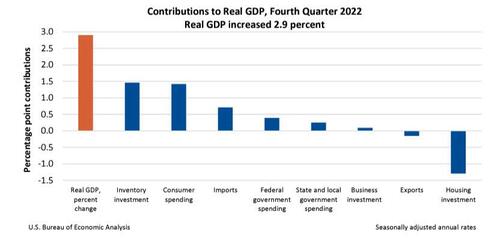
Looking at a breakdown of components as a portion of the bottom line GDP number we get the following:
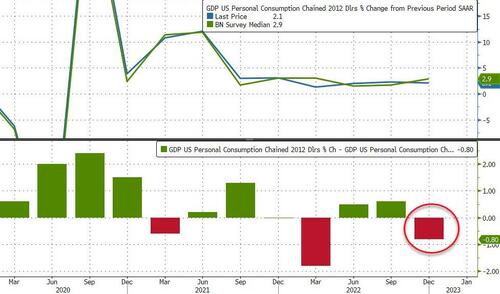
- Personal consumption accounted for 1.42% – or half – of the bottom line 2.880% GDP number; this was below last quarter’s 1.54% and came in below expectations; on an annualized basis PCE was 2.1%, well below the 2.9% expected, and down from 2.3% in Q3.
- Fixed Investment shrank by another 1.20%, continuing a trend started in Q2, when it shrank -0.92% and followed with a -0.62% drop in Q3. Nonresidential fixed investment, or spending on equipment, structures and intellectual property rose 0.7% in 4Q after rising 6.2% prior quarter
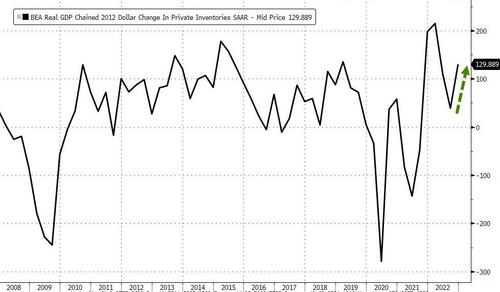
- The change in private inventories was a surprising boost to the bottom line, adding 1.46%, a reversal from the declines in the prior three quarters (in Q3, it dropped -1.19%). It appears that the inventory destocking/liquidation is now over.
- Exports declined a modest -0.15%, a big drop from the 1.65% increase in Q3, while imports rose 0.71%, also below last quarter’s 1.21% increase.
- Finally, government consumption was unchanged Q/Q, and printed at 0.64% vs 0.65% in Q3.
And a visual summary of all the components:
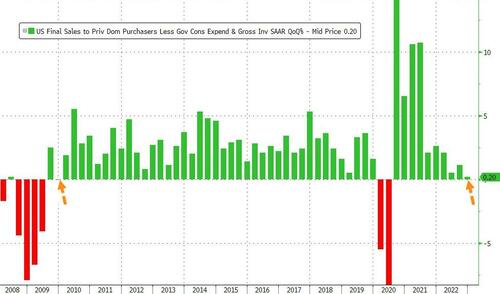
On the other hand, just like economists ignored much of the weak H1 2022 GDP data they should also look at H2 GDP on the same basis, and here when one uses Real Final Sales to Private Domestic Purchasers – which strips out things like trade and inventories- we get a far worse number of just 0.2% in Q4. This was the lowest print since the covid crash!
Even Fed Mouthpiece Nick Timiraos is bringing attention to this series:
Looking under the hood of the Q4 GDP report:
A broad measure of U.S. economic demand—real final sales to private domestic purchasers, which excludes trade, inventories and government spending—increased at a 0.2% rate in the last quarter of 2022 https://t.co/gts5BFL9oT
— Nick Timiraos (@NickTimiraos) January 26, 2023
Elsewhere, real disposable personal income (DPI) – or personal income adjusted for taxes and inflation – increased 3.3% in the fourth quarter after increasing 1.0% in the third quarter. This is not to be confused with real weekly and hourly earnings which remain deeply negative as a result of wages rising far below the rate of inflation for a record 21 months.
Current-dollar DPI increased 6.5% in the fourth quarter, following an increase of 5.4%. The increase in current-dollar DPI for the third quarter primarily reflected increases in compensation and personal current transfer receipts. Personal saving as a percentage of DPI was 2.9 percent in the fourth quarter, compared with 2.7 percent in the third quarter
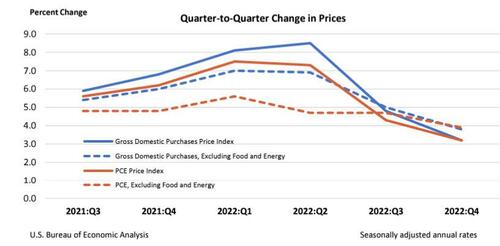
Finally, looking at what is arguably the most important number in today’s GDP print, gross domestic purchases prices, the prices of goods and services purchased by U.S. residents, increased 3.2% in the fourth quarter after increasing 4.8% in the third quarter. Excluding food and energy, prices increased 3.8% after increasing 5.0%.
And linked to this, the price index – closely watched by the Fed – rose 3.5% in 4Q after rising 4.4% prior quarter, while the core PCE rose 3.9%, in line with expectations and below the 4.7% in the prior quarter. In other words, inflation is no longer a factor for the Fed and is expected to slide sharply in the coming months as the Fed keeps rates around 5%.
Several observations from this data: despite some weakness in Q4, the data was generally of a soft-landing, or Goldilocks, nature. This is good news for markets and for Powell, who can continue taking the foot of the gas pedal as he is expected to do with a 25bps hike next week.
On the other hand, while US GDP exceeded expectations by growing 2.9%, underlying private domestic demand was quite weak, coming in below consensus at 2.1% which however is likely enough to delay recession expectations to the back half of the year, when employment will be the last economic metric to break. The combined contributions of household consumption, capex, and residential investment was just 0.22% — the lowest since the second quarter of 2020. At the same time, inventories and exports contributed a combined 2.2%, so this figure was essentially the negative image of the first half of the year, when strong demand was offset by those more ephemeral components.
Finally, talking of pivots: the inventory liquidation ended in Q3 and in Q4 inventories rose again. This means that in Q1 inventories will now slide again, pushing GDP negative. Here is CIBC economist Katherine Judge who sees the potential for a decline in GDP in the current quarter, partly thanks to the build-up in inventories:
“With inventories now elevated across many industries, and consumers running through excess savings, we see the potential for a contraction in the economy in the first quarter as the impact of past rate hikes materializes more fully, and consistent with a tapering off of momentum in recent monthly indicators.”
As Bloomberg summarizes, it paints a picture of an economy that is decelerating, but with firms (in aggregate) still hungry for labor as today’s claims number showed. This all sets up an interesting contrast, and raises the question of whether it will be underlying domestic demand or labor demand that eventually adjusts.
And while the GDP data was not too surprising, the sharp drop in the initial jobless claims number, which as noted was mostly due to a freak drop in Cali initial claims…
… puts the seasonally adjusted 4-week average less than 30,000 above April 2022 lows. That number was 80,000 in August. In some ways, we’re in a better position now employment-wise than we were five months ago. The Fed has to be worried about this turn of events unless inflation also slows dramatically, as the last thing Powell wants is to be seen doing is cutting rates with the next business cycle beginning with inflation at 3%. A tight labor market could mean inflation never gets down to the 2% target then. That’s exactly why it would take a deep recession to get the Fed to cut in 2023.
Commenting on the data, Stifel economist Lindsay Piegza said that “there was enough resilience in the US economy to maintain positive momentum in Q4. But the bigger question is, are we able to maintain that momentum as we turn the calendar page, and most of the data suggests that we do not.”
Tyler Durden
Thu, 01/26/2023 – 09:18
via ZeroHedge News https://ift.tt/c1QELPK Tyler Durden
