These Were The Best And Worst Performing Assets In February And YTD
After a very strong start to the year for financial markets, February saw much of the early momentum go into reverse, with losses across equities, credit, sovereign bonds and commodities. That, as DB’s Henry Allen explains in his monthly performance review note, came “amidst growing concern about the persistence of inflation, which in turn led investors to ramp up their expectations for central bank rate hikes.” When all was said and done, it was an awful month for bonds, with Bloomberg’s global aggregate bond index experiencing its worst February performance since its inception in 1990 just one month after its best ever January. At the same time, February also marked a recovery for the US Dollar, while European equities proved resilient amidst the broader losses elsewhere. Furthermore, the YTD performance of financial assets is still generally positive, with most of those tracked by Deutsche Bank still higher over 2023 so far.
Below we excerpt from DB’s Month in Review, starting with the high-level macro overview
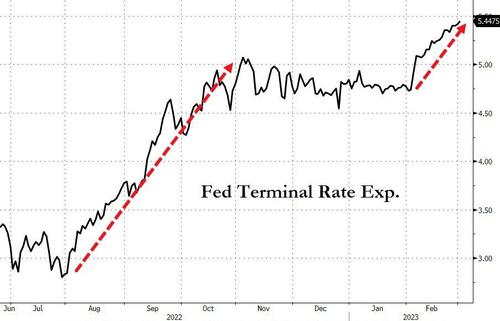
Having just experienced a strong rally in January, the initial mood in markets was pretty positive as February began. However, that all changed on the third day of the month, when the US jobs report for January was released. It showed that nonfarm payrolls had risen by credibility-busting 517k in January, marking the strongest job growth in six months. Furthermore, the unemployment rate fell to a 53-year low of 3.4%. The data raised fears that inflation would prove more persistent than previously thought. This led to a sharp re-appraisal on how fast the Fed would be hiking rates, with futures pricing for the December 2023 meeting up by +22.2bps on the day of the jobs report, and then a further +20.5bps on the following Monday. As of today, the terminal rate has shot up by 60bps in the past month, as more than two additional rate have been priced in.
This positive news on the employment side was then followed by upward revisions to inflation data from late-2022. These showed that CPI had fallen less rapidly than thought over Q4, with the 3-month annualized rate of core CPI in December being revised up from 3.14% to 4.25%. Then we had the January CPI data, where headline and core CPI remained hot, as did the PCE measure closely watched by the Fed.
With stronger data on the labor market and inflation, there was growing speculation that the economy could be in for a “no landing” scenario, rather than a hard or a soft landing. Unlike the hard or soft landing, which both see inflation coming down, the “no landing” would involve inflation remaining high, with growth remaining strong, and the Fed needing to hike rates even further in order to bear down on inflation. By the end of the month, this meant that expectations of the Fed’s terminal rate had risen from 4.92% to 5.42%. And if you look at the rate priced by the December 2023 meeting, it went up from 4.48% to 5.28%, an increase of +80.5bps over the month. Investors’ expectations of inflation also saw a sharp move higher, with the 2yr breakeven up from 2.33% to 3.18% over the month.
This trend wasn’t confined in the United States: In the Euro Area, core inflation rose to a new record of +5.3% in January, and initial country releases for February from France, Spain and Germany are still showing high inflation. Similarly, the latest data shows Euro Area unemployment remaining at a joint record low of 6.6% in December, and there was further support on the growth side as natural gas prices declined a further -18.6%. Meanwhile in Japan, headline and core CPI for January reached their highest level since 1981.
The result of all this was a dramatic slide in global bonds. US Treasuries (-2.4%) suffered their worst monthly performance since September, and Bloomberg’s Global Aggregate Bond Index (-3.3%) saw its worst February performance since its inception back in 1990. Equities also struggled, with the S&P 500 peaking for the month on the day before the jobs report came out, before closing -2.4% lower. However, one of the few assets that benefited from this shift in Fed pricing was the US Dollar, with the dollar index (+2.7%) ending a run of 4 consecutive monthly declines.
Which assets saw the biggest gains in February?
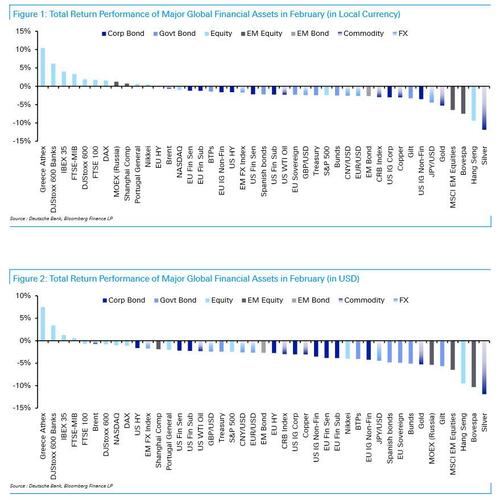
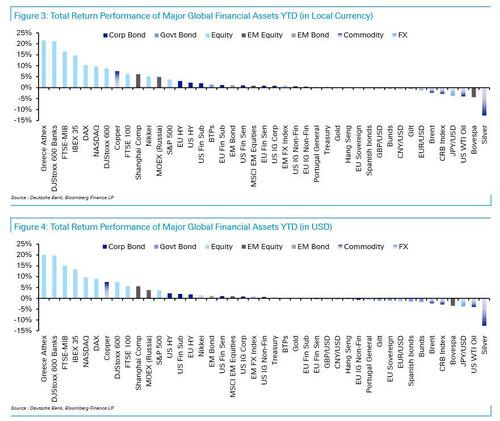
- European Equities: The outperformance of European equities continued into February, with further gains for the STOXX 600 (+1.9%), the FTSE 100 (+1.8%) and the DAX (+1.6%). That leaves European equities as some of the best YTD performers in our sample, particularly in southern Europe. For instance on a YTD basis, there are now double-digit gains for Spain’s IBEX 35 (+14.7%), Italy’s FTSE MIB (+16.4%) and Greece’s ASE General Index (+21.5%).
- US Dollar: After a run of 4 consecutive monthly losses, the dollar index strengthened +2.7% in February. Indeed, it strengthened against every other G10 currency. The Swedish Krona was the next best performer among the G10, only weakening -0.04% against the US Dollar, which followed the Riksbank’s announcement that QT would be starting from April and they expected to raise the policy rate further in the spring.
Which assets saw the biggest losses in February?
- US Equities: Unlike their counterparts in Europe, US equities fell back amidst the prospect of further rate hikes. For instance, the S&P 500 fell -2.4%, the NASDAQ fell -1.0%, and the Dow Jones fell -3.9%. For the S&P 500, that brought its YTD gains back down to +3.7%.
- Sovereign Bonds: The prospect of higher inflation and more rate hikes was bad news for sovereign bonds. US Treasuries (-2.4%) and Euro Sovereigns (-2.3%) gave up most of their January gains, whilst gilts (-3.3%) are now in negative territory on a YTD basis.
- Credit: As with sovereign bonds, it was a rough month for credit. USD credit saw the worst performance on a relative basis, with US IG non-fin down -3.5%. However, EUR IG non-fin was still down -1.6%, and GBP IG non-fin was down -2.8%. HY also outperformed IG, with USD HY only down -1.6%, whilst EUR HY (-0.1%) was only just in negative territory. In terms of spreads, EUR IG (-22bps) and EUR HY (-4bps) tightened over February, as did US HY (-8bps). But US IG (+7bps) saw spreads widen for the first time since September.
- EM Assets: After a very strong performance in January, it was a bad month for EM assets. For equities, the MSCI EM index was down -6.5%. EM bonds fell back too, with a -2.7% decline. And for EM FX, there was a -1.7% decline.
- Commodities: All the major commodity groups lost ground in February. For energy, there were significant declines in European natural gas (-18.6%) along with smaller losses for Brent crude (-0.7%) and WTI (-2.3%) oil prices. Metals struggled too, with copper (-3.0%) and gold (-5.3%) both falling after three consecutive monthly gains. And agricultural goods lost ground as well, with corn (-7.4%) and wheat (-9.2%) posting noticeable declines.
Finally, here is a visual breakdown of the best and worst performing assets in February…
… and YTD.
Tyler Durden
Wed, 03/01/2023 – 15:28
via ZeroHedge News https://ift.tt/e4HcyDS Tyler Durden


