A World Running On Empty: The Decline Of Fossil Fuel Supply
Authored by Gail Tverberg via Our Finite World blog,
-
Analysis of 2023 Statistical Review of World Energy data shows constrained global supplies of fossil fuels like oil, coal, and natural gas, particularly in inter-regional trading.
-
Constraints in supply are affecting energy prices, making them highly variable and less affordable for consumers, thereby affecting the global economy, including industries like manufacturing.
-
The cost-intensive infrastructure needed for long-distance natural gas exports is becoming increasingly unsustainable, posing risks to both investors and consumers.
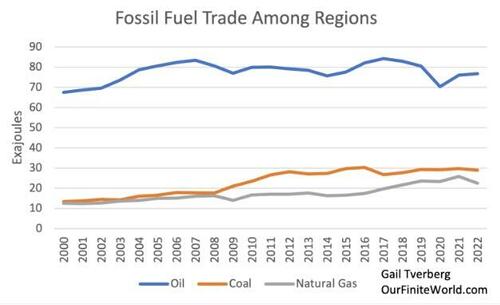
For many years, there has been a theory that imports of oil would become a problem before there was an overall shortage of fossil fuels. In fact, when I look at the data, it seems to be clear that oil imports are already constrained.
Figure 1. Interregional trade of fossil fuels based on data of the 2023 Statistical Review of World Energy by the Energy Institute.
As I look at the data, it appears to me that coal and natural gas imports are becoming constrained, as well. There was evidence of this constrained supply in the spiking prices for these fuels in Europe in late 2021 and early 2022, starting well before the Ukraine conflict began.
Oil, coal, and natural gas are different enough from each other that we should expect somewhat different patterns. Oil is inexpensive to transport. It is especially important for the production of food and for transportation. Prices tend to be worldwide prices.
Coal and natural gas are both more expensive to transport than oil. They tend to be used in industry, in the heating and cooling of buildings, and in electricity production. Their prices tend to be local prices, rather than the worldwide price we expect for oil. Prices for importers of these fuels can jump very high if there are shortages.
In this post, I first look at the trends in the overall supply of these fuels, since a big part of the import problem is fossil fuel supply not growing quickly enough to keep pace with world population growth. I also give more background how the three fossil fuels differ.
After this introductory material, I provide charts and some analysis of fossil fuel imports and exports by region, based on data from the 2023 Statistical Review of World Energy. Theoretically, the total of regional imports should be very close to the total of regional exports. This analysis gives a little more insight into what is going wrong and where.
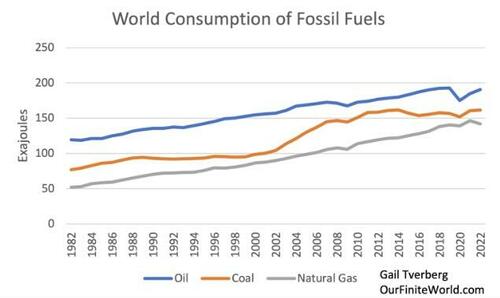
[1] On a worldwide basis, total supplies of both oil and coal seem to be constrained.
Figure 2. World consumption of oil, coal, and natural gas based on data of the 2023 Statistical Review of World Energy by the Energy Institute.
Figure 2 shows that world supplies of all three fossil fuels follow the same general pattern: They tend to rise in close to parallel lines, with oil supply on top, coal next, and natural gas providing the least supply.
The total supply of fossil fuels needs to be shared by the world’s population. It therefore makes sense to look at supply on a per capita basis.
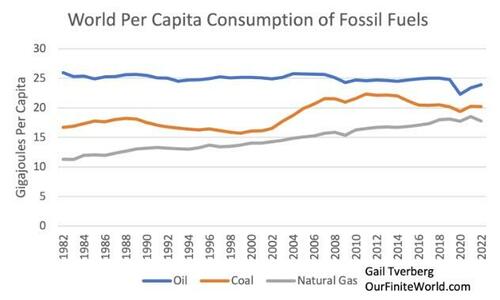
Figure 3. World per capita consumption of oil, coal, and natural gas, based on data of the 2023 Statistical Review of World Energy by the Energy Institute.
On Figure 3, the top line, oil supply per capita, is almost perfectly level, suggesting that having a greater supply of oil enables having a larger world population. This relationship makes sense because oil is used to a significant extent in growing today’s food, and shipping it to market. Oil products also make herbicides, insecticides, and drugs for animals that enable the growing supply of food needed to feed today’s population. Oil products are also helpful in road making, and in providing lubrication for machinery of all kinds.
We might conclude that oil supply is essential to the growth of human population. It is only by way of a huge change in the economy, such as the one that took place in 2020, that there is a big dip in oil usage. Even now, some of the changes are “sticking.” Some people are continuing to work from home. Business travel is still low. People are still not buying fancy clothing as much as before 2020. All these things help reduce fossil fuel usage, particularly oil usage.
Figure 3 also shows that on a per capita basis, coal supply has fallen by 9% since its peak in 2011. This fact, plus the fact that coal prices have been spiking around the world in recent years, leads me to believe that coal supply is already constrained, even apart from the export issue.
[2] The share of oil traded interregionally is more than double the share of coal or natural gas traded interregionally.
The reason why oil is disproportionately high in Figure 1 compared to Figure 2 is because a little over 40% of oil is shipped between regions. In comparison, only about 18% of coal production is traded with other regions, and about 17% of natural gas production is shipped interregionally. Oil is much easier (and cheaper) to transport between regions than either coal or natural gas. Shipping costs tend to escalate rapidly, the farther either natural gas or coal is shipped.
Natural gas has a second problem over and above the high cost of shipping: It requires storage (which may be high cost) if it is not used immediately. Storage is needed for both natural gas and coal because both fuels are often used for heat in winter, either by direct burning or by creating electricity that can be used to heat buildings. Storage for coal is close to free because it can be stored in piles outside.
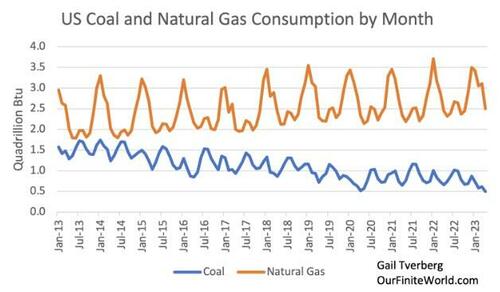
Besides heat in winter, coal is also used to provide electricity for air conditioning in summer, so its demand curve has peaks in both summer and winter. Natural gas is much more of a winter-heat fuel in the US, so it has a large peak corresponding to winter usage (Figure 4).
Figure 4. Coal and natural gas consumption by month based on data of the US Energy Information Administration.
Storage for natural gas needs to be available in every area where users expect to use it for winter heat. The cost of this storage will be low if there are depleted natural gas caverns that can be used for storage. It is likely to be high if above ground storage is required. Natural gas importing areas often do not have suitable caverns for storage. The easy approach is to try to get by with a bare minimum of storage, and hope that imports can somehow make up the difference.
The big question for any fuel is, “Can consumers afford to pay a high enough price to cover all the costs involved in getting the fuel from endpoint to endpoint, at the time it is needed?“
Citizens become very unhappy if the cost of winter heat becomes extremely expensive. They demand subsidies and rebates from the government, in order to keep costs down. This is a sign that prices are too high for the consumer.
Both coal and natural gas are also heavily used in manufacturing. Their prices vary greatly from location to location and from time to time. If coal or natural gas prices rise in a particular location, the cost of manufactured goods from that location will also tend to rise. These higher prices will particularly hurt a manufacturing country, such as Germany, because its manufactured goods will become less competitive in the world marketplace. GDP growth will be reduced, and the profitably of manufacturers will tend to fall.
Because of these issues, long-distance trade in both coal and natural gas tend to hit barriers that may be difficult to see simply by looking at the trend in world production.
[3] Natural gas exports may already be becoming constrained, even though the total amount extracted still seems to be rising.
A huge amount of investment is needed to make long-distance sale of natural gas possible. Such investment includes:
-
The cost of developing a natural gas field for export use, usually over many years.
-
Pipelines covering every inch traveled by the natural gas, other than any portion of the trip for which transfer as liquefied natural gas (LNG) is planned.
-
Special ships to transport the LNG.
-
Facilities to chill natural gas, so it can be shipped overseas as LNG.
-
Regasification plants, to make the natural gas ready to ship by pipeline after it has been transferred as LNG.
-
Storage facilities, so that sufficient natural gas is available for winter.
Not all of these investments are made by the same organizations. They all need to provide an adequate return. Even if “only” very long-distance pipelines are used, the cost can be high.
Pipelines work best when there is no conflict among countries. They can be blown up by another country that seeks to raise natural gas prices, or that wants to retaliate for some perceived misdeed. For this reason, most growth in natural gas exports/imports in recent years has been as LNG.
Organizations investing in high-cost infrastructure for extracting and shipping natural gas would like long-term contracts at high prices in order to cover their costs. Without a stable long-term supply contract, natural gas purchase prices can be extremely variable. Japan has tended to buy LNG under such long-term contracts, but many other countries have taken a wait-and-see attitude toward prices, hoping that “spot” prices will be lower. They don’t want to lock themselves into a long-term high-priced contract.
There are two different things that tend to go wrong:
-
Spot prices bounce up above even what the long-term contract price would have been, creating a huge high-price problem for consumers.
-
Spot prices, on average, turn out to be too low for natural gas exporters. As a result, they cut back on investment, so that the amount of future exports can be expected to fall.
I believe that there is a significant chance that natural gas exports are now reaching a situation where prices cannot please all users simultaneously. Not all investors can get an adequate return on the huge investments that they have made in advance. Some investments that should have been made will be omitted. For example, there might be enough natural gas storage for a warm winter, but not for a very cold winter in Europe.
A prime characteristic of a fossil fuel (or any resource) that is not economic to extract is that the industry has difficulty paying its workers an adequate wage. Recently, there has been news about a union strike against Chevron at an Australian natural gas extraction site used to provide gas for liquefied natural gas (LNG) export. This suggests that natural gas may already be hitting long-distance export limits. Prices can’t stay high enough for producers to pay their workers an adequate wage.
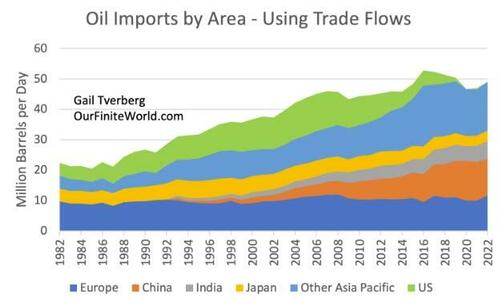
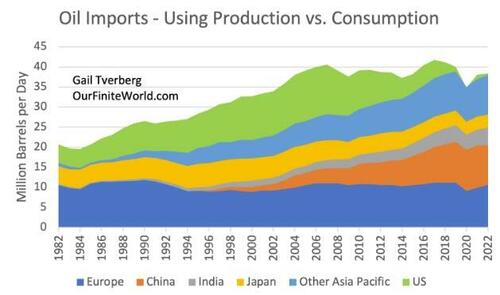
[4] Oil imports by area suggest that the rapidly growing manufacturing parts of the world are squeezing out the imports desired by high-wage, service-oriented countries.
Because oil is so important in international trade, I looked at the amounts two ways. The first is based on trade flows, as reported by the Energy Institute:
Figure 5. Oil imports by area based on the 2023 Statistical Review of World Energy by the Energy Institute.
The second is based upon a comparison of reported production and consumption for the same year, using the assumption that if consumption is higher than production, the difference must be attributable to imported oil. The problem with this later approach is that it can easily be distorted by changes in inventory levels. There may also be difficulties with my approach of netting out flows in two different directions, especially if the flows are partly of crude oil and partly of “oil products” of various types.
Figure 6. Oil imports based on production and consumption data of the 2023 Statistical Review of World Energy by the Energy Institute. Amounts adjusted to include “Refinery Gain,” as reported by the US Energy Information Administration.
In both charts, imports for China, India, and Other Asia Pacific are clearly much higher in recent years, while imports for the US, Japan, and Europe are down. The peak year for imports (in total) was about 2016 or 2017. Imports were about 3.5 million barrels a day lower in 2022, compared to peak, with both approaches.
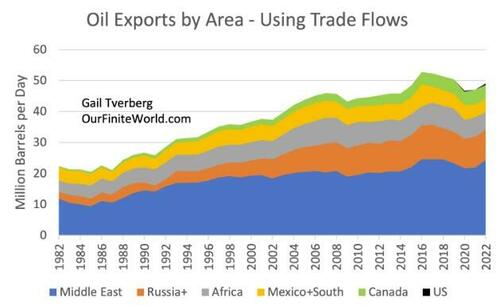
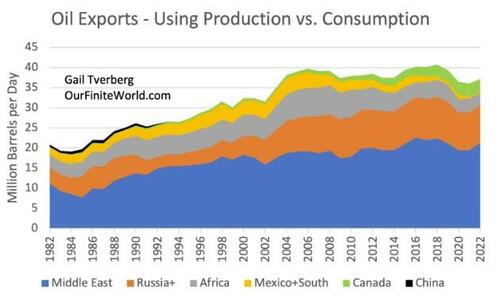
[5] Oil imports by area indicate that nearly all oil exporters around the globe are having difficulty maintaining export levels.
Here, again I show two indications, using the same methods as for oil imports. Since trade is two sided, I would expect total import indications to more or less equal the total of all amounts exported.
Figure 7. Oil exports by area using trade flows based on data of the 2023 Statistical Review of World Energy by the Energy Institute.
On Figure 7, peak oil exports (in total) occur in 2016, with the runner up year being 2017. US oil exports are shown to be nearly zero, even in recent years, because US imports and US oil exports more or less cancel out.
Figure 8. Oil exports based on production and consumption data of the 2023 Statistical Review of World Energy by the Energy Institute. Amounts adjusted to include “Refinery Gain,” as reported by the US Energy Information Administration.
The indications of Figure 8 show that apart from Canada, the amount of oil exported for all the other export groupings shown is lower in recent years than it was a few years ago. This is also evident in Figure 7, but not as clearly.
To some extent, the lower production in recent years is related to the cutbacks announced by OPEC+ (including what I call Russia+). While these cutbacks are “voluntary,” they reflect the fact that based on current oil prices, and based on investments made in recent years, these countries have made the decision to cut back production. No oil exporter would dare mention that it is running short of oil that can be extracted without considerably more investment.
On Figures 7 and 8, “Mexico+South” refers to all the oil being produced from Mexico southward. Besides Mexico, this includes Brazil, Venezuela, Argentina, Columbia, Ecuador, and a number of other small producers. Most of them are experiencing falling production. Brazil is doing a bit better, but it does not seem to be experiencing much growth in exports.
Africa’s peak year for oil exports seems to have been in 2007 (both approaches), with recent exports at a much lower level.
With respect to Russia+, its exports seem to be down from their peak in 2017 or 2018, but not any more than for oil producers from the Middle East. The European Union oil embargo doesn’t seem to have had much of an impact.
The star performer seems to be Canada, with its rising production and exports from the Canadian Oil Sands.
In this analysis, I have “netted out” imports and exports. On this basis, the US hasn’t moved into significant oil exporter status yet. I am sure that there are some people hoping that the oil production of the US will continue to increase, but whether this will happen is unclear. The growth of US oil production in recent years has helped offset (and thus hide from view) the falling exports of many countries around the world.
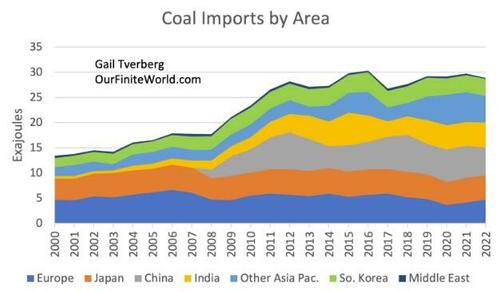
[6] Coal exports appear to have peaked about 2016. Europe has reduced its imports of coal, leaving more for other importers.
Figure 9. Coal imports by area using trade flows based on data of the 2023 Statistical Review of World Energy by the Energy Institute.
The peak in coal imports seems to have occurred about 2016. In particular, Europe’s imports of coal have fallen significantly since 2006. At the same time, coal imports have risen for many Asian countries, including China, India, South Korea, and Other Asia Pacific. Even Japan seems to have been able to obtain a fairly consistent level of coal imports for the 22-year period shown on Figure 9.
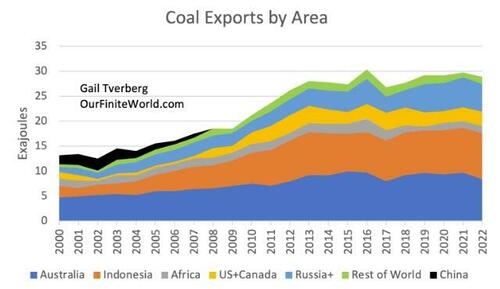
Figure 10. Coal exports by area based on trade flow data from the 2023 Statistical Review of World Energy by the Energy Institute.
One thing that is striking about coal exports is that they are disproportionately from countries in the Far East. Even the coal exports of the US and Canada are from North America’s West Coast, across the Pacific. Russia’s coal exports tend to be from Siberia.
The coal exports of South Africa have declined significantly since 2018, and other African countries are eager for their imports. Today’s largest source of coal exports is Indonesia. Coal exports from Russia+, at least until 2021, have been been a source of coal export growth.
A major share of the delivered price of coal is transportation cost, which tends to be fueled by oil, particularly diesel. Overland transit is particularly expensive. The real reason for Europe’s decline in coal imports since 2006 (shown in Figure 9) may be that there are practically no affordable coal exports available to it because it is too geographically remote from major exporters. Of course, this is not a story politicians care to tell voters. They prefer to spin the story as Europe’s choice, to prevent climate change.
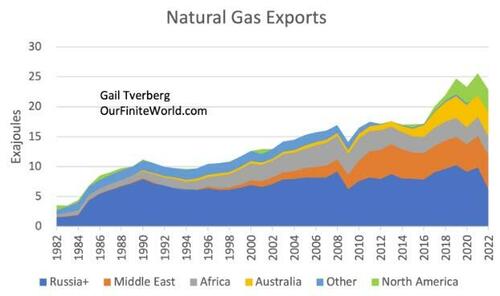
[7] Natural gas imports and exports have only recently started to become constrained.
Figure 11. Natural gas exports by area based primarily upon production and consumption data from the 2023 Statistical Review of World Energy by the Energy Institute.
Figure 11 shows that natural gas exports from Russia+ (really Russia, with a little extra production from other countries in the Commonwealth of Independent States) have stayed fairly level, except for a big drop-off in 2009 (probably recession related) and in 2022.
The overall level of natural gas exports has been rising because of contributions from several parts of the world. Africa was an early producer of natural gas exports, but its exports have been dropping off somewhat recently as local gas consumption rises.
More importantly, exports have increased in recent years from the Middle East, Australia, and North America. With this growing supply of exports, it has been possible for importers to increase their imports.
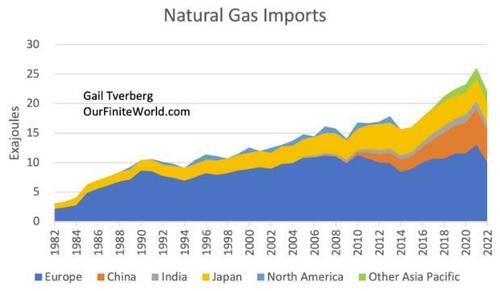
Figure 12. Natural gas imports by area based upon production and consumption data from the 2023 Statistical Review of World Energy by the Energy Institute.
Europe was able to maintain a fairly stable level of natural gas imports between 1990 and 2018, and even to increase them by 2021. China was able to ramp up its natural gas imports. Even Japan was able to ramp up its natural gas imports until about 2014. It has tapered them back since then. India and Other Asia Pacific both have been able to add a small layer of imports, too.
[8] What lies ahead?
The countries that have the greatest advantage in using fossil fuel imports are the countries that don’t heat or cool their homes, and that don’t have large numbers of private citizens with private passenger automobiles. Because of their sparing use of fossil fuel imports, their economies can afford to pay higher prices to import these fossil fuel imports than other countries. Thus, they are likely to be winners in the competition for fossil fuel imports.
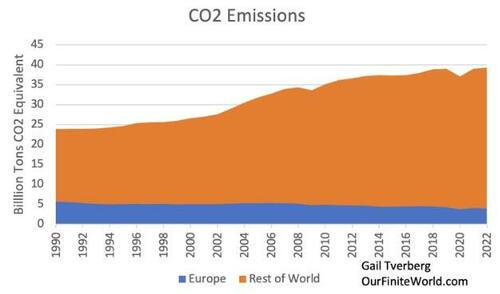
Europe stands out to be an early loser of imports. It is already losing oil and coal imports, and it also seems to be an early loser of natural gas imports. However, for all its talk about preventing climate change, the reduction in European imports of fossil fuels hasn’t made much of a dent in global carbon dioxide emissions (Figure 13).
Figure 13. CO2 emissions for Europe and the Rest of the World, based on data of the 2023 Statistical Review of World Energy by the Energy Institute.
I am afraid that no country will really come out ahead. In some sense, the United States is better off than many countries because it is producing slightly more fossil fuels than it consumes. But it still depends on China and other countries for many imported goods, including computers. Given this situation, the United States likely cannot continue business as usual for very long, either.
Tyler Durden
Sat, 09/02/2023 – 18:30
via ZeroHedge News https://ift.tt/BYNpahk Tyler Durden
