US Consumers Trim Inflation Expectations, Turn Most Bearish On Stocks In One Year
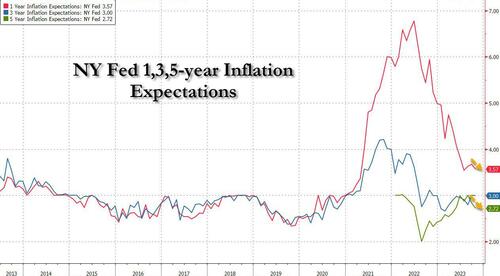
After two months of increases in the 1-Year inflation expectation as tracked by the NY Fed’s monthly consumer survey, October saw the first decline in this series which traditionally is also a proxy for the price of oil since July. The drop in 1 year inflation expectations was matched by a small decline in 5 year inflation expectations, while inflation expectations at the 3 year point were unchanged.
Here are the details: as shown in the chart below, inflation expectations at the one-year horizon decreased to 3.57% from 3.67% in Sept; median inflation expectations at the three-year ahead horizon remained unchanged at 3.0% while 5-year-ahead inflation expectations declined to 2.72% from 2.84%, the lowest since April.
Tomorrow’s CPI update, which is different from the Fed’s preferred inflation metric, the core PCE, should help to inform policymakers before their next gathering on Dec. 12 and 13. The monthly and annual measures of overall CPI are expected to slow in October on retreating gasoline costs. But excluding energy and food prices, the core metric is seen staying at levels above the Fed’s target.
A separate report released last week by the University of Michigan found that consumers’ long-term inflation expectations increased to the highest since 2011 and that people are becoming more concerned about high borrowing costs and the economy’s prospects.
The report also noted that median inflation uncertainty (the uncertainty expressed regarding future inflation outcomes) increased slightly at the one-year ahead horizon, remained unchanged at the three-year ahead horizon, and declined at the five-year ahead horizon.
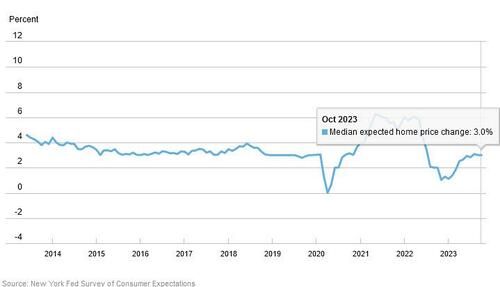
Turning to median home price growth expectations were unchanged at 3.0%, remaining well above the series 12-month trailing average of 2.1%…. which of course is the opposite of what the Fed wants to achieve, and suggests that the Fed’s tightening plans may need to be boosted to extract some more disinflation from the single, most important asset class for the US middle class. The decrease was more pronounced among respondents below the age of 40 and those who live in the South Census regions.
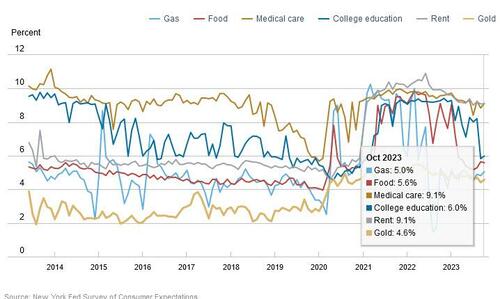
Next, turning to year-ahead commodity price expectations, households expect prices to rise more rapidly for gas and medical care; there was also a reversal in last month’s slide in college education costs, which has tumbled from 8.2% to 5.8% – the largest one-month decrease since the onset of the survey in 2013 – only to rise again in October to 6.0%; meanwhile median year-ahead expected gas price changes increased by 0.2% to 5.05% while medical care prices are expected to rise by 0.3% to 9.11%, rents are seen rising at 9.09%, unchanged from last month, and food prices are expected to rise 5.58%.
The report also showed consumers have mixed views about their ability to access credit and find work. A smaller share of respondents reported finding it more challenging to access credit now than a year ago. But a larger share of people said they expected to see tighter credit conditions in one year. As for the jobs market, the perceived odds of losing a job in the next year rose by 0.3 percentage point to 12.7% and the probability of finding a job after becoming unemployed rose slightly to 56.6% from 56.5% (see more below).
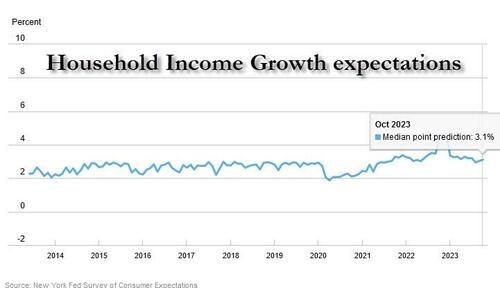
While households still expect most prices to keep surging, the silver lining is that two months after it slumped to 2.9% – the lowest since July 2021 – in October expectations for household income growth managed to clawback some losses and rose to 3.1% from 3.0%, remaining above the series’ pre-pandemic level of 2.7% but well below the series 12-month trailing average of 3.5%.
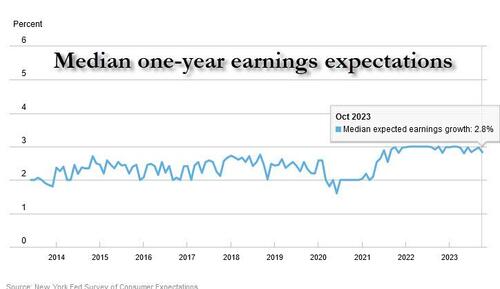
Curiously, while household income growth posted a modest increase, the same was not true for actual earnings expectations: indeed, the median one-year ahead expected earnings growth decreased by 0.2 percentage point to 2.8%, matching the lowest in over 2 years.
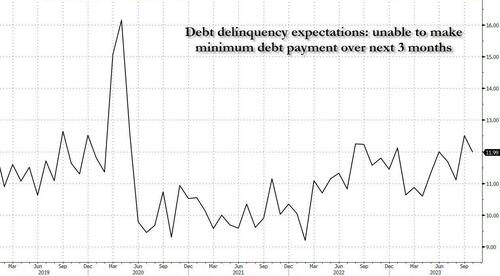
Finally, after a sharp surge last month which pushed expectations for debt delinquency to 12.5%, the highest since the covid collapse, in October a smaller percentage of consumers, 11.99% or down 0.5%, expected to not be able to make minimum debt payment over the next three months. This is a level comparable to the prevailing one just before the pandemic.
It wasn’t clear why this trend reversed at a time when both auto and student loan delinquencies are exploding to levels not seen since the Lehman collapse, but we are confident after a few months, the series will revert back to its increasingly more upward-sloping trendline.
Here are some of the other key observations from the latest NY Fed survey, first those dealing with household finance
- Median household spending growth expectations were unchanged at 5.3%. While the series is well below its level of 7.0% from a year-ago, it remains well above its February 2020 pre-pandemic level of 3.1%.
- Perceptions of credit access compared to a year ago improved slightly with a decreased share of respondents reporting that it is more difficult to obtain credit now than a year ago. In contrast, expectations about future credit access worsened slightly with an increased share of respondents expecting tighter credit conditions a year from now.
- The average perceived probability of missing a minimum debt payment over the next three months decreased by 0.5 percentage point to 12.0%
- The median expected year-ahead change in taxes (at current income level) declined by 0.2 percentage point to 3.8%, its lowest reading over the past three years (someone is in for huge disappointment).
- Median year-ahead expected growth in government debt increased to 9.8% from 9.5%.
- The mean perceived probability that the average interest rate on saving accounts will be higher in 12 months decreased by 0.5 percentage point to 30.3%.
- Perceptions about households’ current financial situations improved in October with more respondents reporting being better off than a year ago and fewer respondents reporting being worse off. Year-ahead expectations were mixed with both a larger share of respondents expecting to be worse off and a larger share of respondents expecting to be better off a year from now.
And the labor market:
- Median one-year ahead expected earnings growth decreased by 0.2 percentage point to 2.8%. The series has been moving within a narrow range of 2.8% to 3.0% since September 2021. The decline in October was driven by respondents below the age of 40 and without a college degree.
- Mean unemployment expectations—or the mean probability that the U.S. unemployment rate will be higher one year from now—decreased by 1.5 percentage points to 38.6% , slightly below the series 12-month trailing average of 40.2%.
- The mean perceived probability of losing one’s job in the next 12 months increased slightly by 0.3 percentage point to 12.7%. The mean probability of leaving one’s job voluntarily in the next 12 months remained unchanged at 18.2%.
- The mean perceived probability of finding a job (if one’s current job was lost) increased marginally to 56.6% from 56.5%.
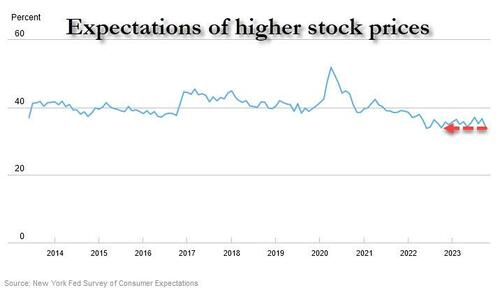
One final notable point is that the mean perceived probability that U.S. stock prices will be higher 12 months from now fell by 2.5% to 34.2%, its lowest level since October 2022.
If this survey is even remotely accurate, it remains the case that for most households (and their generous credit cards) a recession remains far off into the horizon.
More in the full report here.
Tyler Durden
Mon, 11/13/2023 – 15:05
via ZeroHedge News https://ift.tt/qw5rL24 Tyler Durden
