Consumer Prices Print Hotter Than Expected, Led By Surge In Energy & Shelter Costs
Tl;dr: Newsquawk sums up today’s CPI print…
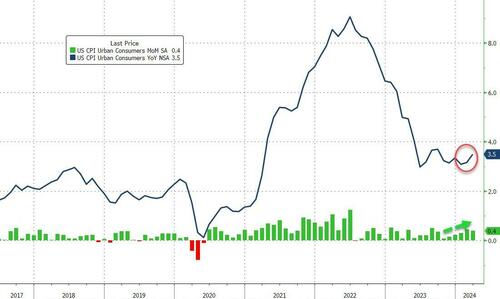
After increasing MoM for the last five months, headline CPI was expected to slow modestly in March (from +0.4% MoM to +0.3% MoM), but obviously still rising. However, it did not, rising a hotter than expected 0.4% MoM (equal highest since August 2023) and pushing it up 3.5% YoY…
Source: Bloomberg
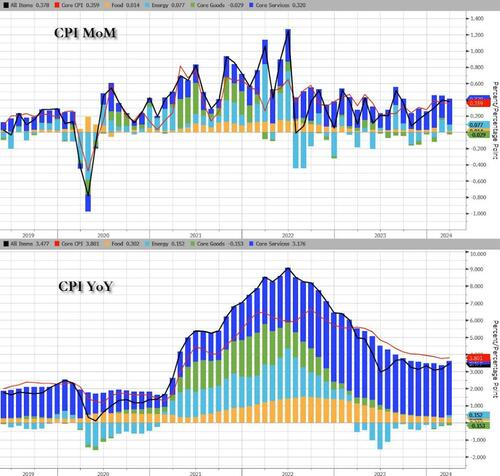
Energy and Services dominated the rise on a YoY basis (with the former flipping from YoY deflation)…
Source: Bloomberg
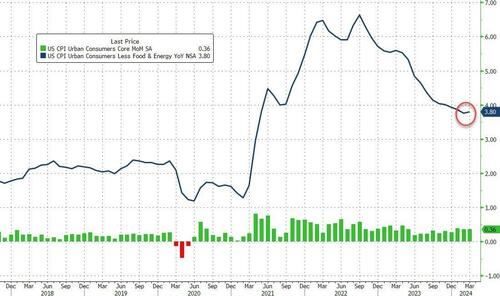
Core CPI also rose more than expected (+0.4% MoM) pushing the YoY move up 3.8% (hotter than the 3.7% exp)…
Source: Bloomberg
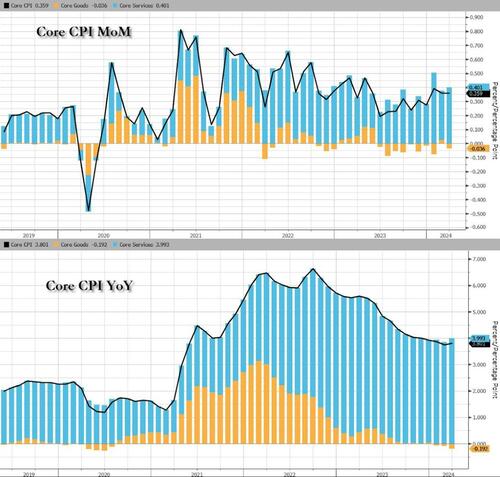
Within the core index, goods costs continue to deflate on a YoY basis but services are re-acclerating…
Source: Bloomberg
Under the hood, the surge was led by Energy & Shelter costs…
Highlights:
-
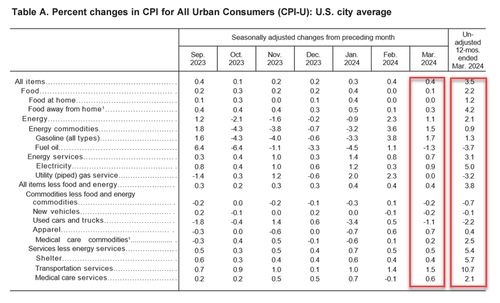
The index for shelter rose in March, as did the index for gasoline. Combined, these two indexes contributed over half of the monthly increase in the index for all items.
-
The energy index rose 1.1 percent over the month. The food index rose 0.1 percent in March.
-
The food at home index was unchanged, while the food away from home index rose 0.3 percent over the month
-
The index for all items less food and energy rose 0.4 percent in March, as it did in each of the 2 preceding months.
-
Indexes which increased in March include shelter, motor vehicle insurance, medical care, apparel, and personal care.
-
The indexes for used cars and trucks, recreation, and new vehicles were among those that decreased over the month.
Food:
-
The food index increased 0.1 percent in March, while the food at home index was unchanged. Both indexes were unchanged in February.
-
Three of the six major grocery store food group indexes decreased over the month while the remaining three had price advances.
-
The index for other food at home decreased 0.5 percent in March, led by a 5.0-percent decline in the index for butter.
-
The cereals and bakery products index decreased 0.9 percent over the month, the largest 1-month seasonally adjusted decrease ever reported in that series, which dates to 1989.
Energy:
-
The energy index rose 1.1 percent in March, after increasing 2.3 percent in February.
-
The gasoline index increased 1.7 percent in March. (Before seasonal adjustment, gasoline prices rose 6.4 percent in March.)
-
The index for electricity rose 0.9 percent in March, while the index for natural gas was unchanged over the month. The fuel oil index decreased 1.3 percent in March.
All items ex food and energy, MoM:
-
The index for all items less food and energy rose 0.4% in March, as it did the previous 2 months. The shelter index increased 0.4 percent in March and was the largest factor in the monthly increase in the index for all items less food and energy.
-
The index for rent rose 0.4 percent over the month, as did the index for owners’ equivalent rent. The lodging away from home index increased 0.1 percent in March, as it did in February.
-
The motor vehicle insurance index rose 2.6 percent in March, following a 0.9-percent increase in February.
-
The index for apparel increased 0.7 percent over the month.
-
The medical care index rose 0.5 percent in March after being unchanged in February.
-
The index for hospital services rose 1.0 percent over the month and the index for physicians’ services increased 0.1 percent.
-
The prescription drugs index rose 0.3 percent in March.
-
The index for used cars and trucks fell 1.1 percent in March, following a 0.5-percent increase in February.
-
Over the month, the recreation index fell 0.1 percent over the month, the new vehicles index decreased 0.2 percent, and the airline fares index declined 0.4 percent.
All items ex food and energy, YoY
-
The index for all items less food and energy rose 3.8 percent over the past 12 months.
-
Other indexes with notable increases over the last year include motor vehicle insurance (+22.2 percent), medical care (+2.2 percent), recreation (+1.8 percent), and personal care (+4.2 percent
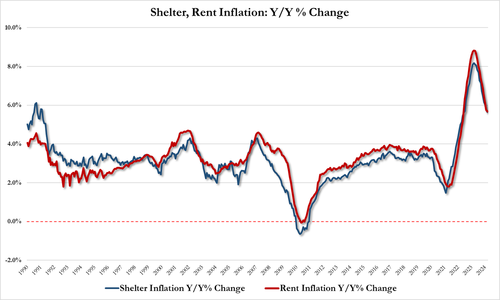
The shelter index increased 5.7 percent over the last year, accounting for over sixty percent of the total 12-month increase in the all items less food and energy index.
-
March Shelter CPI 5.65% YoY (vs 5.74% in February) and up 0.58% MoM, vs 0.51% in Feb
-
March Rent CPI 5.68% YoY (vs 5.77% in February) and up 0.37% MoM vs 0.41% in Feb
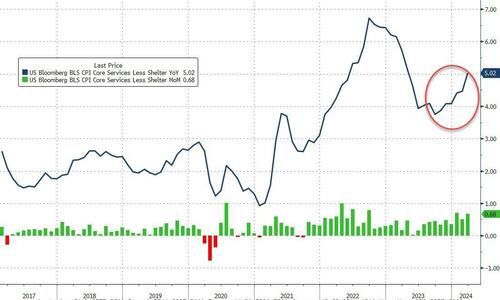
And one step deeper – the so-called SuperCore: Core CPI Services Ex-Shelter index – soared 0.7% MoM up to 5.0% YoY – the hottest since April 2023…
Source: Bloomberg
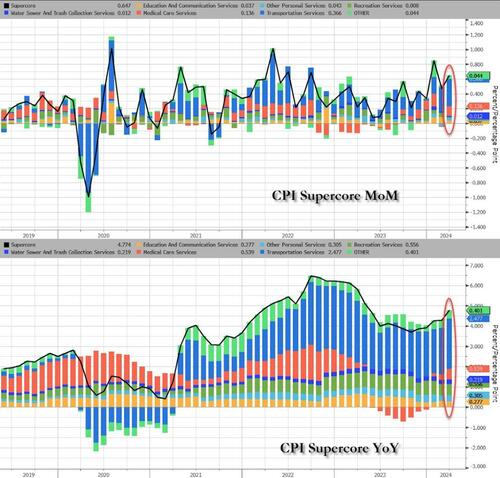
Worse still, every sub-components in SuperCore rose on a MoM and YoY basis…
Source: Bloomberg
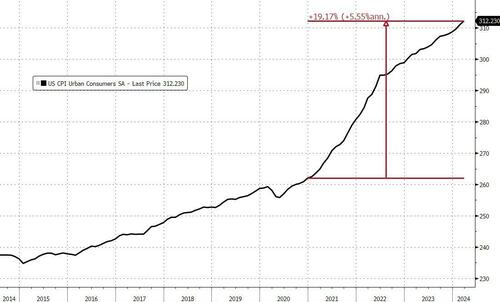
Finally, we note that consumer prices have not fallen in a single month since President Biden’s term began (July 2022 was the closest with ‘unchanged’), which leaves overall prices up over 19% since Bidenomics was unleashed. And prices have never been more expensive…
Source: Bloomberg
That is an average of 5.6% per annum (more than triple the 1.9% average per annum rise in price during President Trump’s term).
So, about that shrinkflation – did companies only ‘get greedy’ when Biden took office?
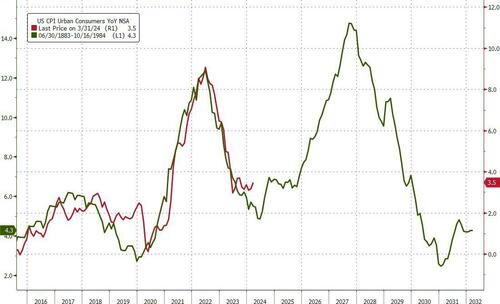
Are we going to see a replay on the ’70s?
Source: Bloomberg
Not at all what the doves (and the Biden administration) were hoping to see…
Tyler Durden
Wed, 04/10/2024 – 08:36
via ZeroHedge News https://ift.tt/TRNr6hv Tyler Durden
