US Energy Production Chalks Up Another Record
Authored by Alex Kimani via OilPrice.com,
-
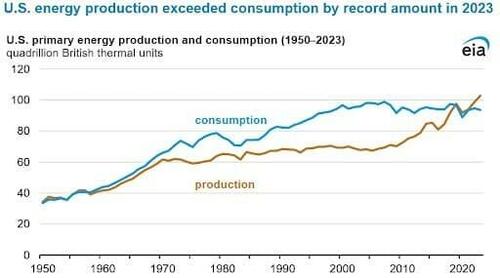
EIA: U.S. Energy production rose 4% to nearly 103 quadrillion British thermal units (quads) in 2023.
-
Dry natural gas production increased 4% in 2023 and 58% since 2013 while crude oil production has grown 9% since 2022 and 69% since 2013.
-
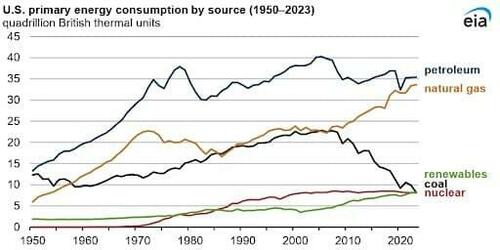
On the flip side, U.S. energy consumption fell 1% largely driven by a 17% decline in coal consumption.
For decades, the United States has been a net consumer of energy, using up more energy than it produces. However, a sharp increase in oil and gas production following the shale boom as well as the ongoing renewable energy revolution has helped change the energy trajectory over the past 15 years. And now the U.S. Energy Information Administration (EIA) has reported that U.S. energy production exceeded consumption by record amounts in 2023.
According to the EIA, U.S. Energy production rose 4% to nearly 103 quadrillion British thermal units (quads) in 2023, a record for the country. On the other hand, energy consumption fell 1% to 94 quads during the same period, implying production exceeded consumption by 9 quads, the widest margin since 1949.
Dry natural gas production increased 4% in 2023 and 58% since 2013 while crude oil production has grown 9% since 2022 and 69% since 2013. Meanwhile, renewable energy production rose 1% compared to the previous year and a 28% increase since 2013, hitting eight quads of energy. Solar energy production recorded an impressive 15% Y/Y growth in 2023 while wind production fell 2%.
On the flip side, U.S. energy consumption fell 1% largely driven by a 17% decline in coal consumption. Coal demand has been on a tailspin for years to its lowest level in more than a century thanks in large part to its shrinking role in electricity generation due to a high carbon footprint.
“Natural gas production has continued to increase despite lower prices because natural gas is produced as a byproduct of crude oil production. That’s especially true in the Permian Basin, which accounts for almost half of U.S. crude oil production,” said Chris Higginbotham, an EIA spokesperson.
Source: U.S. Energy Information Administration
Oil Price Rally Resumes
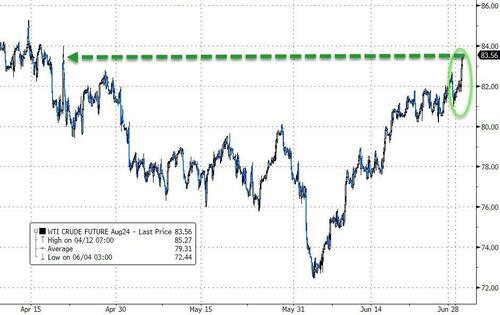
The oil price rally that had reversed course in recent weeks on demand concerns is now back on track. Brent crude price has increased to $86.60 per barrel at today’s close from $77.52 on June 4 while WTI has increased from $73.25 per barrel to $83.41 with oil demand exceeding expectations.
According to commodity analysts at Standard Chartered, global oil demand in April averaged 101.77 million barrels per day (mb/d), 470 thousand barrels per day (kb/d) higher than earlier forecasts. StanChart has reiterated its forecast that oil demand will hit an all-time high in June, with May demand projection revised 0.2 mb/d higher to 103.3 mb/d while the June projection has been revised 0.3 mb/d higher to 104.1 mb/d.
Meanwhile, the big natural gas rally that kicked off in late April has now taken a breather.
European natural gas futures have been trading in a narrow range around €35 per megawatt-hour as traders weigh ample storage levels against supply concerns. The long run of sub-par EU gas inventory builds continues, with inventories having lost ground relative to the five-year average on 57 of the past 62 days. According to the latest Gas Infrastructure Europe (GIE) data, inventories stood at 85.25 billion cubic meters (bcm) on 16 June, a y/y decrease of 0.06 bcm and 12.93 bcm above the five-year average. The w/w build was 1.75 bcm, which is 1 bcm less than the five-year average. The move away from extreme surplus has combined with concerns over the viability of the remaining Russian flows into the EU to help support front-month Dutch Title Transfer Facility (TTF) prices. Europe’s gas prices have settled in the EUR 33-36 per megawatt hour (MWh) range on 19 of the past 20 trading days.
U.S. natural gas futures fell below $2.61/MMBtu in Friday’s intraday session after the EIA’s storage build report. According to the report, U.S. utilities injected 52 billion cubic feet of natural gas into storage last week, slightly below the expected 53 bcf build. U.S. gas inventories are now 20.6% above the seasonal norm. Natural gas prices are headed for a third consecutive week of declines due to increased output, as higher prices in recent weeks encouraged producers like EQT Corp. (NYSE:EQT) and Chesapeake Energy (NASDAQ:CHK) to resume drilling. Gas output in the Lower 48 states averaged 98.6 billion cubic feet per day (bcfd) in June, up from a 25-month low of 98.1 bcfd in May. On the demand side, hotter-than-normal weather is projected through at least July 12, maintaining high gas consumption for cooling purposes.
Tyler Durden
Mon, 07/01/2024 – 20:20
via ZeroHedge News https://ift.tt/y2gA9Jo Tyler Durden


