How Long Can The Top 10% Households Prop Up The “Recovery”?

Submitted by Charles Hugh-Smith of OfTwoMinds blog,

The question of "recovery" really boils down to this: how much longer can the top 10% prop up the expansion?

A flurry of recent media stories have addressed housing unaffordability, for example Why Middle-Class Americans Can't Afford to Live in Liberal Cities.
 
The topic of housing unaffordability crosses party lines: Housing Ownership Back to 1995 Levels (U.S. Census Bureau).
 
Other stories reflect an enduring interest in the questions, what is a living wage?and what is a middle-class income? These questions express the anxiety that naturally arises from the sense that we're sliding downhill in terms of our purchasing power–a reality that is confirmed by this chart:
 
Here's a recent story that delves into the question of "getting by" versus "middle class": How Much Money Does the Middle Class Need to Get By?

"Just getting by" in costly coastal cities requires an income in the top 20%: around $60,000 for individuals and $100,000 for households.
 
The article references MIT's Living Wage Calculator, which I found to be unrealistic in terms of the high-cost cities I know well (Honolulu and the San Francisco Bay Area). It appears the calculator data does not represent actual rents or food prices; the general estimates it uses woefully under-represent on-the-ground reality.
 
Current market rents in the S.F. Bay Area far exceed the estimated housing costs in this calculator, and that one line item pushes the living wage from $36,000 for two adults closer to $45,000 in my estimate–roughly the average wage in the U.S. (not the median wage, which is $28,000).
 
If you want to know where you stand income-wise, here is a handy calculator: What Is Your U.S. Income Percentile Ranking?
 
Here are the data sources:
 
Wage Statistics for 2013 (Social Security Administration)
 
2013 Household Income Data Tables (U.S. Census Bureau)
 
There are many complexities in these questions. For example, Social Security data does not include food stamps, housing and healthcare subsidies provided by the government, etc., so lower-income households' real (equivalent) income is much higher than the published data.
 
Then there are the regional differences, which are considerable; $50,000 in a Left or Right Coast city is "just getting by" but it buys much more in other less pricey regions.
 
As for what household income qualifies as "middle class"–it depends on your definition of middle class. In my view, the definition has been watered down to the point that "middle class" today is actually working class, if we list attributes of the "middle class" that were taken for granted in the postwar era of widespread prosperity circa the 1960s.
 
In What Does It Take To Be Middle Class? (December 5, 2013), I listed 10 basic "threshold" attributes and two higher qualifications for membership in the middle class. Please have a look if you're interested.
 
I came up with an annual income of $106,000 for two self-employed wage earners and the mid-$90,000 range for two employed wage earners, the difference being the self-employed couple have to pay 100% of their healthcare insurance, as there is no employer to cover that staggering expense.
 
$90,000 puts a household in the top 25%, and $101,000 places the household in the top 20%. $150,000 a year qualifies as a top 10% household income.
 
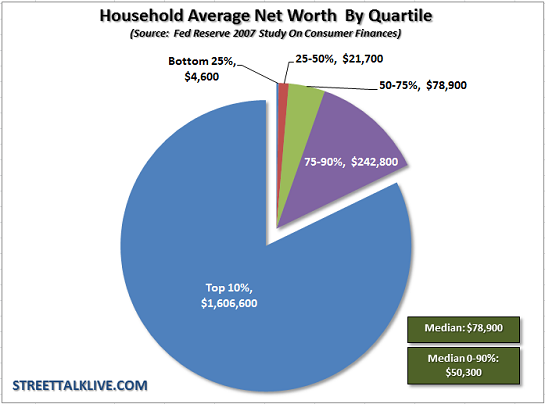
If we set aside income and consider net worth, net worth (i.e. ownership of assets and wealth) of most households is modest:
 
This shows the decline in household wealth since 2003:
 
Can an economy in which the majority of households are "just getting by" experience robust growth, i.e. "recovery"? If we discount the millions of households who are paying for today's consumption with tomorrow's earnings, i.e. credit cards, auto loans, student loans, etc., I think it's self-evident that only the top 20% (and perhaps really only the top 10%) have the income and net worth to expand a $16 trillion economy.
 
By definition, the top 10% cannot be "middle class." Yet it seems that these top 12 million households are propping up the "recovery"–dining out at pricey bistros, paying $200 a night for hotels, buying homes that cost $500,000 and up, paying slip fees for their boats, funding their children's college education with cash rather than loans, etc.
 

The question of "recovery" really boils down to this: how much longer can the increasing debt of the bottom 90% and the wealth of the top 10% prop up the expansion?


via Zero Hedge http://ift.tt/108iB14 Tyler Durden

Fed’s Kocherlakota Explains Why He Wants Moar

The lone dissenting dove at this week’s ‘end-of-QE’ FOMC meeting has taken digital pen to pixelated paper to explain why moar is better and the Fed should not stop printing…“Of course, there are costs and benefits to every monetary policy action and inaction, and assessing those costs and benefits is by no means straightforward. On this occasion, my assessment differed from that of my colleagues,” as he believes the inflation outlook has worsened.

As a reminder, Kocherlakota was the ‘gentleman’ who fired dissenting economists at the Minneapolis Fed for disgreeing with his Neo-Keynesian philosophy.

*  *  *

Statement on Dissenting Vote at October 29, 2014, Meeting of the Federal Open Market Committee

Earlier this week, I dissented from the Federal Open Market Committee (FOMC) decision. I felt that the FOMC needed to reduce possible downside risk to the credibility of its 2 percent inflation target by taking more purposeful steps to move inflation back up to 2 percent. In this statement, I will elaborate on the thinking behind my decision.


At the launch of the reduction in asset purchases in December 2013, the FOMC statement said that the Committee would be “monitoring inflation developments carefully for evidence that inflation will move back toward its objective over the medium term.” At this stage, I see no such evidence. In my assessment, the medium-term outlook for inflation has shown no overall improvement since last December and, indeed, is arguably worse. Failing to act in response to this subdued inflation outlook increases the downside risk to the credibility of our 2 percent inflation target. Market-based measures of longer-term inflation expectations have fallen recently to unusually low levels, a decline that I believe reflects that kind of increased downside risk.


As we have seen in Japan and may now be seeing in Europe, the credibility of central bank inflation targets cannot be taken for granted. Rather, central banks need to take actions on an ongoing basis to ensure that inflation stays at target. In light of the evolution of the data over the past few months, I believe we needed to take such actions on Wednesday.


There are a number of possible actions that I would have seen as responsive to the evolution of the data. Let me describe two in particular. First, the Committee could have continued to buy $15 billion of longer-term assets per month. Second, it could have committed to keeping the target range for the federal funds rate at its current level at least until the one- to two-year-ahead inflation outlook has risen back to 2 percent, as long as risks to financial stability remain well-contained. These actions would have put upward pressure on the demand for goods and services and on prices. Just as importantly, these actions would have communicated that the Committee is determined to do what it takes to push inflation back to 2 percent as rapidly as is possible.


Of course, there are costs and benefits to every monetary policy action and inaction, and assessing those costs and benefits is by no means straightforward. On this occasion, my assessment differed from that of my colleagues. Such occasional differences in perspectives are, I think, hardly surprising given the complicated nature of the decision problem that we face. But those differences should not obscure the collective commitment that my FOMC colleagues and I all share to the dual mandate objectives of price stability and maximum employment that Congress has established for the Committee. I look forward to working with my colleagues in future meetings, under Chair Yellen’s leadership, to achieve those objectives.

*  *  *


via Zero Hedge http://ift.tt/1ucQN9n Tyler Durden

Despite Plunge In Spending, Consumer Confidence Jumps To 7-Year High

The final UMich consumer confidence print (after preliminary 86.4) is higher again at 86.9 – the highest since July 2007. Ofcourse hope rose – future expectations up from 75.4 to 79.6) while current situation dropped (98.9 to 98.3)… as we all know escape velocity and wage gains (despite tumbling spending and slowing income in reality).


via Zero Hedge http://ift.tt/1wNukhc Tyler Durden

Chicago PMI Smashes Expectations, Jumps To 12-Month High

Despite plunging consumer spending, Chicago PMI surged to 66.2 (against expectations of 60.0), its highest in 12 months. This is above even the highest economist estimate and is a 4-sigma beat… having been at one-year lows just 3 months ago.


Detailed breakdown…

  • Prices Paid fell compared to last month
  • New Orders rose compared to last month
  • Employment rose compared to last month
  • Inventory fell compared to last month
  • Supplier Deliveries fell compared to last month
  • Production rose compared to last month
  • Order Backlogs rose compared to last month
  • Business activity has been positve for 12 months over the past year.


via Zero Hedge http://ift.tt/1zRdTVy Tyler Durden

“The Most Important Chart For Investors” Flashback, And Why USDJPY 120 Is Now Coming Fast

Back in late September, we posted what Albert Edwards thought at the time was “The Most Important Chart For Investors” which was quite simply, a chart of the USDJPY. Here is the punchline of what he said:

We have long believed that investors ignore Japan at their peril. Time and time again, investors have missed major global market trends that have been catalysed by Japan. We have felt for some time that a fragile Chinese economy could be pushed over the edge by a further yen devaluation – in many ways a replay of the Asian crisis of 1997. And just as the Chinese real economy data has taken a turn for the worse in August, the yen has slipped below a key 15-year support level against the dollar. This is probably the most important chart investors should focus on. The next phase of global currency wars may have begun.


We have written previously that Japan?s QE and the associated yen weakness could trigger a re-run of the 1997 Asian crisis, only this time sucking in the Chinese renminbi. The yen has just broken below a key long-term support and after a brief technical pull-back, its decline is likely to accelerate. This will trigger a wave of profit-crushing deflation flowing from east to west. Andrew Lapthorne has just written a great note on Japanese equities. He says yen weakness, not corporate self-help, is the key to Nikkei outperformance, with Germany looking particularly vulnerable. It looks as if yen weakness is what we’ve now got!


Staring long and hard at the Yen/$ chart, I think that, in the current circumstances, the yen/$ will head to 120 pretty quickly – perhaps after a short reinvigorating retracement. And, if the dollar’s ascent is given extra impetus by the DXY also breaking out, a decline in the yen below Y120 will see an end to its 30-year uptrend – a trend that has relentlessly exported deflation from the west to Japan. Sound far-fetched? One of the few things I have learnt over 30 years in this industry is that when traders decide the yen/US$ starts to move it can jump by Y10 or Y20 very, very quickly indeed.

Considering the BOJ’s overnight move, he was absolutely correct.

So for all those who missed it, here it is again, because it explains not only where the Yen is headed next, but why, sadly, this could well be the end of Japan and the mirage of a recovery that has had everybody hypnotized for the past 6 years.

Albert Edwards Presents “The Most Important Chart For Investors”

Which incidentally has nothing to do with stocks or bonds, and everything to do with all-important FX (which just happens to drive all correlation and risk pairs around the globe thanks to the far greater embedded leverage in FX, and is why all “modern” traders focus almost entirely on the USDJPY and EURUSD).

Specifically, as SocGen’s Albert Edwards notes “we show on the front page chart what I believe to be the key chart investors should be focusing on at present. It shows the yen breaking down against the US dollar. This may be more than just a strong dollar story on the back of Fed tightening however, as it seems the yen has now also broken key support levels against the euro. This is a weak yen story. Though there are good fundamental explanations for recent dollar strength vis-à-vis both the yen and the euro, often commentators like to find a fundamental story to fit market events even when price movements have occurred without any clear fundamental explanation ? for we teenage scribblers (as ex-UK Chancellor Nigel Lawson dismissively called us) all have to fill those column inches of commentary.”

Wait, Albert is now a chartist? So it would appear, with a few large caveats:

Sometimes it is very clear to me that instead of fundamentals driving prices, it is the charts or technicals that are important. Hence I have long been an advocate of keeping one eye on the charts to see if a major support or resistance has been broken. The very fact that the markets contain so many followers of technical analysis means that the soothsaying of chartists can actually be self-fulfilling. Nowhere is this more true than in the world of foreign exchange (FX) trading where fundamentals often play a peripheral role, even in the medium term. And in a world where momentum investing has become more ?fashionable?, FX is the one area where a clear market trend is especially seized upon with relish.

We couldn’t agree more, since we ourselves enjoy point out, more often than not, when various algos activate momentum ignition strategies in the USDJPY to push the broader S&P 500 above (never below) key resistance levels. In fact, it was on Zero Hedge where we pointed out last night the extreme oversold level of the Yen. Edwards, however says to ignore this, and instead to focus on what may be historic weakness in the Yen, which in turn will clobber the global economy.

… if I am right and the yen runs sharply lower from here, then this will spell real trouble for the global economy. (Do not be fooled if there is now a pause in yen weakness or even a partial retracement from these levels, as the rapidity of recent moves means the yen is now extremely oversold against the dollar ? i.e. the daily RSI=88. This should be the pause that reinvigorates the new trend).

Why does a rapidly weakening yen spell trouble for the global economy?

First, because the Chinese economy will see a further rise in its already strong real exchange rate, especially if other Asian currencies are pulled down with the sliding yen. This will hurt the Chinese economy which, from August data, appears to be weakening again. The strengthening renminbi will also exacerbate deflationary pressures further.


Second, a weak yen spells trouble for the west as a wave of deflation washes in from the rapidly devaluing east. This reverses a decade long trend. I believe that profits growth is so anaemic in the west that this monetary tightening via strengthening exchange rates could in itself be sufficient to send US and European profits into outright decline and subsequently their economies into recession (via a contraction in the investment spending). That is why this FX technical break is so important

That’s what could happen. Here is why Edwards believes, it will happen.

We have long believed that investors ignore Japan at their peril. Time and time again, investors have missed major global market trends that have been catalysed by Japan. We have felt for some time that a fragile Chinese economy could be pushed over the edge by a further yen devaluation – in many ways a replay of the Asian crisis of 1997. And just as the Chinese real economy data has taken a turn for the worse in August, the yen has slipped below a key 15-year support level against the dollar. This is probably the most important chart investors should focus on. The next phase of global currency wars may have begun.


We have written previously that Japan?s QE and the associated yen weakness could trigger a re-run of the 1997 Asian crisis, only this time sucking in the Chinese renminbi. The yen has just broken below a key long-term support and after a brief technical pull-back, its decline is likely to accelerate. This will trigger a wave of profit-crushing deflation flowing from east to west. Andrew Lapthorne has just written a great note on Japanese equities. He says yen weakness, not corporate self-help, is the key to Nikkei outperformance, with Germany looking particularly vulnerable. It looks as if yen weakness is what we’ve now got!


Staring long and hard at the Yen/$ chart, I think that, in the current circumstances, the yen/$ will head to 120 pretty quickly ? perhaps after a short reinvigorating retracement. And, if the dollar’s ascent is given extra impetus by the DXY also breaking out, a decline in the yen below Y120 will see an end to its 30-year uptrend – a trend that has relentlessly exported deflation from the west to Japan. Sound far-fetched? One of the few things I have learnt over 30 years in this industry is that when traders decide the yen/US$ starts to move it can jump by Y10 or Y20 very, very quickly indeed.

Remember that “shocking” CPI print from last week? If the SocGen strategist is right, prepare for many more such “stunners” as Japan makes deflation-exporting its only business model, one which could well crush the economies of Europe, China, and the US… and Japan! Case in point: recall what just happened to Sony last week. But the all important offset, a rising global stock market, should make it all better at least until the entire economic base is so hollowed out, not even algos can dismisses the record divergence between stock market myth and economic reality.

Edwards’ bottom line: “If a clear break in the yen downwards against both the dollar and euro is occurring, not only will this spell trouble for the beleaguered Chinese economy and exacerbate deflation in the west, but it will also break the spell of German economic dominance.


via Zero Hedge http://ift.tt/1zRdHpm Tyler Durden

Nikkei Futures Halted Limit Up (+1100) As USDJPY Tops 112

Bwuahahahaha… Nikkei futures halted limit up – over 1100 points post-BoJ (+1400 post-FOMC) as USDJPY tops 112 (up 4 handles post-FOMC) to its highest since Jan 2008.


Chart: Bloomberg


via Zero Hedge http://ift.tt/1sQGl0f Tyler Durden

Ally Financial (Formerly GMAC) Admits DoJ Subpoenas On Mortgage-Related Activities

If yesterday’s Citi debacle was a buying opportunity (which it is according to the pre-market), then news that Ally Financial (formerly GMAC) is under regulatory and DoJ investigation must be great news:

  • *ALLY CITES REQUEST FROM SEC ON SUBPRIME AUTO FINANCE PROBE & MORTGAGE-BACKED SECURITIES
  • *ALLY SAYS REQUESTS INCLUDE SUBPOENAS FROM DOJ

Of course, do not forget that GM itself recently admitted to the DoJ probing its subprime auto loan underwriting practices. But, but, but – isn’t this exactly what FHFA’s Mel Watt wants?


Via Ally’s 10-Q

Ally and its subsidiaries, including Ally Bank, are or may become involved from time to time in reviews, investigations, and proceedings (both formal and informal), and information-gathering requests, by government and self-regulatory agencies, including the FRB, FDIC, Utah Department of Financial Institutions (UDFI), Consumer Financial Protection Bureau (CFPB), U.S. Department of Justice (DOJ), SEC, and the Federal Trade Commission regarding their respective operations.


Such requests currently include subpoenas from each of the SEC and the DOJ. The subpoenas and document requests from the SEC include information covering a wide range of mortgage-related matters, and the subpoenas received from the DOJ include a broad request for documentation and other information in connection with its investigations of potential fraud and other potential legal violations related to mortgage-backed securities, as well as the origination and/or underwriting of mortgage loans.


In addition, we recently received a document request from the SEC in connection with its investigation related to subprime automotive finance and related securitization activities.


Further, in December 2013, Ally Financial Inc. and Ally Bank entered into Consent Orders issued by the CFPB and the DOJ pertaining to the allegation of disparate impact in the automotive finance business, which resulted in a $98 million charge in the fourth quarter of 2013. The Consent Orders require Ally to create a compliance plan addressing, at a minimum, the communication of Ally’s expectations of Equal Credit Opportunity Act compliance to dealers, maintenance of Ally’s existing limits on dealer finance income for contracts acquired by Ally, and monitoring for potential discrimination both at the dealer level and within our portfolio of contracts acquired across all dealers. Ally formed a compliance committee consisting of certain Ally and Ally Bank directors to oversee Ally’s execution of the Consent Orders’ terms. Failure to achieve certain remediation targets could result in the payment of additional amounts in the future.


Investigations, proceedings, regulatory actions, or information-gathering requests that Ally is, or may become, involved in may result in material adverse consequences including without limitation, adverse judgments, settlements, fines, penalties, injunctions, or other actions.

*  *  *

And this comes on the heels of GM Financial’s admission of Subprime Auto Loan Probes (via Bloomberg)

Investigations of the subprime auto finance business are spreading as General Motors Co. (GM) said its lending arm received additional subpoenas seeking details of its underwriting practices.


GM Financial, which specializes in loans to people with spotty credit, said in a regulatory filing yesterday that attorneys general of states it didn’t identify and other government offices are demanding documents related to its business of making car loans and pooling them into bonds that are sold to investors. The Detroit-based lender, along with Santander Consumer USA Holdings Inc., disclosed a similar probe by the U.S. Department of Justice in August.


The scrutiny is intensifying at the same time more borrowers are falling behind on their payments and sales of securities backed by the loans increase. Auto-finance firms that lend to people with bad credit lowered their standards amid increased competition as new entrants flooded the business to capitalize on cheap funding, according to Moody’s Investors Service.


“Subpoenas travel in packs,” Erik Gordon, a professor at the Ross School of Business at the University of Michigan, said by telephone. “There’s never one company in an industry subpoenaed because they’re mostly all doing the same thing.”

*  *  *

But, but, but – isn’t this exactly what FHFA’s Mel Watt wants?


via Zero Hedge http://ift.tt/1u0f1mA Tyler Durden

Charting Banzainomics: What The BOJ’s Shocking Announcement Really Means

Still confused what the BOJ’s shocking move was about, aside from pushing the US stock market to a new record high of course? This should explains it all: as the chart below show, as a result of the BOJ’s stated intention to buy 8 trillion to 12 trillion yen ($108 billion) of Japanese government bonds per month it means the BOJ will now soak up all of the 10 trillion yen in new bonds that the Ministry of Finance sells in the market each month.

In other words. The Bank of Japan’s expansion of record stimulus today may see it buy every new bond the government issues.

This is what full monetization looks like.

More from Bloomberg:

The central bank is already the largest single holder of Japan’s bonds, and the scale of its buying could fuel concerns it is underwriting deficits of a nation with the heaviest debt burden. The BOJ could end up owning half of the JGB market by as early as in 2018, according to Takuji Okubo, chief economist at Japan Macro Advisors in Tokyo.


“Kuroda knows when to go ALL in,” Okubo wrote in a note. “The BOJ is basically declaring that Japan will need to fix its long-term problems by 2018, or risk becoming a failed nation.


The unprecedented efforts to stoke inflation could scare bond investors, said Chotaro Morita, the chief rates strategist in Tokyo at SMBC Nikko Securities Inc.


Kuroda said earlier this month that while the BOJ holds only about 20 percent of Japan’s outstanding government bonds, the Bank of England holds approximately 40 percent of U.K. government debt.

We wish Japan the best of luck in avoiding becoming a “failed nation.”

Then again there is something to be said about a nation which is now desperately, and obviously to everyone, trying to unleash hyperinflation… and, for now at least, is failing.


via Zero Hedge http://ift.tt/109NUIq Tyler Durden

Despite Surprise Rate-Hike, Russian Ruble Crashes Most In 6 Years

Yesterday’s record-breaking surge in the Ruble appears, as we warned, to have been front-running today’s rate-hike announcement… and despite its surprise size, it is disappointing the market. The 5%-plus swing higher in the Ruble yesterday has been notably retraced as the Russian currency plunges (biggest drop in almost 6 years) after the central bank hiked rates 150bps (expectations were broadly of a 50bps hike) but it appears the ‘whisper’ number was a 200bps hike and a shift in FX policy to more active intervention. The inituial rip rally instantly faded and despite low liquidity due to Russian holidays, USDRUB is back over 43 – which would be a new record low close if it holds.

Russian Central Bank disappointed…

  • *RUSSIAN CENTRAL BANK RAISES KEY RATE TO 9.50% (up from 8%) 
  • *BANK OF RUSSIA DOESN’T ANNOUNCE CHANGES TO FX POLICY
  • *BANK OF RUSSIA SEES SIGNS FOR SLOWING INFLATION IN MID-TERM
  • *BANK OF RUSSIA READY TO EASE IF EXTERNAL CONDITIONS IMPROVE

22 of 31 economists in Bloomberg survey forecast 50bps increase; 2 predicted move to 9%; increases of 25bps and 75bps forecast by 1 each; 5 economists projected no change

The reaction:

  • *RUBLE EXTENDS DECLINES, WEAKENS 2.9% VS BASKET


Biggest plunge in almost 6 years


Analysts react:

  • *RUSSIAN RATE RISE WON’T `SIGNIFICANTLY’ SUPPORT RUBLE: NORDEA
  • *RUBLE WEAKNESS IS `BEYOND SPHERE OF MONETARY POLICY’: NORDEA
  • *RBS: RATE RISE WON’T ELIMINATE FX SHORTAGE BEHIND RUBLE DROP

The weakness has prompted furtherremarks from the central bank:

  • *BANK OF RUSSIA CONDUCTS INTERVENTIONS IN LINE WITH FX POLICY
  • *BANK OF RUSSIA INTERVENES ONLY AT EDGE OF RUB FLOATING CORRIDOR
  • *BANK OF RUSSIA: TIGHTENING HASN’T YET OFFSET IMPACT OF WEAK RUB


via Zero Hedge http://ift.tt/1u0f16b Tyler Durden