This “Non-Traditional” Valuation Measure Carries 3 Messages About U.S. Stocks

Submitted by F.F.Wiley of Cyniconomics blog,

[S]tock prices have risen pretty robustly. But I think that if you look at traditional valuation measures, the kind of things that we monitor, akin to price-equity ratios, you would not see stock prices in territory that suggests bubble-like conditions.


– Janet Yellen, responding to a question in November’s nomination hearing

We offered our take on stock valuation several times last year, while arguing that traditional price-to-earnings multiples (P/Es) are almost useless during periods of heavy policy stimulus. We’ll take a different direction here, by suggesting a “fix” for an entirely different problem with traditional P/Es. Our analysis reveals three messages about current stock prices.

We’ll start with 100+ years of traditional P/Es based on trailing 12 month earnings:

price to peak earnings 1

From this simple chart, analysts draw conclusions about whether valuation is high, low or neutral versus historic norms. One problem with that – and the motivation behind this post – is in the depiction of historic norms. Analysts typically weight periods of expanding earnings equally with periods of depressed earnings. But when earnings are depressed, P/Es tend to spike upwards as the earnings input to the denominator shrinks.

Unusual jumps in P/Es often occur in bear markets, as we saw during the Internet bust and again in the housing bust. In each of these instances, P/Es reached all-time highs despite the fact that stock prices were far below prior peaks. For example, when the S&P 500 plummeted below 700 in March 2009, P/Es climbed to a new record of 79, on their way to five consecutive months of over 100! (These results are cut off the chart for scaling purposes.)

Such distortions may make you wonder: Do P/Es during earnings recessions tell us anything at all about stock valuation?

Our answer is no.

As any Excel user who’s been foiled by a “#DIV/0” message knows, ratios demand careful attention when the denominator is volatile. In this case, a better approach is to divide equity prices by the highest earnings result from any prior 12 month period. (Dividing by trend earnings or 10 year average earnings is better still, but we’ll leave these methods for other posts.) This measure of “price-to-peak earnings” (P/PE) isn’t skewed by recessions because the denominator never falls.

Here’s the chart:

price to peak earnings 2

The last three data points (for October, November and December) are 18.2, 18.7 and 18.8. As of November, we reached a new high for the current bull market. What’s more, there are only nine comparable, historic episodes of P/PE climbing above 18.5 (as numbered on the chart). Combining these episodes with other statistics, we’ve identified three possible messages:

Message #1: Beware the bear (he’ll be here within a few months)

After five of the nine P/PE breaches of 18.5, a bear market began within the next three months (with four of the market peaks remarkably occurring in the very next month):

price to peak earnings 3

Message #2: Time to buy (earnings will bust through their prior peak)

In three other episodes, earnings were accelerating and still hadn’t reached the peak of the previous earnings cycle. Each time, the P/PE breach of 18.5 was followed by three consecutive years of double-digit earnings growth, with stock prices rising strongly but still lagging earnings:

price to peak earnings 4

Message #3: Bull to bubble (prices will leave earnings behind)

In the remaining episode (1996), earnings had already breached their prior cycle peak and would soon level off. The bigger story after this P/PE breach of 18.5 was the dizzying rise in stock prices that would outpace earnings by a large margin. Here are the details, along with a comparison to circumstances as of last month:

price to peak earnings 5

One way to interpret these results is to focus on the number of episodes linked to each of the three messages. That won’t be our approach.

We prefer to condition the results on two factors, one based on the earnings cycle and the other on the Fed. For the first factor, we look at whether earnings were accelerating upwards from below the prior cycle peak. For the second factor, we separate the Fed’s first eight decades (described according to the old-time philosophy of “taking away the punch bowl when the party gets going”) from the last two decades of Greenspan/Bernanke puts (based on the new philosophy of “refilling the punch bowl”).

price to peak earnings 6

As you might guess from the grid, we’re not convinced that current P/PEs signal a bear market in 2014, despite the facts that:

  1. Five of nine instances (56%) of P/PE breaching 18.5 were closely followed by market peaks.
  2. When earnings are at all-time highs, five of six instances (83%) of P/PE breaching 18.5 were closely followed by market peaks.

Not only do we have to be careful about using price multiples for forecasting (as mentioned in earlier posts), but we currently sit in the grid’s lower right-hand quadrant with the Fed setting new standards for short-term market support. The only other P/PE breach of 18.5 belonging to this quadrant was in the early stages of the Internet bubble.

What’s more, recent earnings and stock performance match up more closely with the Internet bubble episode – as shown in the “Message 3” table – than with the episodes in the “Message 2” table.

So, are we predicting four years of soaring stock prices and nonsensical valuations, as in 1996 to 2000?

Not exactly.

The past can offer clues to the future but it doesn’t give us a blueprint. The bigger message is that today’s valuations don’t bode well for long-term returns, where long-term means beyond the next market peak. Prices could surely bubble upwards from here, but bubbles are invariably followed by severe bear markets. (We’ll expand on this outlook in a future post, where we’ll add total return estimates.)

More importantly, we shouldn’t be fooled by traditional valuation measures. P/Es, in particular, have several flaws. We’ve shown in past articles that we get completely different results when we adjust earnings to account for mean reversion. We made a separate adjustment here to correct for the distorting effects of earnings recessions. Either way, our conclusions are a far cry from the “nothing to see here” that we keep hearing from the Fed.


via Zero Hedge http://feedproxy.google.com/~r/zerohedge/feed/~3/42RhYniPiBU/story01.htm Tyler Durden

This "Non-Traditional" Valuation Measure Carries 3 Messages About U.S. Stocks

Submitted by F.F.Wiley of Cyniconomics blog,

[S]tock prices have risen pretty robustly. But I think that if you look at traditional valuation measures, the kind of things that we monitor, akin to price-equity ratios, you would not see stock prices in territory that suggests bubble-like conditions.


– Janet Yellen, responding to a question in November’s nomination hearing

We offered our take on stock valuation several times last year, while arguing that traditional price-to-earnings multiples (P/Es) are almost useless during periods of heavy policy stimulus. We’ll take a different direction here, by suggesting a “fix” for an entirely different problem with traditional P/Es. Our analysis reveals three messages about current stock prices.

We’ll start with 100+ years of traditional P/Es based on trailing 12 month earnings:

price to peak earnings 1

From this simple chart, analysts draw conclusions about whether valuation is high, low or neutral versus historic norms. One problem with that – and the motivation behind this post – is in the depiction of historic norms. Analysts typically weight periods of expanding earnings equally with periods of depressed earnings. But when earnings are depressed, P/Es tend to spike upwards as the earnings input to the denominator shrinks.

Unusual jumps in P/Es often occur in bear markets, as we saw during the Internet bust and again in the housing bust. In each of these instances, P/Es reached all-time highs despite the fact that stock prices were far below prior peaks. For example, when the S&P 500 plummeted below 700 in March 2009, P/Es climbed to a new record of 79, on their way to five consecutive months of over 100! (These results are cut off the chart for scaling purposes.)

Such distortions may make you wonder: Do P/Es during earnings recessions tell us anything at all about stock valuation?

Our answer is no.

As any Excel user who’s been foiled by a “#DIV/0” message knows, ratios demand careful attention when the denominator is volatile. In this case, a better approach is to divide equity prices by the highest earnings result from any prior 12 month period. (Dividing by trend earnings or 10 year average earnings is better still, but we’ll leave these methods for other posts.) This measure of “price-to-peak earnings” (P/PE) isn’t skewed by recessions because the denominator never falls.

Here’s the chart:

price to peak earnings 2

The last three data points (for October, November and December) are 18.2, 18.7 and 18.8. As of November, we reached a new high for the current bull market. What’s more, there are only nine comparable, historic episodes of P/PE climbing above 18.5 (as numbered on the chart). Combining these episodes with other statistics, we’ve identified three possible messages:

Message #1: Beware the bear (he’ll be here within a few months)

After five of the nine P/PE breaches of 18.5, a bear market began within the next three months (with four of the market peaks remarkably occurring in the very next month):

price to peak earnings 3

Message #2: Time to buy (earnings will bust through their prior peak)

In three other episodes, earnings were accelerating and still hadn’t reached the peak of the previous earnings cycle. Each time, the P/PE breach of 18.5 was followed by three consecutive years of double-digit earnings growth, with stock prices rising strongly but still lagging earnings:

price to peak earnings 4

Message #3: Bull to bubble (prices will leave earnings behind)

In the remaining episode (1996), earnings had already breached their prior cycle peak and would soon level off. The bigger story after this P/PE breach of 18.5 was the dizzying rise in stock prices that would outpace earnings by a large margin. Here are the details, along with a comparison to circumstances as of last month:

price to peak earnings 5

One way to interpret these results is to focus on the number of episodes linked to each of the three messages. That won’t be our approach.

We prefer to condition the results on two factors, one based on the earnings cycle and the other on the Fed. For the first factor, we look at whether earnings were accelerating upwards from below the prior cycle peak. For the second factor, we separate the Fed’s first eight decades (described according to the old-time philosophy of “taking away the punch bowl when the party gets going”) from the last two decades of Greenspan/Bernanke puts (based on the new philosophy of “refilling the punch bowl”).

price to peak earnings 6

As you might guess from the grid, we’re not convinced that current P/PEs signal a bear market in 2014, despite the facts that:

  1. Five of nine instances (56%) of P/PE breaching 18.5 were closely followed by market peaks.
  2. When earnings are at all-time highs, five of six instances (83%) of P/PE breaching 18.5 were closely followed by market peaks.

Not only do we have to be careful about using price multiples for forecasting (as mentioned in earlier posts), but we currently sit in the grid’s lower right-hand quadrant with the Fed setting new standards for short-term market support. The only other P/PE breach of 18.5 belonging to this quadrant was in the early stages of the Internet bubble.

What’s more, recent earnings and stock performance match up more closely with the Internet bubble episode – as shown in the “Message 3” table – than with the episodes in the “Message 2” table.

So, are we predi
cting four years of soaring stock prices and nonsensical valuations, as in 1996 to 2000?

Not exactly.

The past can offer clues to the future but it doesn’t give us a blueprint. The bigger message is that today’s valuations don’t bode well for long-term returns, where long-term means beyond the next market peak. Prices could surely bubble upwards from here, but bubbles are invariably followed by severe bear markets. (We’ll expand on this outlook in a future post, where we’ll add total return estimates.)

More importantly, we shouldn’t be fooled by traditional valuation measures. P/Es, in particular, have several flaws. We’ve shown in past articles that we get completely different results when we adjust earnings to account for mean reversion. We made a separate adjustment here to correct for the distorting effects of earnings recessions. Either way, our conclusions are a far cry from the “nothing to see here” that we keep hearing from the Fed.


via Zero Hedge http://feedproxy.google.com/~r/zerohedge/feed/~3/42RhYniPiBU/story01.htm Tyler Durden

Fed’s Bill Dudley: The Fed Doesn’t Fully Understand How QE Works

Well, it took three years, but finally the Goldman Sachs-based head of the New York Fed, Bill Dudley, admitted what we all knew. From a speech just given by NY Fed’s Bill Dudley at the 2014 AEA meeting in Philadelphia:

We don’t understand fully how large-scale asset purchase programs work to ease financial market conditions

Or, in other words, “we still don’t know how QE works.” It just does (thank you Kevin Henry). And this coming from the people who want their word to become equivalent to gospel in a time when QE is being phased out and replaced with forward guidance. Luckily, at least the Fed knows all about how “forward guidance” works.

The good news: it only took $4+ trillion in Fed “assets” for the central bank to understand it had no idea what it was doing.

In retrospect, things could always have been worse.


via Zero Hedge http://feedproxy.google.com/~r/zerohedge/feed/~3/osVlyhkTcRY/story01.htm Tyler Durden

Fed's Bill Dudley: The Fed Doesn't Fully Understand How QE Works

Well, it took three years, but finally the Goldman Sachs-based head of the New York Fed, Bill Dudley, admitted what we all knew. From a speech just given by NY Fed’s Bill Dudley at the 2014 AEA meeting in Philadelphia:

We don’t understand fully how large-scale asset purchase programs work to ease financial market conditions

Or, in other words, “we still don’t know how QE works.” It just does (thank you Kevin Henry). And this coming from the people who want their word to become equivalent to gospel in a time when QE is being phased out and replaced with forward guidance. Luckily, at least the Fed knows all about how “forward guidance” works.

The good news: it only took $4+ trillion in Fed “assets” for the central bank to understand it had no idea what it was doing.

In retrospect, things could always have been worse.


via Zero Hedge http://feedproxy.google.com/~r/zerohedge/feed/~3/osVlyhkTcRY/story01.htm Tyler Durden

All The World's PMIs In One Chart

Of the 21 nations covered by PMI "soft data" surveys, only 4 have sub-50 (deceleration) prints – Russia remains at multi-year lows along with France (core Europe?), Australia (but but China?), and Greece. Of course, as Goldman (some of the optimism on the basis of recent manufacturing PMIs… may not square with evidence of a structural break in the link between the PMIs and growth) and BofAML (it's important to understand how crude these surveys are) note, faith in these 'surveys' is often misplaced (and current levels suggest the rolling over is coming soon).


Bear in mind, Goldman's own work on "soft data" surveys like PMI in Europe – We conclude that some of the optimism on the basis of recent manufacturing PMIs… may not square with evidence of a structural break in the link between the PMIs and growth. While a reading of 50 may in pre-crisis days have indicated positive growth… it today may only indicate flat growth, as the external financing constraint prevents better sentiment from translating into activity.


And BofAML's destruction ofthe "myth" of exuberant PMIs,

It is important to understand how crude these surveys are. Each month, a few hundred purchasing managers are asked if a variety of activity variables are up, down, or the same relative to the prior month. Their responses are then converted into diffusion indexes: the sum of the number managers reporting activity is “increasing” and half of those reporting “the same.” Note that there is some guesswork involved: the survey is taken before the month is over and some of the questions cover areas of the firm that are difficult for a purchasing manager to get a timely read on.

Fans of the two indexes point out that they are relatively stable, easy to interpret and never revised. However, in our view, the simplicity of the data is a drawback, not an advantage. It means no attempt is made to correct misreporting or to include late respondents. Moreover, the sample they use is not representative of the overall economy. They represent a broad cross-section of industries, but they oversample big firms and they make no attempt to adjust for the birth and death of firms.


Chart: JPMorgan


via Zero Hedge http://feedproxy.google.com/~r/zerohedge/feed/~3/zVEOFpsnDvE/story01.htm Tyler Durden

All The World’s PMIs In One Chart

Of the 21 nations covered by PMI "soft data" surveys, only 4 have sub-50 (deceleration) prints – Russia remains at multi-year lows along with France (core Europe?), Australia (but but China?), and Greece. Of course, as Goldman (some of the optimism on the basis of recent manufacturing PMIs… may not square with evidence of a structural break in the link between the PMIs and growth) and BofAML (it's important to understand how crude these surveys are) note, faith in these 'surveys' is often misplaced (and current levels suggest the rolling over is coming soon).


Bear in mind, Goldman's own work on "soft data" surveys like PMI in Europe – We conclude that some of the optimism on the basis of recent manufacturing PMIs… may not square with evidence of a structural break in the link between the PMIs and growth. While a reading of 50 may in pre-crisis days have indicated positive growth… it today may only indicate flat growth, as the external financing constraint prevents better sentiment from translating into activity.


And BofAML's destruction ofthe "myth" of exuberant PMIs,

It is important to understand how crude these surveys are. Each month, a few hundred purchasing managers are asked if a variety of activity variables are up, down, or the same relative to the prior month. Their responses are then converted into diffusion indexes: the sum of the number managers reporting activity is “increasing” and half of those reporting “the same.” Note that there is some guesswork involved: the survey is taken before the month is over and some of the questions cover areas of the firm that are difficult for a purchasing manager to get a timely read on.

Fans of the two indexes point out that they are relatively stable, easy to interpret and never revised. However, in our view, the simplicity of the data is a drawback, not an advantage. It means no attempt is made to correct misreporting or to include late respondents. Moreover, the sample they use is not representative of the overall economy. They represent a broad cross-section of industries, but they oversample big firms and they make no attempt to adjust for the birth and death of firms.


Chart: JPMorgan


via Zero Hedge http://feedproxy.google.com/~r/zerohedge/feed/~3/zVEOFpsnDvE/story01.htm Tyler Durden

The Fed Is Hiring: Lots Of Cops

Some may have forgotten, or not be aware, that the Federal Reserve system has its own police force. Well, it does: “The U.S. Federal Reserve Police is the law enforcement arm of the Federal Reserve System, the central banking system of the United States…. Officers are certified to carry a variety of weapons systems (depending on assignment) including semi-automatic pistols, assault rifles, submachine guns, shotguns, less-lethal weapons, pepper spray, batons and other standard police equipment. Officers also wear bullet resistant vests/body armor. On October 12, 2010 President Barack Obama signed into law S.B. 1132 the “Law Enforcement Officers’ Safety Act Improvements Act”, which states that law enforcement officers of the Federal Reserve are “qualified law enforcement officers” and thus are authorized to carry a firearm off-duty.”

At last check, there were over 1000 sworn members of the Fed police force. And judging by the recent spike in appearances of such “help wanted” ads as those shown below, that number is too low. We expect many more job postings such as these to appear in the coming weeks and months: in fact, we are willing to predict that the closer we get to a “renormalization” of the Fed’s balance sheet, the faster the hiring of Fed cops…


Position Summary:
 

Law Enforcement Officer
 

The Law Enforcement Officer is responsible for the protection of Bank property, valuables, and staff. Maintains security perimeter at building entrances, and performs routine building patrols to prevent unauthorized entry to premises, provide fire protection, and deter criminal and other irregular activities. Performs public relations functions by answering inquiries and providing direction to employees and visitors. Enforces federal laws and Federal Reserve policies and regulations to protect life, property and assets. Responds to incidents on Bank property and provides emergency  services. This position is an essential function of the Bank and may require extended work hours and/or work during emergency or crisis situations.

* * *

Police Technician

It’s about respect and recognition from your peers. It’s you. At the Federal Reserve Bank, we operate a part of the nation’s bank, helping to shape policies that enable people to purchase homes, send their children to school, and to live greater lives. It’s a good feeling, knowing that your work holds such meaning. It’s an even better feeling, knowing that you’re doing so with a team that recognizes the talents that make you unique. Join us today.

Are you looking for a challenging and rewarding position? Look no further!

Key Responsibilities:

  • Develops and maintains proficiency in areas such as weapons (lethal and non-lethal), first aid, CPR, fire fighting techniques, civil disorders, and public relations, by attending training classes. Must exhibit spontaneous good judgment over life and safety issues (shoot and don’t shoot scenarios, discrete handling of detected weapons and/or explosive devices, when to employ use of life saving and rescue equipment, etc.).
  • Controls pedestrian and vehicle access to the facility, patrols building and reports unusual situations or unauthorized individuals. Responds to general alarm, provides emergency service, and follows local response protocol until the alarm or situation has been resolved. Monitors Bank departments for safety or security violation and reports findings to department management. May prepare and/or review appropriate shift reports and distributes as required. Works all posts. Prepares logs and input information pertaining to incident and daily activity reports in prescribed format.
  • Monitors metal detectors or utilizes metal detection wands to scan visitors, personal items, and packages for unauthorized items. Monitors and authorizes visitors accessing Bank facilities and records visitor data on appropriate logs. Monitors surveillance equipment, intercoms, telephones, radios, and other specialized equipment. Inspects vehicles entering security sensitive areas for unauthorized personnel or contents.
  • Operates as a law enforcement officer pursuant to the authority given the Board of Governors by Section 11 (q) of the Federal Reserve Act. Authorized personnel act as law enforcement officers pursuant to regulations of the Board of Governors and approved by the U.S. Attorney General (Uniform Regulations for Federal Reserve Law Enforcement Officers).
  • On an as needed basis may conduct initial investigations into accidents and incidents, make proper notifications to the senior law enforcement officer on duty, and perform follow up duties as directed by supervisor. Could be needed to testify in court in response to a subpoena regarding accidents or incidents.
  • Develops proficiency in use of personal computer (PC) and related software, computerized access and control systems, video surveillance equipment, x-ray and metal screening equipment, various alarms systems and Automated External Defibrillators.
  • On an as needed basis may participate in special assignments to protect dignitaries of a Reserve Bank or the Board of Governors, this could include escorting visitors, contractors and/or vendors working in high security areas.

Qualifications:

  • Education: High School Diploma or GED
  • Experience: Less than two years


via Zero Hedge http://feedproxy.google.com/~r/zerohedge/feed/~3/PR4nXMIOo9k/story01.htm Tyler Durden

Where The Global Economic Growth In 2014 Is Expected To Come From – Country Breakdown

When it comes to setting the prevailing economist groupthink, nobody does it better than the economists at JPMorgan and Goldman Sachs. Which is why the following chart of projected 2014 GDP growth by quarter in the Developed and Emerging World from JPM, explains succinctly just where the groupthink now expects marginal global growth will come from (Mexico, South Africa, Korea, UK, Italy?). We show it just because the economist consensus is always wrong when it comes to the important inflection points (see ECB rate cut decision, Taper off decision, Taper on, the great financial crisis, “subprime is contained”, etc).

So for those curious to know what most likely will not happen in the new year, this chart’s for you.


via Zero Hedge http://feedproxy.google.com/~r/zerohedge/feed/~3/jBESSkKt75A/story01.htm Tyler Durden

FX: Position Adjustment or Trend Reversal ?

Last week, which straddled the New Year holiday, saw a reversal in the trends seen in second half of Q4 13.  These trends were characterized by the strength of the euro, sterling and the handful of currencies that move in their orbit, like the Swiss franc, and Danish krone and the weakness of the yen and dollar bloc currencies.


Full participation will return for an event-packed week that features the non-manufacturing PMIs, ECB and BOE policy meetings, the minutes from the December FOMC that saw the Fed announce the beginning of the end of QE3+, and the December US non-farm payrolls. 


We had expected some backing and filling after the dramatic moves on December 27,  the thinness of market conditions last week likely exacerbated the price action.   The price action that saw the euro drop around 1% on the week, and sterling shed about half as much, damaged the technical outlook.   


The push above $1.38 in the euro was not confirmed by the RSI or MACD, leaving a bearish divergence in its wake.   The euro was turned lower after testing the trend line drawn off the July ’08 high near $1.6040 and the May ’11 high near $1.4940 and just above $1.3900 at the end of the year (last week mistakenly estimated that trend line near $1.4050 in early Jan–hat tip to Mark Etzkorn at Currency Trader for setting me straight).  The 5-day moving average has slipped below the 20-day average.  A convincing break of $1.36 would signal a move toward $1.3500-25, while a move above $1.3725 would help stabilize the tone.  


The Swiss franc is interesting from a technical perspective.   The dollar fell to a 2-year low on Dec 27 at CHF0.8800.  It has rebounded and, before the weekend, took out the downtrend line drawn off the July and Nov highs.  The RSI and MACDs are trending high, never confirming that low on Dec 27.  The next upside target is seen in the CHF0.9080-CHF0.9100.  


Sterling posted a key reversal on the first trading session of 2014 by making a new high for the move (poking briefly through $1.66) before selling off to five day lows and settling below the Dec 31 low dismissing the price action that Bloomberg recorded for Jan 1).  The technical indicators are more mixed for sterling than was the case for the euro.  There does not appear to be a bearish divergence in the RSI as there was in the euro, but there is a bearish divergence with the MACDs.  In addition, the 5- and 20-day averages are not poised to cross.   Still a convincing break of $1.6400 could trigger another bout of long liquidation that could push it toward $1.6320.  On the upside, it may require a move back above $1.6500 to indicate a resumption of the uptrend. 


The dollar put in a key reversal against the yen on Jan 2 by making a new (albeit marginal) high and then selling off to its lowest level since Dec 27.  Japanese markets were closed for much of the period and the local market’s response will likely be important.   The dollar found support near JPY104, which corresponds to the 20-day moving average.  This moving average has not been violated since early Nov.  


The RSI and MACDs have turned lower and market positioning is still extreme, suggesting a vulnerability in the market.  However, with Fed tapering and US rates firm, many look for the yen to weaken sharply this year.  This will likely encourage dollar buying on pullbacks. 


The 20-day moving average had turned back bounces in the Australian dollar twice in November and twice in December.  It stalled there again on Jan 2, but short through it on Jan 3.    While the RSI and MACDs have turned up, we are suspicious of a bull trap.  A break of the $0.9000-35 area would ease these suspicions and suggest scope toward $0.9150-$0.9200. 


On several occasions in recent weeks, the US dollar has tried establishing a foothold above CAD1.07, but for naught and frustrating ideas of a breakout.   While the MACD is trending lower, the RSI has been bouncing along the 50 level, giving no strong directional signals.  We would be more inclined to buy US dollars in the CAD1.0560-80 area, with a fairly tight stop to play the six week range, with a view of additional USD strength in the period ahead. 


The technical outlook for the Mexican peso is far from clear.  The trend line drawn off the dollar’s Sept and Nov high was approached in Dec (before the dollar fell to MXN12.80) and comes in now just above MXN13.20.  On the other hand, the dollar has not traded below MXN13.00 since Christmas eve.   While we like the peso on a medium and long-term view, but don’t see a favorable risk-reward trade at current levels. 


The CFTC Commitment of Traders report on positioning in the currency futures is not available for the most recent period.  


via Zero Hedge http://feedproxy.google.com/~r/zerohedge/feed/~3/lYhc6wNG4Qk/story01.htm Marc To Market

The Good, The Bad and The Ugly: Gold in 2013 and the Outlook for 2014


Download GoldCore Outlook For 2014

CONTENTS
– Introduction
– Review of 2013
– Gold and Silver Have Torrid Year – Fall 27% and 35% Respectively
– Year Of Paper Selling But Robust Physical Demand – Especially From China
– Highlights Of Year – German Gold Repatriation, Record Highs In Yen, Huge Chinese Demand
– Lowlights Of Year – Massive Paper Sell Offs in April/June and Cypriot Deposit Confiscation
– Syria and the Middle East
– U.S. Government Shutdown and $12 Trillion Default Risk
– Continuing Central Bank Demand
– Regulatory Authorities Investigate Gold Rigging

Outlook 2014
– Geopolitical Tensions – The Middle East, Russia, China, Japan and the U.S.
– Ultra Loose Monetary Policies Set To Continue with Yellen as New Federal Reserve Chair
– Eurozone Debt Crisis Again – UK, U.S. Japan and China Also Vulnerable
– Enter The Dragon – Chinese Gold Demand Paradigm Shift To Continue
– Death Of Indian Gold Market Greatly Exaggerated
– Long Term (2014-2020) MSGM Fundamentals

Conclusion

Introduction
Happy New Year. We would like to take this opportunity to wish our clients and subscribers a prosperous, healthy and happy 2014.

With 2013 having come to a close, it is important to take stock and review how various assets have performed in 2013, assess the outlook in 2014, and even more importantly, the outlook for the coming years.

2013 was the year of the speculator and the year of the risk asset, such as equities, with global stocks doing well in the sea of liquidity and cheap money created by central banks.
Surprisingly to many gold bulls, these favourable monetary conditions did not lead to higher precious metal prices. Gold and particularly silver had a torrid year and significantly underperformed the vast majority of equity and bond markets.

The MSCI World Index was up 23% and the S&P 500, the Nasdaq and the FTSE were up 32%, 35% and 14% respectively.

MSCI World Index – 1970 to January 3, 2014 – Bloomberg

Bond investors did not fare as well as interest rates began to rise from all-time record lows. As bond prices fell, interest rates rose. The bellwether 10-year Treasury note closed the year at 3.028%, which was up from 1.76% at the start of 2013 and the highest since July 2011.

US 10 Year Note – 1964 to January 3, 2014 – Bloomberg

The Barclays US Aggregate bond index, which is dominated by Treasury, mortgage and corporate bonds and is the leading benchmark followed by institutional money, is set to record its first negative year of total returns since 1999. The bond market’s major benchmark registered a total return of minus 2.1% for 2013. It is only the benchmark’s third annual negative total return since 1976, according to Barclays.

REVIEW OF 2013

Gold and Silver Have a Torrid Year – Fall 28% and 36% Respectively
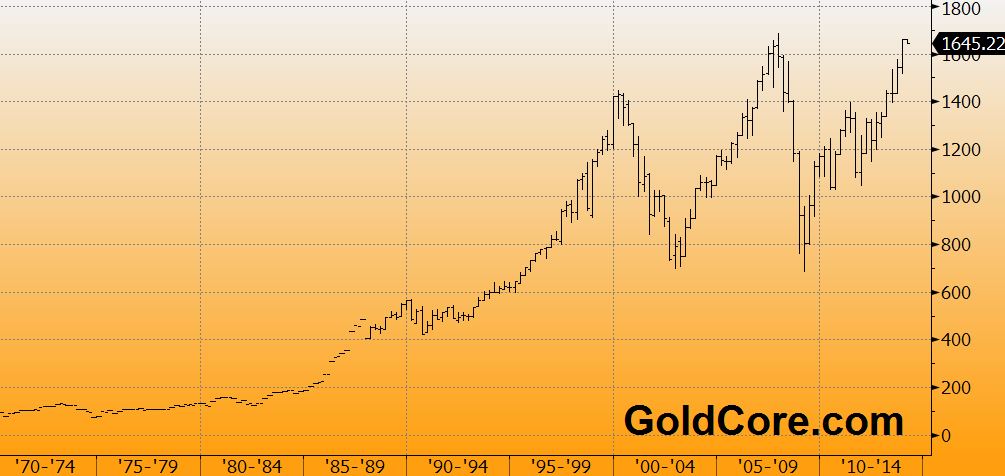
Gold fell in all major currencies in 2013 and fell 28% in dollar terms for its first annual price fall since 2000. Gold fell 40% in pound terms, 45% in euro terms. Gold fell much less in Japanese yen terms and was 16% lower in yen as the yen continued to be devalued and debased.

Silver was down by 36% in dollar terms and by more in the other currencies; silver had its poorest annual performance since 1984.

Gold came under pressure in the first half of 2013 and saw falls from near $1,700/oz at the start of the year to $1,180/oz by mid-year. Indeed, gold’s low for the year took place on June 28th, which was the last day of trading in Q2, and an important time frame for those evaluating gold’s longer term performance.

The price falls in the first half took place despite a positive fundamental backdrop and despite the risk of contagion in the Eurozone – especially from Spain, Italy and Greece. This risk was so great in the early part of the year that it led George Soros to warn in February that the Eurozone could collapse as the U.S.S.R. had.

In March, Cyprus was the first country to experience a bank bail-in of depositors, where both individual and corporate account holders, experienced capital controls and a confiscation of nearly 50% of their deposits. In June and then again two weeks ago, the EU confirmed that depositors will be bailed in when banks are insolvent.

International monetary and financial authorities globally, including the ECB, the Bank of England and the Federal Deposit Insurance Corporation (FDIC), have put in place the regulatory and legal framework for bail-in regimes in the event of banks failing again.

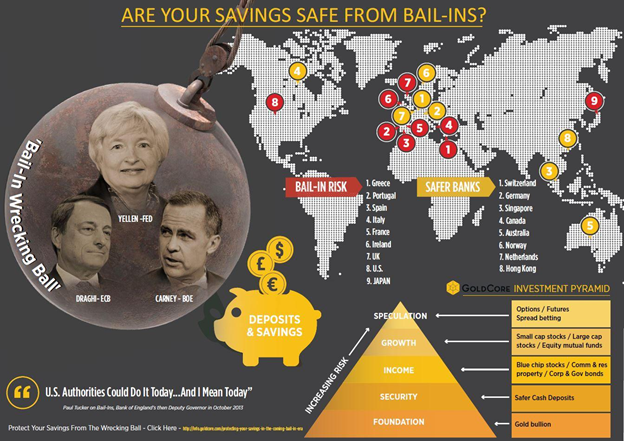
Are Your Savings Safe From Bail-Ins

Gold saw a bit of a recovery in the third quarter with gains in July and August as gold interest rates went negative, bullion premiums in Asia surged and COMEX inventories continued to fall. Silver surged 12% in 5 trading days in mid August due to record silver eagle coin demand and ETF demand.

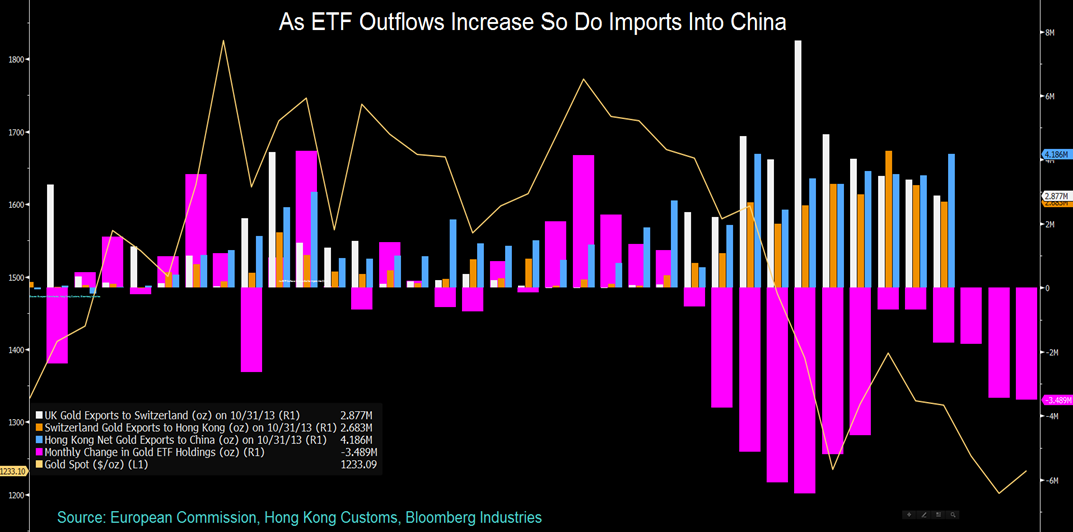
UK gold ‘exports’ to Switzerland increased greatly during the year due to demand for allocated gold in Switzerland due to Switzerland’s tradition of respecting private property throughout the centuries and its strong economy. However, more importantly, UK gold exports to Switzerland were due to the significant increase in store-of-wealth demand from China and many countries in Asia.

Institutional gold in the form of London gold delivery bars (400 oz) was exported to Swiss refineries in order to be recast into one kilogramme, 0.9999 gold bars used on the Shanghai Gold Exchange and in the Chinese market.

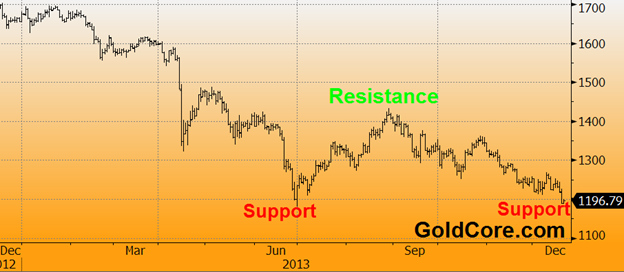
However, this was not enough to prevent further falls in the final quarter and in recent days when gold has again tested support at $1,200/oz.

Year Of Technical, Paper Selling But Robust Physical Demand

German Gold Repatriation
The year began with a bang, when news broke on January 17 that the German central bank was attempting to repatriate Germany’s gold reserves. The Bundesbank announced that they will repatriate 674 metric tons of their total 3,391 metric ton gold reserves from vaults in Paris and New York to restore public confidence in the safety of Germany’s gold reserves.


Bundesbank – Goldbarren

The repatriation of only some 20% of Germany’s gold reserves from the Federal Reserve Bank of New York and the Banque of Paris back to Frankfurt was meant to allay increasing German concerns about their gold reserves. But the fact that the transfer from the Federal Reserve is set to take place slowly over a seven year period and will only be completed in 2020 actually led to increased concerns. It also fueled concerns that the unaudited U.S. gold reserves may be less than what is officially recorded.

What was quite bullish news for the gold market, saw gold quickly rise by some $30 to challenge $1,700/oz. The news was expected to help contribute to higher prices but determined selling saw gold capped at $1,700/oz prior to falls in price in February.

Paper Selling On COMEX
Gold’s falls in 2013 can be attributed in large part to paper selling by more speculative players on the COMEX. This was graphically seen in April when there was a selling raid on the COMEX which led to a huge price fall of nearly 15% in two days prior to the emergence of “extraordinary” demand for gold internationally.

The sell off came as demand in Europe began to pick up due to concerns that the Cypriot deposit confiscation may be a precedent that could be seen in other EU countries.

The speed and scale of the sell off was incredible and even some of the bears were surprised by it. Many questioned the catalysts for the $150 two day sell off. The sell off was initially attributed to an unfounded rumour regarding Cyprus gold reserve sales – this was soon seen to be a non-story. The Cyprus rumour did not justify the scale of the unprecedented sell off.
Reports suggested that a single futures sell order worth $6 billion, equal to 4 million ounces or 124.4 tonnes of gold, by a large investment bank sent prices plummeting. The futures market then saw a further wave of selling of contracts worth some $15 billion, equivalent to 10 million ounces of selling or 300 tonnes, in just 35 minutes.
Gold futures with a value of over 400 tonnes were sold in a handful of trades in minutes. This was equal to 15% of annual gold mine production. The scale of the selling was massive and again underlines how one or two large banks or hedge funds can completely distort the market by aggressive, concentrated leveraged short positions.

Investment banks and hedge fund speculators can manipulate the paper or futures gold price in whichever direction they want in the short term due to the massive leverage they can utilise. The events in April further bolstered the allegations of manipulation by the Gold Anti-Trust Action Committee (GATA).

Significant Demand For Physical Gold Globally
Gold prices fell very sharply despite very high demand. However, the gold price decline was arrested by the scale of physical demand globally. This demand was particularly strong in the Middle East and in Asia, particularly China but was also seen in western markets with government mints reporting a surge in demand in 2013.

This demand for physical gold was seen in western markets throughout the year. In April, the US Mint had to suspend sales of small gold coins; premiums for coins and bars surged in western markets due to high demand.

Mints, refineries and bullion brokerages were quickly cleared out of stock in April and COMEX gold inventories plummeted. There were gold and silver coin and bar shortages globally.

This continued into May as investors and savers globally digested the ramifications of the Cypriot deposit confiscation. The crash of the Nikkei in May also added to physical demand in Japan and by nervous investors internationally.

This led to all time record gold transactions being reported by the LBMA at the end of May.

Chinese demand remained very robust and Shanghai Gold Exchange volumes surged 55% in one day at the end of May – from 10,094 kilograms to 15,641 kilograms. There were “supply constraints” for gold bars in Singapore and bullion brokers in Singapore and India became sold out of bullion product at the end of May.

This, and concerns about a very poor current account deficit and a possible run on the Indian rupee, prompted the Indian government to bring in quasi capital controls and punitive taxes on gold in June. Ironically, this led to even higher demand for gold in the short term and much higher premiums in India. Longer term, it has led to a massive surge in black market gold buying with thousands of Indians smuggling in gold from Bangkok, Dubai and elsewhere in Asia.

June saw another peculiar sudden 6% price fall in less than 24 hours. This again contributed to increased and very robust physical demand. U.S. Mint sales of silver coins reached a record in the first half of 2013 at 4,651,429 ounces and the UK’s Royal Mint saw a demand surge continuing in June after demand had trebled in April.
Asian markets continued to see elevated levels of gold buying. Gold demand in Vietnam was so high that buyers were paying a $217 premium over spot gold at $1,390/oz. Premiums surged again in China as the wise Chinese ‘aunties’ and wealthy Chinese continued to buy gold as a store of wealth.

Despite very high levels of demand for gold, in Asia especially, gold languished and sentiment in western markets continued to be very poor with gold falling to the lows of the year on June 28th.

July saw continuing strong demand for gold internationally as volumes surged to records on the Shanghai Gold Exchange (SGE). Premiums rose and feverish buying left many of Hong Kong’s banks, jewellers and even its gold exchange without enough gold bullion to meet demand.

In August, demand remained elevated and gold forward offered rates (GOFO) remained negative and became more negative. This showed that physical demand was leading to supply issues in the highly leveraged LBMA gold market or the institutional gold bar market.

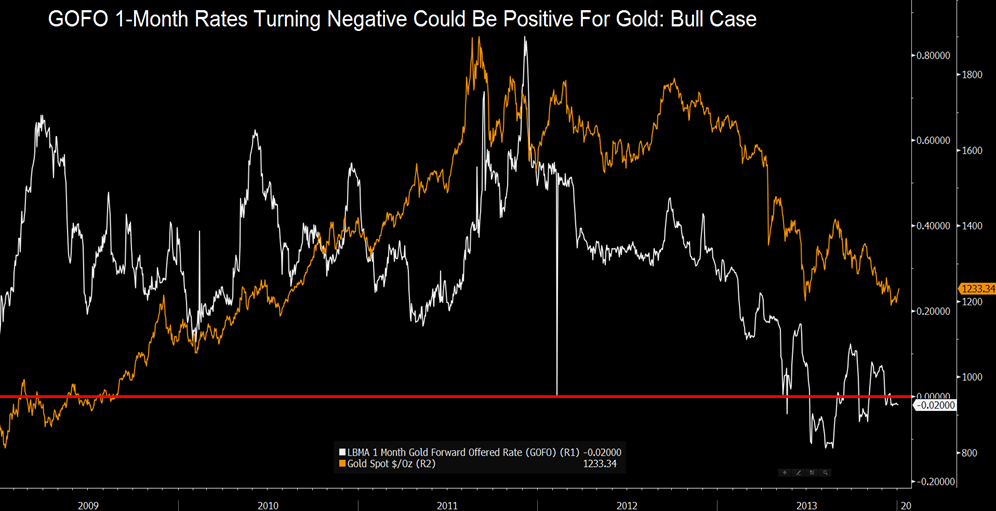
Today, as we enter the New Year gold, forward offered rates (GOFO) remain negative, meaning banks, which had lent their customers gold to obtain a positive return, and therefore increase the “paper” gold supply, will take the gold back. This should limit the amount of gold on the market and increase the gold price.

Chinese buyers are of increasing importance but it is important to note that physical demand rose significantly throughout the world in 2013 despite falling prices. This is seen in the levels of demand experienced by leading bullion dealers, refiners and government mints. This is clearly seen in the data released by the Perth Mint and the U.S. Mint which both saw increased demand for physical gold coins and bars in 2013. Other mints have yet to report their numbers.

The Perth Mint of Western Australia reported yesterday that they saw a very significant increase in sales in 2013 despite the falling prices. Gold sales from the Perth Mint, which refines most of the bullion from the world’s second-biggest producer Australia, climbed 41% last year.

Sales of gold coins and minted bars totalled 754,635 ounces in 2013 from 533,333 ounces a year earlier, according to data from the mint.

Silver coin sales surged 33% to about 8.6 million ounces from 6.5 million ounces in 2012, according to the Perth Mint.

Gold bullion sales expanded 12% to 58,944 ounces in December from 52,700 in November and about 51,778 ounces in December 2012, according to data from the mint. Gold sales fell to as low as 30,430 ounces in August and peaked at about 112,575 in April, when gold was hammered 14% lower on the COMEX in just two days.

Silver coin sales were 845,941 ounces last month from 807,246 in November and 452,389 a year earlier, it said.

The U.S. Mint also saw an increase in physical gold sales and sold 14% more American Eagle gold coins last year and sales climbed 17% to 56,000 ounces in December from November, according to data on the mint’s website as reported by Bloomberg.

Syria and the Middle East
Even bullish developments such as the prospect of war in Syria at the end of August, only led to small, short term price gains. War in Syria and in the Middle East, pitching the U.S. and western allies against China and Russia was expected by many to lead to “market panic” and to propel gold “much, much higher,” in the words of astute investor Jim Rogers.

Only the fact that President Obama and the U.S. were confronted with opposition by people internationally against another war and were outmaneuvered diplomatically, prevented the war with Syria.

The war had the potential to destabilise the region with ramifications for oil prices and the global economy.

U.S. Government Shutdown and $12 Trillion Default Risk
Another very bullish development for gold came in late September and early October with the U.S. budget negotiations and government shutdown.

They highlighted the dire U.S. fiscal position and the complete failure of the American political and economic class to deal with their extremely precarious financial position in any meaningful way. The U.S. government is essentially bankrupt with a national debt of over $17 trillion and unfunded liabilities of between $100 trillion and $200 trillion.

In the coming months and years, it will lead to a lower dollar and much higher gold and silver prices.

However, in the year of paper gold selling that was 2013, even this did not lead to higher gold prices.

Continuing Central Bank Gold Demand 
All year, central banks continued to accumulate gold with Russia, Kazakhstan, Azerbaijan, Kyrgyz Republic, Turkey and other central banks continuing to diversify their foreign exchange reserves.


U.S. Federal Reserve employees in underground vault holding monetary gold

Central banks continued to be strong buyers of gold in 2013, albeit the full year data may show demand was at a slightly slower rate than the record levels seen in recent years. Q4 2013 will be the 12th consecutive quarter of net purchases of gold by central banks.

Total official central bank demand continued at roughly 100 tonnes every single quarter. However, this does not include the ongoing clandestine and undeclared purchases of gold by the People’s Bank of China. Conservative estimates put PBOC demand at 100 tonnes a quarter or at over 400 tonnes for the year. More radical projections are of demand of over 1,000 tonnes from the PBOC in 2013.

Regulatory Authorities Investigate Gold Rigging
Peculiar, single trade or handful of trades leading to sudden gold price falls were common in 2013 and contributed to the 28% price fall.

Therefore, those who have diversified into physical gold will welcome the move by the German financial regulator BaFin to widen their investigation into manipulation by banks of benchmark gold and silver prices. In December, the German banking regulator BaFin demanded documents from Germany’s largest bank, Deutsche Bank, as part of a probe into suspected manipulation of the gold and silver markets.

The German regulator has been interrogating the bank’s staff over the past several months. Since November, when the probe was first mentioned, similar audits in the U.S. and UK are also commencing.

Precious metal investors live in hope but their experience of such investigations is that they are often very lengthy affairs with little in the way of outcome, disclosure or sanction. The forces of global supply and demand, one anemic, the other very high, are likely to be more important and a valuable aid to gold and silver owners in 2014 and in the coming years. As ultimately, the price of all commodities, currencies and assets is determined by supply and demand.

Janet Yellen Becomes Fed Chair

At year end came confirmation that cheap money uber dove Janet Yellen was set to take over from Ben Bernanke as Chair of the Federal Reserve. Gold bulls cheered loudly at her appointment thinking that Yellen’s appointment would lead to a recovery in oversold gold prices. However, even this bullish development did not help embattled gold prices.

OUTLOOK FOR 2014

Introduction

2013 was a year of calm in the world of finance. 2014 may not be so calm and there is a risk of renewed turbulence on global financial markets. There are many unresolved risks which were present in 2013 but did not come to the fore and impact markets as they could have.

The Eurozone debt crisis is far from resolved and there remains an underappreciated risk of sovereign crises in other major industrial nations.

There are far more positives for gold than negatives and the positives include ultra-loose monetary policies, risk of sovereign and banking debt crises and systemic or contagion risk, the increasingly uncertain political and military situation globally and of course increased demand for gold from the Middle East, much of Asia and particularly China.

Download GoldCore Outlook For 2014


via Zero Hedge http://feedproxy.google.com/~r/zerohedge/feed/~3/PXF6irLCW84/story01.htm GoldCore