Here Is The "Growth" – Inventory Hoarding Accounts For Nearly 60% Of GDP Increase In Past Year

As we reported earlier, while on the surface the headline revised Q3 GDP number was a stunner coming at 3.6%, the reality is that more than 100% of the growth from the initial estimate came from a revised estimate of how many private Inventories were stockpiled in the quarter. The reality was that of the $230 billion in total increase in SAAR GDP, $146 billion of this, or over 63%, was due to inventory stockpiling.

So how does inventory hoarding – that most hollow of “growth” components as it relies on future purchases by a consumer who has increasingly less purchasing power – look like historically? The chart below shows the quarterly change in the revised GDP series broken down by Inventory (yellow) and all other non-Inventory components comprising GDP (blue).

But where the scramble to accumulate inventory in hopes that it will be sold, profitably, sooner or later to buyers either domestic or foreign, is seen most vividly, is in the data from the past 4 quarters, or the trailing year starting in Q3 2012 and ending with the just released revised Q3 2013 number. The result is that of the $534 billion rise in nominal GDP in the past year, a whopping 56% of this is due to nothing else but inventory hoarding.

The problem with inventory hoarding, however, is that at some point it will have to be “unhoarded.” Which is why expect many downward revisions to future GDP as this inventory overhang has to be destocked.


via Zero Hedge http://feedproxy.google.com/~r/zerohedge/feed/~3/QkLZ1Fv_r2g/story01.htm Tyler Durden

Here Is The “Growth” – Inventory Hoarding Accounts For Nearly 60% Of GDP Increase In Past Year

As we reported earlier, while on the surface the headline revised Q3 GDP number was a stunner coming at 3.6%, the reality is that more than 100% of the growth from the initial estimate came from a revised estimate of how many private Inventories were stockpiled in the quarter. The reality was that of the $230 billion in total increase in SAAR GDP, $146 billion of this, or over 63%, was due to inventory stockpiling.

So how does inventory hoarding – that most hollow of “growth” components as it relies on future purchases by a consumer who has increasingly less purchasing power – look like historically? The chart below shows the quarterly change in the revised GDP series broken down by Inventory (yellow) and all other non-Inventory components comprising GDP (blue).

But where the scramble to accumulate inventory in hopes that it will be sold, profitably, sooner or later to buyers either domestic or foreign, is seen most vividly, is in the data from the past 4 quarters, or the trailing year starting in Q3 2012 and ending with the just released revised Q3 2013 number. The result is that of the $534 billion rise in nominal GDP in the past year, a whopping 56% of this is due to nothing else but inventory hoarding.

The problem with inventory hoarding, however, is that at some point it will have to be “unhoarded.” Which is why expect many downward revisions to future GDP as this inventory overhang has to be destocked.


via Zero Hedge http://feedproxy.google.com/~r/zerohedge/feed/~3/QkLZ1Fv_r2g/story01.htm Tyler Durden

New Orders Drop Most Since July Led By Plunge In Defense

Despite a modest beat at the headline Factory Orders (-0.9% vs -1.0% expectation), this is still the largest drop in orders since July following a revision upward for last month.

  • *U.S. OCT. DURABLES ORDERS DROP 1.6%; NON-DURABLES FALL 0.2%

Non-defense capital goods saw a 3.4% plunge (SA) – also the largest drop since July and defense capital goods orders tumbled 15.8% (from a 19.1% rise last month). The volatility and broken seasonality (due to the government shutdown) makes this series extremely noisy but overall, despite the modest beat, the trend is down notably.


via Zero Hedge http://feedproxy.google.com/~r/zerohedge/feed/~3/YI13FGRkrrU/story01.htm Tyler Durden

France Unemployment Surges To 16 Year High

Europe’s second largest economy and crucial to the core founding partnership of the euro project, France, has seen its unemployment rate rise unceasingly for 9 quarters in a row now. At 11.03%, French unemployment has not been higher since Q3 1997. Of course, President Hollande, despite falling PMIs and rising unemployment is hopeful that things are turning around as he notes, France is “now in a phase of stabilization that remains very fragile.” Some optimism can be taken from the relative stability in youth unemployment for a change but the over-50s unemployment reached an all-time high of 8.2%.


Chart: Bloomberg


via Zero Hedge http://feedproxy.google.com/~r/zerohedge/feed/~3/7DDrZEHxjj4/story01.htm Tyler Durden

David Tepper Follows Baupost In Returning Excess Cash To Investors

Yesterday it was Seth Klarman’s Baupost, today it is David Tepper’s Appaloosa Managament which is set to return between $1.5 and $2 billion. As reported by II Alpha, Tepper’s firm will return up to $2 billion in an effort to keep the firm’s funds at an optimal size. However, unlike Baupost and various other hedge funds returning cash due to lack of investment opportunities or simply shutting down, “Appaloosa regularly gives back money to investors when it feels it is getting too big. This will be the third straight year Appaloosa has returned capital to investors. Over the years, Tepper has already returned about $8 billion to investors since starting the firm in 1993. The Pittsburgh native’s goal is to keep the fund size at levels he deems optimal at any given time.”

More from Alpha:

The firm now manages more than $20 billion. Tepper recently told Bloomberg Television he is up more than 40 percent gross this year. Last year Tepper made $2.2 billion — ranking first on Alpha’s Rich List for the second time in the past four years — after posting a net 30 percent gain.


At the start of 2013, Appaloosa was only the 25th largest hedge fund firm in the world. This is remarkable given that Tepper could probably be managing two to three times as much money if he wanted given that Appaloosa is probably the most successful hedge fund firm of all time among those not reliant on a black box or algorithms for trading. Since inception, it has posted a net annualized return of 28.44 percent.


What’s more, Tepper has bucked a common problem in the money management world, which is that firms’ returns often decline the more assets they manage. In the most recent five-year period, Appaloosa’s net return was even higher — 30.54 percent. And this does not include 2013, which looks to beat his long-term record. So it was no surprise that Tepper was recently inducted into the Alpha Hedge Fund Hall of Fame.

Naturally, if Tepper is correct as disclosed in his now quarterly appearances in various financial TV media, and PE multiples rise to 20x as a result of Bernanke’s largesse, he will certainly be returning far more cash in the future.


via Zero Hedge http://feedproxy.google.com/~r/zerohedge/feed/~3/lbAmhlbZwtk/story01.htm Tyler Durden

US "Good News" & Draghi Disappointment Sends Stocks Reeling

The better-than-expected data in the US had the requisiste good-news-is-bad-news reaction as stocks dumped (giving back all the EURJPY-driven gains), Treasury yields jumped, and gold and silver tumbled (in a deja vu of the last time Bitcoin and gold reached parity). At the same time, Draghi cut inflation forecasts, raised downside risks, hinted at less likelihood of another LTRO and noted negative rate discussions but did nothing and that sent EUR higher and implicitly USD broke lower. European stocks are also in trouble once again (even as European sovereign bond spreads are holding steady in their illiquid way). With EURJPY pausing (on Draghi’s comments), we look to USDJPY to provide the requisite lift at the cash open in the US


via Zero Hedge http://feedproxy.google.com/~r/zerohedge/feed/~3/yHtfj2VCJNs/story01.htm Tyler Durden

US “Good News” & Draghi Disappointment Sends Stocks Reeling

The better-than-expected data in the US had the requisiste good-news-is-bad-news reaction as stocks dumped (giving back all the EURJPY-driven gains), Treasury yields jumped, and gold and silver tumbled (in a deja vu of the last time Bitcoin and gold reached parity). At the same time, Draghi cut inflation forecasts, raised downside risks, hinted at less likelihood of another LTRO and noted negative rate discussions but did nothing and that sent EUR higher and implicitly USD broke lower. European stocks are also in trouble once again (even as European sovereign bond spreads are holding steady in their illiquid way). With EURJPY pausing (on Draghi’s comments), we look to USDJPY to provide the requisite lift at the cash open in the US


via Zero Hedge http://feedproxy.google.com/~r/zerohedge/feed/~3/yHtfj2VCJNs/story01.htm Tyler Durden

Deposit Confiscation Poses A Real Risk To Investors, Savers and Corporate Depositors (Part II)

Today’s AM fix was USD 1,234.00, EUR 907.69 and GBP 754.79 per ounce.             
Yesterday’s AM fix was USD 1,213.00, EUR 892.57 and GBP 741.13 per ounce.

Gold climbed $20.70 or 1.69% yesterday, closing at $1,243.40/oz. Silver rose $0.62 or 3.24% closing at $19.74/oz. Platinum climbed $20.75, or 1.5%, to $1,375.00/oz and palladium was also up  $13.97 or 2%, to $727.47/oz.

Gold bounced sharply higher yesterday as traders went long, leading to a bout of short covering. Gold looks very oversold according to the relative strength index and other indicators. Gold was also supported by the emergence of Indian demand as jewellery, coin and bar providers stocked up at these lower prices for the ongoing marriage season.

Ongoing speculation that data tomorrow may reinforce the case for the Federal Reserve to cut back on its radical $20 billion per week bond buying programme is making traders hesitant to go long.

This is leading to a lack of bullishness and animal spirits in the paper gold market. But the global physical market is seeing a different dynamic with continuing robust global demand and gold demand set for new records this year – particularly in China and Asia.

Indian gold premiums hit another record today, driven by low supplies to meet firm demand for weddings, which will continue until May. Local prices were $150 to $160 per ounce higher than London prices, compared with $125 earlier this week, traders said as reported by Reuters.

Shanghai gold closed at $1,259.88/oz, a premium of $22 over COMEX prices showing Chinese demand continues. Chinese New Year is on January 31, 2014, and we would expect to see renewed Chinese buying on this latest dip in prices.
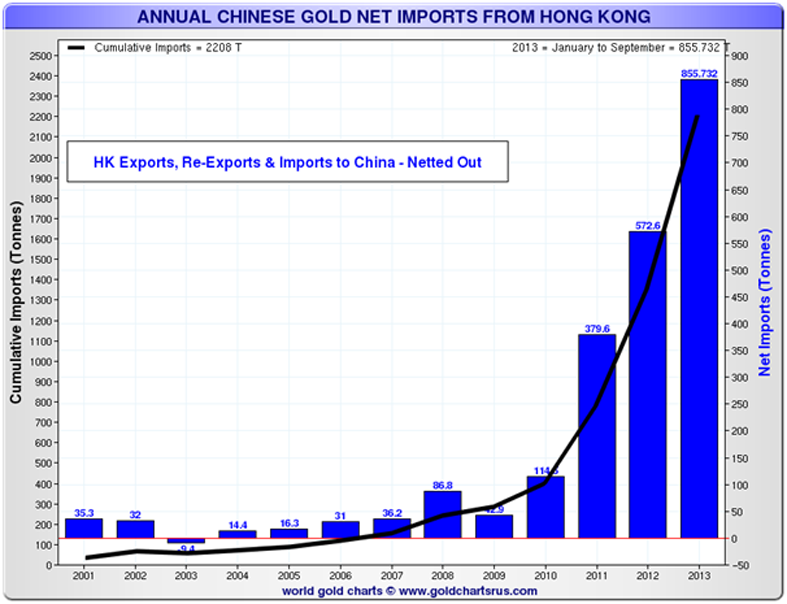

Annual Chinese Gold Net Imports – 2001 to 2013 YTD

Chinese imports through Hong Kong alone are set to top 1,000 tonnes this year and this does not include other gold imports into China ex Hong Kong. Therefore, total Chinese gold demand could be as high as 2,000 tonnes. Total annual gold supply is expected to be around the 2,700 tonne mark. Therefore, China could swallow up nearly 75% of global gold mine supply.

It is important to note that the huge demand in tonnage terms, 1,000 tonnes and possibly as high as 2,000 tonnes, is only worth roughly $39 billion and $78 billion in dollar terms or nearly what the Federal Reserve is printing every single month since late 2012.

Why Bail-Ins Are Important To Investors, Savers and Corporate Depositors
‘From Bail-Outs to Bail-Ins: Risks and Ramifications’ is a research document about one of the most important risks facing investors, savers, corporate and all depositors today – bank and financial institution bail-ins.

Preparations have been or are being put in place by the international monetary and financial authorities for bail-ins of both banks but also other financial institutions. The majority of the public are unaware of these developments, the risks and the ramifications.

In March 2013, the EU and IMF spearheaded the restructuring of the troubled Cypriot banking sector. Although the terminology of bank ‘bail-ins’ first entered public consciousness during the Cypriot financial crisis of March 2013, the idea of bail-ins as a central bank rescue mechanism has been openly discussed for a number of years amongst international central bank policymakers.

Cyprus became the defining event since it revealed the preparations and planning of international banking regulators and governments at the highest levels for the coming ‘Bail-In Regime’.

The market’s expectation was that Cyprus would be similar to previous Eurozone rescue packages applied to economies such as Greece, Ireland and Spain, where banks had their losses ‘bailed-out’ by governments, with the bail-out cost and risk transferred to the sovereign nation and funded by the taxpayer.

However, the backlash from taxpayers and certain political parties and a vicious circle of sovereign bank-induced debt was leading to recessions and the possibility of an economic depression. This may have contributed to the international monetary authorities, central banks and governments altering the approach to burden sharing, pushing the losses onto bank depositors.

The important shift from bail-out to bail-in had not been signalled in a very public way. The market’s expectation was therefore confounded when Eurozone finance ministers imposed bail-ins on Cyprus. This forced bondholders to convert into shareholders, and critically, imposed an element of bank deposit confiscation and the forced conversion of these deposits into bank equity.

Never before in the public’s perception had bank deposits been countenanced as potential financing sources for the rescue of insolvent banks. The public was shocked by the freezing and confiscation of deposits and the use of them in a desperate attempt to prevent banks from failing.

While bail-in generally refers to a bank restructuring where shareholders and various unsecured creditors such as bondholders are forced to share the rescue costs, after Cyprus, the term ‘bail-in’ became synonymous with possible deposit confiscation, where uninsured depositors were seen as unsecured creditors of the bank and liable to share bank restructuring costs.

The coming bail-ins regimes will pose real challenges and risks to investors and of course depositors – both household and corporate. Return of capital, rather than return on capital will assume far greater importance.

Evaluating counterparty risk and only using the safest banks, investment providers and financial institutions will become essential in order to protect and grow capital and wealth.

It is important that one owns physical gold and not paper or electronic gold which could be subject to bail-ins.
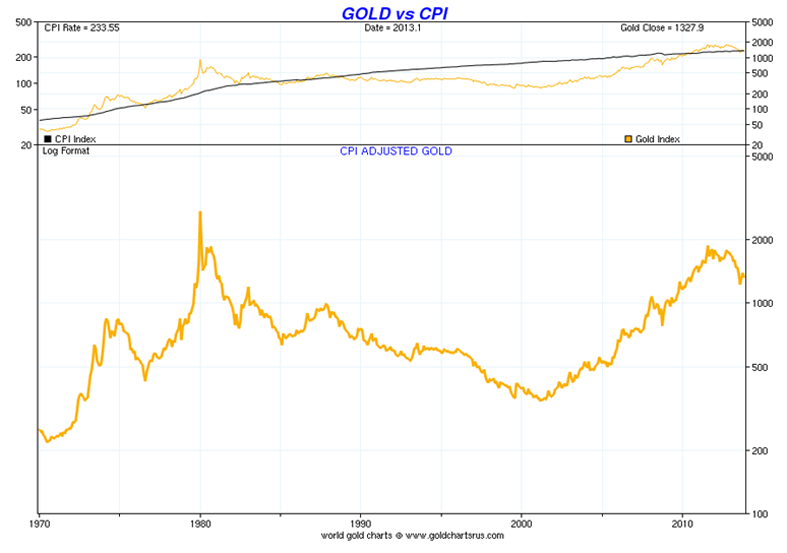
Owning a form of paper gold and derivative gold such as an exchange traded fund (ETF) in which one is an unsecured creditor of a large number of custodians, who are banks which potentially could be bailed in, defeats the purpose of owning gold.

Physical gold, held in secure storage conferring outright legal ownership through bailment remains the safest way to own gold. Many gold investment vehicles result in the buyers having very significant, unappreciated exposure and very high counterparty risk.

Retail investors, retail savers, high net worth individuals, family offices, pension funds, charities, companies, corporations, corporate treasurers, financial advisors, accountants and anyone who manages money on behalf of clients need to consider the risks and ramifications of bail-ins.

Many in the financial services sector have paid lip service to diversification in recent years. This has led to many investors experiencing sub par returns and returns below the market rate of return. Those who have achieved real diversification involving owning inter
national equities, high credit bonds, property, cash and gold have been protected from the recent volatility.

If there is a failure to observe the fundamental tenet of investing in the coming years – real diversification – we may be subject to further financial pain.

Conservative wealth management, asset diversification and wealth preservation are of paramount importance today.

Gold will again have a fundamentally important role to play in order to protect, preserve and grow wealth in the coming bail-in era.

Download our Bail-In Guide: Protecting your Savings In The Coming Bail-In Era(11 pages)

Download our Bail-In Research: From Bail-Outs to Bail-Ins: Risks and Ramifications (51 pages)


via Zero Hedge http://feedproxy.google.com/~r/zerohedge/feed/~3/Jes3vHo40yA/story01.htm GoldCore

Initial Claims Tumble To 298K As BLS Warns Of "Holiday Volatility"

If yesterday’s “great” news in the form of a 200K+ ADP, which sent the market sliding, was offset by the “ugly” news of the Service ISM which sent stocks soaring, today there are only “good cops” – first it was the revised Q3 GDP number print far above most expectations, purely on the back of inventory accumulation which however will now detract materially from Q4 growth, and at the same time, feeding the taper fire, the DOL announced that claims for the week ended November 30, which tumbled to 298,000 a 23K drop from a last week’s upward revised 321K, the best print since September 2013, and the biggest beat of expectations of 320K since also September 2013, which was when the DOL started upgrading various computer systems making all data unreliable.

Continuing claims also declined by 21K to 2,744K, below expectations of 2800K and down from a revised 2765K.

And while futures assume the number immediately means the probability of a December taper surges, the DOL quietly added that it is “not unusual for claims to be volatile in holidays.”

In other words, the random number generator was working overtime and expect next week’s claims print to be well in the mid-300s.


via Zero Hedge http://feedproxy.google.com/~r/zerohedge/feed/~3/B1kZnk8krnA/story01.htm Tyler Durden

Initial Claims Tumble To 298K As BLS Warns Of “Holiday Volatility”

If yesterday’s “great” news in the form of a 200K+ ADP, which sent the market sliding, was offset by the “ugly” news of the Service ISM which sent stocks soaring, today there are only “good cops” – first it was the revised Q3 GDP number print far above most expectations, purely on the back of inventory accumulation which however will now detract materially from Q4 growth, and at the same time, feeding the taper fire, the DOL announced that claims for the week ended November 30, which tumbled to 298,000 a 23K drop from a last week’s upward revised 321K, the best print since September 2013, and the biggest beat of expectations of 320K since also September 2013, which was when the DOL started upgrading various computer systems making all data unreliable.

Continuing claims also declined by 21K to 2,744K, below expectations of 2800K and down from a revised 2765K.

And while futures assume the number immediately means the probability of a December taper surges, the DOL quietly added that it is “not unusual for claims to be volatile in holidays.”

In other words, the random number generator was working overtime and expect next week’s claims print to be well in the mid-300s.


via Zero Hedge http://feedproxy.google.com/~r/zerohedge/feed/~3/B1kZnk8krnA/story01.htm Tyler Durden