Which Is It? According To The BLS, The Average Monthly Job Gain In 2013 Is Either 184K Or 20% Lower

Back in September in “This Is What Happens When The Bureau Of Labor Statistics Is Caught In A Lie” (a topic that has gained substantial prominence recently), we concluded our series exposing BLS data “massaging”, when as we predicted the monthly JOLTS survey, which had been trending at an implied monthly job gain of 140K and diverging massively from the NFP average of 198K, as can be seen on the chart below…


… finally caught up with reality, resulting in the single biggest monthly outlier in the data stream in the history of the survey.

To be sure, we explicitly warned ahead of time that a massive data revision was imminent as never before had two congruent series diverged so spectacularly. Specifically we said “This means that either the JOLTS survey is substantially under-representing the net turnover of workers, or that once the part-time frenzy in the NFP data normalizes, the monthly job gains will plunge to just over 100K per month to “normalize” for what has been a very peculiar upward “drift” in the NFP “data.”

Even Bill Gross read our prior post on the topic from August and tweeted his personal observations:

Of course, now that this record outlier is in the history books, it is in the BLS’ interest to slowly but surely “massage” it out with historical revisions. And following today’s just released most recent JOLTS report, the BLS has started to make sure that its own two key job datasets no longer diverge so much as to make a completely mockery of its “data” collection and analysis. This is shown in the chart below.

We are confident that with every passing month, silent revisionist history will allow the BLS to smooth out all the prior “data” until the July “sore thumb” outlier is perfectly subsumed in the trailing average. Which is why will keep the original data as long as needed to keep reminding the BLS that someone keeps watch.

But while the above is indicative of BLS data manipulation, both concurrent and historic, a bigger issue is that even with the adjusted data, there is still a rather notable problem when it comes to reports of the US employment.

The reason is that as we have been explaining for the greater part of 2013, the data sets showing NFP job gains and the Net turnover from JOLTS (hires less separations) has to by definition match. And for the most part it has as can be seen in the chart from the start of 2011:

What is not evident on the chart above is what happens when one zooms in only on the data in 2013, and specifically what the average monthly job gain is per the BLS’ nonfarm payrolls report on one hand – perhaps the most watched number in history now that the Fed’s tapering and perhaps QE-ending decisions all are “data dependent” just on this series – and what the JOLTS Net Turnover series shows.

It shows the following:

In short: from January to September (we exclude the October 204K print as there is no matching JOLTS number yet) the average monthly jobs gain per the Non-farm Payrolls report is 184K. However, when looking at the implied job gains per the JOLTS Net Turnover, this number is a far more disturbing 150K, some 20% lower.

Keep in mind this is using the adjusted, post-revision data, prior to which JOLTS suggested an average monthly gain as low as 125K.

This is a crucial difference and one which may be very critical in the eyes of the Fed when deciding on whether or not to taper in December, or March. Because now that we have entered a period in which the Fed itself is talking down the impact of “overoptimistic” jobs data in an attempt to delay tapering as much as possible, even invoking the labor force participation rate as a mitigating factor in the unemployment rate drop, what Bernanke and soon Yellen need, is another core data series showing the reality is actually worse than is being represented.

And what better source than the BLS’ own “secondary” survey of jobs?

Finally, one wonders: why does the NFP report so persistently over-represent jobs and under-represent employment? Because if the only purpose of US economic data is to serve a political agenda, one can see why the only variable that matters in the New Normal is the Fed.


via Zero Hedge http://feedproxy.google.com/~r/zerohedge/feed/~3/lJh7AMf-rPg/story01.htm Tyler Durden

Dollar's 30 Year Slide May Be Gold's New Life: 2014 Outlook

Today’s AM fix was USD 1,241.75, EUR 918.59 and GBP 766.75 per ounce.
Yesterday’s AM fix was USD 1,248.50, EUR 929.64 and GBP 775.76 per ounce.

Gold fell $1.50 or 0.12% yesterday, closing at $1,243.20/oz. Silver climbed $0.14 or 0.71% closing at $19.99/oz. Platinum rose $4.60 or 033% to $1,389.50/oz, while palladium climbed $3.78 or 0.53% to $714.75/oz.

Download here: Talking Real Money: Barter v Bitcoin

Many traders and investors are still scratching their heads at the peculiar gold trading Wednesday which pushed gold below the important technical level of $1,250/oz. Support at $1,250/oz has been breached and gold is vulnerable of a fall to test support at $1,200/oz and the June 28th low of $1,180/oz (see charts below).


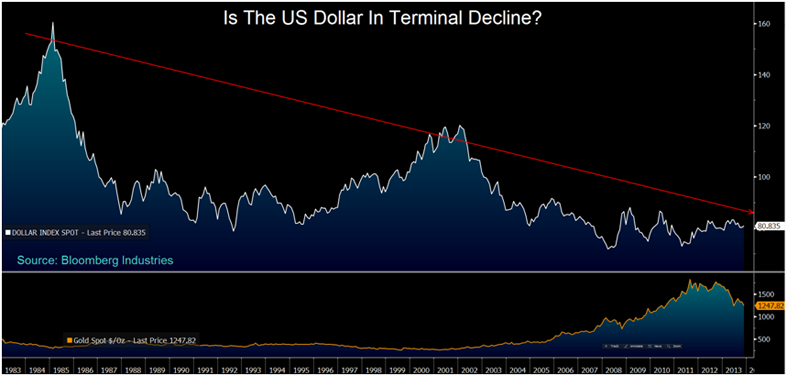
US Dollar Index – 1983 to Today (Bloomberg Industries)
 
And yet gold still seems to be stuck in a downtrend. This week’s sell off may have been due to trading shenanigans on the COMEX and many, including the UK Financial Regulator are asking questions as to whether gold price rigging is taking place.

Gold’s falls come despite there being many compelling reasons for gold to rally. These include uber dove Yellen at the Fed’s helm, the near certainty that the Eurozone debt crisis will erupt early in the New Year, signs ETF outflows are stabilizing and China picking up the slack with regard to physical demand, after India’s demand fell from near record levels.


Gold in U.S. Dollars, 5 Days – (Bloomberg)

THE U.S. DOLLAR has been on a 30 year slide versus other competing paper currencies, in particular the Chinese yuan. If the dollar’s decline, as measured by the DXY Index continues, gold may be the main beneficiary.

The dollar may be printed in unlimited quantities, though the global stock of gold increases by just 2% to 2.5% annually. Irrespective, of the huge increase in money supplies globally today. Indeed, should gold prices fall more, gold production is likely to begin falling.

This is seemingly lost on Janet Yellen and central banks, who continue to print money at record rates.

The smart money who understand gold’s importance as a diversification continue to accumulate gold.

The very poor state of the U.S. economy bodes badly for the U.S. dollar in 2014 which should help gold resume its multi year bull market.


Gold in U.S. Dollars, 1 Year – (Bloomberg)

DATA FROM THE INTERNATIONAL MONETARY FUND today shows that central banks continued to diversify into gold in October.

Turkey’s holdings rose the most, with the central bank adding a large 12.994 tonnes – 16.18 million oz vs. 15.762 million oz.  Kazakhstan’s gold reserves rose 2.4 tons and Azerbaijan’s gold reserves increased 2 tonnes last month.

Germany, the world’s second biggest holder of gold reserves, cut its bullion holdings by a tiny amount in October for the second time in five months.  Germany’s gold holdings dropped to 108.9 million ounces from 109.01 million ounces in September. The reduction was likely for domestic gold coin sales.


Gold in U.S. Dollars  and Suspensions Of COMEX Gold Trading – 3 Month (Bloomberg)

GOLDMAN SACHS Inc. has come out with another of their widely covered market predictions.

Gold, iron ore, soybeans and copper will probably drop at least 15% next year as commodities face increased downside risks even as economic growth in the U.S. accelerates, according to Goldman.

As we noted before, Goldman’s gold calls and crystal gazing have been poor at best. Indeed, some suspect that while Goldman is advising clients to sell, they may be on the other side of the the trade going long.

News This Week
* China to Start Interbank Gold Swap Trading November 25
China, on track to overtake India as the world’s largest gold consumer this year, will start interbank swaps trading next week in a move to further open up the domestic precious metals market. China gold swaps to trade on China Foreign Exchange Trade System, according to a statement on CFETS website yesterday. Gold swaps to settle and deliver via Shanghai Gold Exchange.
(Bloomberg)

* China’s planned crude oil futures may be priced in yuan 
 The Shanghai Futures Exchange (SHFE) may price its crude oil futures contract in yuan and use medium sour crude as its benchmark, its chairman said on Thursday, adding that the bourse is speeding up preparatory work to secure regulatory approvals.

China, which overtook the United States as the world’s top oil importer in September, hopes the contract will become a benchmark in Asia and has said it would allow foreign investors to trade in the contract without setting up a local subsidiary.
(Reuters)

* Germany Lowers Gold Reserves in October, IMF Data Show
Holdings drop to 108.9 Million ounces vs. 109.01 Million ounces in September., data on IMF website show. (Note: Likely for domestic gold coin sales)
(Bloomberg)

* Gold-Put Options Surge as Futures Slump to Lowest in Four Months
Put options on gold, giving the owners the right to sell Dec. futures at $1,200/oz and $1,250/oz, more than tripled on the Comex in New York after the metal slumped to a four-month low.
Puts giving the owner the right to sell at $1,200 rose to $2.30 from 70c on estimated volume of 1,259 contracts, the third most-active option.

Puts giving the owner the right to sell at $1,250 jumped to $15.10, the highest in a month, on estimated volume of 2,206 contracts, the most-active option
Futures for Dec. delivery fell as much as 2.6% to $1,240.20/oz, the lowest since July 9
(Bloomberg)

* China Oct. Silver Imports 230.8 Tons, Customs Says
Silver imports by China were 230.8 tons in Oct., compared with 243 tons in Sept., according to data released by customs agency today
(Bloomberg)

* UBS Estimates 36% of South Africa Gold Industry is Losing Money
Estimate based on spot price of $1,260/oz, UBS says in report dated yday.
In 3Q, 28% of SA gold industry was loss-making, based on gold price of $1,330/oz
Sector lowered 3Q all-in costs by 20% q/q to $1,138/oz
“Further unit cost reductions will be challenging to deliver”
(Bloomberg)

* CME Lowers Gold and Silver Margins
CME lowers Comex 100 Gold futures (GC) initial margins for specs by 9.4 percent to $7,975 per contract from $8,800
CME lowers Comex 5000 Silver futures (SI) initial margins for specs by 11.1 percent to $11,000 per contract from $12,375
(Reuters)

Conclusion
There is likely a floor under gold prices at the $1,200 level and that should again provide strong support. There are no guarantees regarding price ever – particularly in the short term. However, gold production may fall at prices below $1,200 as it becomes uneconomical for man
y gold mines to operate profitably.

In South Africa, no longer the world’s largest producer, (which is now China) but still a major producer, there are estimates that 36% of the South African gold industry are loss making even at today’s spot prices – $1,250/oz. In 3Q, 28% of the South African gold industry was loss making, based on a gold price of $1,330/oz.

The short term technicals remain poor and the trend remains lower so we remain bearish for next week despite the strong seasonals. November, December and January are traditionally strong months for gold due to year end fund allocation and in recent years Chinese New Year demand.

It remains prudent to ignore short term noise and day to day price movements. Instead focus on physical gold’s importance, either in your possession or in allocated gold accounts, as financial insurance and as a vital diversification for investors and savers today.

Download here: Talking Real Money: Barter v Bitcoin

Click Gold News For This Week’s Breaking Gold And Silver News
Click Gold and Silver Commentary For This Week’s Leading Gold, Silver Opinion
Like Our Facebook Page For Interesting Insights, Blogs, Prizes and Special Offers


via Zero Hedge http://feedproxy.google.com/~r/zerohedge/feed/~3/60xAd5YJI10/story01.htm GoldCore

Dollar’s 30 Year Slide May Be Gold’s New Life: 2014 Outlook

Today’s AM fix was USD 1,241.75, EUR 918.59 and GBP 766.75 per ounce.
Yesterday’s AM fix was USD 1,248.50, EUR 929.64 and GBP 775.76 per ounce.

Gold fell $1.50 or 0.12% yesterday, closing at $1,243.20/oz. Silver climbed $0.14 or 0.71% closing at $19.99/oz. Platinum rose $4.60 or 033% to $1,389.50/oz, while palladium climbed $3.78 or 0.53% to $714.75/oz.

Download here: Talking Real Money: Barter v Bitcoin

Many traders and investors are still scratching their heads at the peculiar gold trading Wednesday which pushed gold below the important technical level of $1,250/oz. Support at $1,250/oz has been breached and gold is vulnerable of a fall to test support at $1,200/oz and the June 28th low of $1,180/oz (see charts below).


US Dollar Index – 1983 to Today (Bloomberg Industries)
 
And yet gold still seems to be stuck in a downtrend. This week’s sell off may have been due to trading shenanigans on the COMEX and many, including the UK Financial Regulator are asking questions as to whether gold price rigging is taking place.

Gold’s falls come despite there being many compelling reasons for gold to rally. These include uber dove Yellen at the Fed’s helm, the near certainty that the Eurozone debt crisis will erupt early in the New Year, signs ETF outflows are stabilizing and China picking up the slack with regard to physical demand, after India’s demand fell from near record levels.


Gold in U.S. Dollars, 5 Days – (Bloomberg)

THE U.S. DOLLAR has been on a 30 year slide versus other competing paper currencies, in particular the Chinese yuan. If the dollar’s decline, as measured by the DXY Index continues, gold may be the main beneficiary.

The dollar may be printed in unlimited quantities, though the global stock of gold increases by just 2% to 2.5% annually. Irrespective, of the huge increase in money supplies globally today. Indeed, should gold prices fall more, gold production is likely to begin falling.

This is seemingly lost on Janet Yellen and central banks, who continue to print money at record rates.

The smart money who understand gold’s importance as a diversification continue to accumulate gold.

The very poor state of the U.S. economy bodes badly for the U.S. dollar in 2014 which should help gold resume its multi year bull market.


Gold in U.S. Dollars, 1 Year – (Bloomberg)

DATA FROM THE INTERNATIONAL MONETARY FUND today shows that central banks continued to diversify into gold in October.

Turkey’s holdings rose the most, with the central bank adding a large 12.994 tonnes – 16.18 million oz vs. 15.762 million oz.  Kazakhstan’s gold reserves rose 2.4 tons and Azerbaijan’s gold reserves increased 2 tonnes last month.

Germany, the world’s second biggest holder of gold reserves, cut its bullion holdings by a tiny amount in October for the second time in five months.  Germany’s gold holdings dropped to 108.9 million ounces from 109.01 million ounces in September. The reduction was likely for domestic gold coin sales.


Gold in U.S. Dollars  and Suspensions Of COMEX Gold Trading – 3 Month (Bloomberg)

GOLDMAN SACHS Inc. has come out with another of their widely covered market predictions.

Gold, iron ore, soybeans and copper will probably drop at least 15% next year as commodities face increased downside risks even as economic growth in the U.S. accelerates, according to Goldman.

As we noted before, Goldman’s gold calls and crystal gazing have been poor at best. Indeed, some suspect that while Goldman is advising clients to sell, they may be on the other side of the the trade going long.

News This Week
* China to Start Interbank Gold Swap Trading November 25
China, on track to overtake India as the world’s largest gold consumer this year, will start interbank swaps trading next week in a move to further open up the domestic precious metals market. China gold swaps to trade on China Foreign Exchange Trade System, according to a statement on CFETS website yesterday. Gold swaps to settle and deliver via Shanghai Gold Exchange.
(Bloomberg)

* China’s planned crude oil futures may be priced in yuan 
 The Shanghai Futures Exchange (SHFE) may price its crude oil futures contract in yuan and use medium sour crude as its benchmark, its chairman said on Thursday, adding that the bourse is speeding up preparatory work to secure regulatory approvals.

China, which overtook the United States as the world’s top oil importer in September, hopes the contract will become a benchmark in Asia and has said it would allow foreign investors to trade in the contract without setting up a local subsidiary.
(Reuters)

* Germany Lowers Gold Reserves in October, IMF Data Show
Holdings drop to 108.9 Million ounces vs. 109.01 Million ounces in September., data on IMF website show. (Note: Likely for domestic gold coin sales)
(Bloomberg)

* Gold-Put Options Surge as Futures Slump to Lowest in Four Months
Put options on gold, giving the owners the right to sell Dec. futures at $1,200/oz and $1,250/oz, more than tripled on the Comex in New York after the metal slumped to a four-month low.
Puts giving the owner the right to sell at $1,200 rose to $2.30 from 70c on estimated volume of 1,259 contracts, the third most-active option.

Puts giving the owner the right to sell at $1,250 jumped to $15.10, the highest in a month, on estimated volume of 2,206 contracts, the most-active option
Futures for Dec. delivery fell as much as 2.6% to $1,240.20/oz, the lowest since July 9
(Bloomberg)

* China Oct. Silver Imports 230.8 Tons, Customs Says
Silver imports by China were 230.8 tons in Oct., compared with 243 tons in Sept., according to data released by customs agency today
(Bloomberg)

* UBS Estimates 36% of South Africa Gold Industry is Losing Money
Estimate based on spot price of $1,260/oz, UBS says in report dated yday.
In 3Q, 28% of SA gold industry was loss-making, based on gold price of $1,330/oz
Sector lowered 3Q all-in costs by 20% q/q to $1,138/oz
“Further unit cost reductions will be challenging to deliver”
(Bloomberg)

* CME Lowers Gold and Silver Margins
CME lowers Comex 100 Gold futures (GC) initial margins for specs by 9.4 percent to $7,975 per contract from $8,800
CME lowers Comex 5000 Silver futures (SI) initial margins for specs by 11.1 percent to $11,000 per contract from $12,375
(Reuters)

Conclusion
There is likely a floor under gold prices at the $1,200 level and that should again provide strong support. There are no guarantees regarding price ever – particularly in the short term. However, gold production may fall at prices below $1,200 as it becomes uneconomical for many gold mines to operate profitably.

In South Africa, no longer the world’s largest producer, (which is now China) but still a major producer, there are estimates that 36% of the South African gold industry are loss making even at today’s spot prices – $1,250/oz. In 3Q, 28% of the South African gold industry was loss making, based on a gold price of $1,330/oz.

The short term technicals remain poor and the trend remains lower so we remain bearish for next week despite the strong seasonals. November, December and January are traditionally strong months for gold due to year end fund allocation and in recent years Chinese New Year demand.

It remains prudent to ignore short term noise and day to day price movements. Instead focus on physical gold’s importance, either in your possession or in allocated gold accounts, as financial insurance and as a vital diversification for investors and savers today.

Download here: Talking Real Money: Barter v Bitcoin

Click Gold News For This Week’s Breaking Gold And Silver News
Click Gold and Silver Commentary For This Week’s Leading Gold, Silver Opinion
Like Our Facebook Page For Interesting Insights, Blogs, Prizes and Special Offers


via Zero Hedge http://feedproxy.google.com/~r/zerohedge/feed/~3/60xAd5YJI10/story01.htm GoldCore

Close Encounter Of The Tornado Kind: Watch What Happens When Nature's Fury Is Unleashed

Aside from the impressively calm demeanor of the gentleman holding the video camera, this disturbing clip of the Washington Tornado’s power offers a helpful (if not terrifying) analogy for how quickly calm serene surroundings (e.g. stock markets) can be “freaking destroyed” almost instantly by an external force.


And for the Keynesians, before you start babbling about the GDP growth in the rebuild – please visit the Broken Window Fallacy truth page.


via Zero Hedge http://feedproxy.google.com/~r/zerohedge/feed/~3/nX2Vf8vovok/story01.htm Tyler Durden

Close Encounter Of The Tornado Kind: Watch What Happens When Nature’s Fury Is Unleashed

Aside from the impressively calm demeanor of the gentleman holding the video camera, this disturbing clip of the Washington Tornado’s power offers a helpful (if not terrifying) analogy for how quickly calm serene surroundings (e.g. stock markets) can be “freaking destroyed” almost instantly by an external force.


And for the Keynesians, before you start babbling about the GDP growth in the rebuild – please visit the Broken Window Fallacy truth page.


via Zero Hedge http://feedproxy.google.com/~r/zerohedge/feed/~3/nX2Vf8vovok/story01.htm Tyler Durden

Spot The Manipulated FX Market Moment

With regulators finally catching on that banks are manipulating every asset class, the largest of them all – foreign exchange – has come under scrutiny. Most specifically, there is considerable attention being paid to manipulation at the “London Close” around 11amET each day. Judge for yourself – see anything ‘odd’ around that time of day?


Source: Nanex


via Zero Hedge http://feedproxy.google.com/~r/zerohedge/feed/~3/bbd3Vte2O5g/story01.htm Tyler Durden

Bill Ackman Admits $500 Million Herbalife Loss, Stock Surge Adds To Pain

Herbalife shares are soaring this morning. The reason, it seems, is unclear; but Bill Ackman's appearance on Bloomberg TV to press his shorts a little more may just have emboldened those looking to squeeze the asset manager:

  • *ACKMAN: HERBALIFE LONGS DID PRETTY GOOD JOB OF SHORT SQUEEZING
  • *ACKMAN SAYS HE'S LOST $400M TO $500M ON HERBALIFE SHORT
  • *ACKMAN SAYS `LOTS OF WAYS WE CAN BE SUCCESSFUL' ON HLF
  • *ACKMAN SAYS HE'LL TAKE HERBALIFE BET 'TO THE END OF THE EARTH'

Ackman added that he "skeptical" of Icahn's long-term interest, and "puzzled" by Stiritz' motivations. It seems – other than fear-mongering – the stock is rising on the basis Ackman has nothing new to add…

  • *ACKMAN SAYS HE DOESN'T KNOW WHAT FTC IS DOING ON HERBALIFE
  • *ACKMAN: RE-AUDIT IS A SHORT TERM CATALYST IF NOT DONE BY DEC
  • *ACKMAN SAYS HERBALIFE FITS FTC OCT PYRAMID WARNING
  • *ACKMAN'S PERSHING HAS MET WITH FOREIGN REGULATORS HERBALIFE
  • *ACKMAN: HERBALIFE RE-AUDIT SHOULD HAVE BEEN COMPLETED BY NOW


As we noted in January 2, 2013

In short- could HLF, with 24% of its stock short, and where institutions control more than 76% of the shares outstanding, become the next Volkswagen squeeze play, and send the stock soaring far higher than ever before, in the process destroying Ackman (assuming he has still not covered his short), Tilson, and anyone else still short the name?

Maybe the answer to this question is just how much animosity does management harbor toward those very publicly short its stock. We hope to find out soon enough.

  • *ACKMAN SAYS AN HERBALIFE LBO IS MORE OPPORTUNITY TO GO SHORT

and the final nail in the coffin…

  • *ACKMAN SAYS HERBALIFE SHORT `NOT A TRADE FOR ME'

One has to wonder what his JCP "trade" started out as?


via Zero Hedge http://feedproxy.google.com/~r/zerohedge/feed/~3/fR5r_AbQC9Q/story01.htm Tyler Durden

Europe Unveils Its Latest Deus Ex Machina Growth Bazooka: Encourage Debt-Cutting "Reform" With Even More Debt

A year ago, in order to prevent the collapse of the Eurozone, the ECB came out with the first (of many) deus ex machina bazooka when it unveiled the OMT – a massive project so ambitious, it never actually existed (its legal term sheet has never been unveiled and never will be unveiled simply because it is by definition impossible) but was merely intended to scare everyone into submission by the ECB’s sheer will (or stupidity – it is still unclear which prevailed). One day, the OMT will be tested only to reveal it was never meant to be put into use, but until that day Mario Draghi managed to buy Europe some time. Today, the Eurozone unveiled just how it plans to spend that time – by coming up with deus ex plan #2: much more (unfunded) debt.

Just out from Reuters:

  • EURO ZONE COUNTRIES CONSIDERING CHEAP LOANS AS INCENTIVE FOR GOVERNMENTS TO ENACT ECON REFORMS-DOCUMENT
  • TO QUALIFY, COUNTRIES WOULD HAVE TO DRAW UP LEGALLY BINDING PLAN FOR REFORM APPROVED BY MEMBER STATES-DOC
  • LOANS WOULD NOT BE LINKED TO COST OF REFORM BUT MEANT AS GENERAL SUPPORT FOR THE ECONOMY-DOCUMENT
  • LOANS FOR REFORMS WOULD NOT BE AVAILABLE TO COUNTRIES RUNNING EXCESSIVE MACROECONOMIC IMBALANCES OR UNDER BAILOUT-DOC

In other words, “encourage” debt-cutting reforms by dangling the carrot of even more debt.

Circular reasoning aside, this is fine and good – as we have shown many times in the past, the biggest failure of the Eurozone currently is the complete collapse of its monetary piping, as private loan creation growth in the Eurozone drops to record low after record low with every passing month.

And since European inflation just took a turn for the worse, absent some massive debt-boost strategy things will only get worse. Which in turn explains why suddenly Europe is fixated – once again – on pumping inflation stimulating debt at any cost.

So while on the surface this plan would make sense, if only to buy Europe some more time, before the revelation that the current setup simply does not work, there is one major snag:

  • NO FIRM PLAN YET HOW TO FINANCE THE LOANS, WHICH COULD BECOME THE NUCLEUS OF A EURO ZONE BUDGET-DOC

Oops. Then again, there is always the ECB, which everyone now expected to unveil some new and improved inflation-boosting project in the near future. One can only assume they will somehow be involved in the “financing” component.

And finally there is another problem:

  • DIJSSELBLOEM REJECTS IDEA OF FINANCIAL INCENTIVES FOR REFORMS
  • DIJSSELBLOEM IN FAVOR OF DEADLINES FOR REFORMS: HANDELSBLATT

Ah Europe, never a dull day. At least we would be tentatively inching back into those 3x levered Brussels caterer ETFs. Because the return of European summits seems just around the horizon…


via Zero Hedge http://feedproxy.google.com/~r/zerohedge/feed/~3/UKGNfCpXvlM/story01.htm Tyler Durden

Europe Unveils Its Latest Deus Ex Machina Growth Bazooka: Encourage Debt-Cutting “Reform” With Even More Debt

A year ago, in order to prevent the collapse of the Eurozone, the ECB came out with the first (of many) deus ex machina bazooka when it unveiled the OMT – a massive project so ambitious, it never actually existed (its legal term sheet has never been unveiled and never will be unveiled simply because it is by definition impossible) but was merely intended to scare everyone into submission by the ECB’s sheer will (or stupidity – it is still unclear which prevailed). One day, the OMT will be tested only to reveal it was never meant to be put into use, but until that day Mario Draghi managed to buy Europe some time. Today, the Eurozone unveiled just how it plans to spend that time – by coming up with deus ex plan #2: much more (unfunded) debt.

Just out from Reuters:

  • EURO ZONE COUNTRIES CONSIDERING CHEAP LOANS AS INCENTIVE FOR GOVERNMENTS TO ENACT ECON REFORMS-DOCUMENT
  • TO QUALIFY, COUNTRIES WOULD HAVE TO DRAW UP LEGALLY BINDING PLAN FOR REFORM APPROVED BY MEMBER STATES-DOC
  • LOANS WOULD NOT BE LINKED TO COST OF REFORM BUT MEANT AS GENERAL SUPPORT FOR THE ECONOMY-DOCUMENT
  • LOANS FOR REFORMS WOULD NOT BE AVAILABLE TO COUNTRIES RUNNING EXCESSIVE MACROECONOMIC IMBALANCES OR UNDER BAILOUT-DOC

In other words, “encourage” debt-cutting reforms by dangling the carrot of even more debt.

Circular reasoning aside, this is fine and good – as we have shown many times in the past, the biggest failure of the Eurozone currently is the complete collapse of its monetary piping, as private loan creation growth in the Eurozone drops to record low after record low with every passing month.

And since European inflation just took a turn for the worse, absent some massive debt-boost strategy things will only get worse. Which in turn explains why suddenly Europe is fixated – once again – on pumping inflation stimulating debt at any cost.

So while on the surface this plan would make sense, if only to buy Europe some more time, before the revelation that the current setup simply does not work, there is one major snag:

  • NO FIRM PLAN YET HOW TO FINANCE THE LOANS, WHICH COULD BECOME THE NUCLEUS OF A EURO ZONE BUDGET-DOC

Oops. Then again, there is always the ECB, which everyone now expected to unveil some new and improved inflation-boosting project in the near future. One can only assume they will somehow be involved in the “financing” component.

And finally there is another problem:

  • DIJSSELBLOEM REJECTS IDEA OF FINANCIAL INCENTIVES FOR REFORMS
  • DIJSSELBLOEM IN FAVOR OF DEADLINES FOR REFORMS: HANDELSBLATT

Ah Europe, never a dull day. At least we would be tentatively inching back into those 3x levered Brussels caterer ETFs. Because the return of European summits seems just around the horizon…


via Zero Hedge http://feedproxy.google.com/~r/zerohedge/feed/~3/UKGNfCpXvlM/story01.htm Tyler Durden