Authored by Michael Lebowitz via RealInvestmentAdvice.com,
For $20,000, you can buy a global airline pass to see the world. Or, for the low price of free, you can take a quick trip with us worldwide. Unfortunately, our global trip is not as exciting as an around-the-world pass. Still, it may enlighten you about some economic struggles abroad. Moreover, why, in time, they may be problematic for the US.
China, Britain, Europe, and other countries and regions are experiencing sluggish economic growth and, in some cases, contraction. At the same time, the US continues its strong post-pandemic growth pace. Has the US economy diverged from the global economy, or are a lot of economic canaries in coalmines keeling over and warning the US is soon to catch down?

Globalization
Before summarizing economic conditions in a few major economies, it’s worth appreciating that globalization has tightly bonded the economic activity of the US and developed nation’s economies.
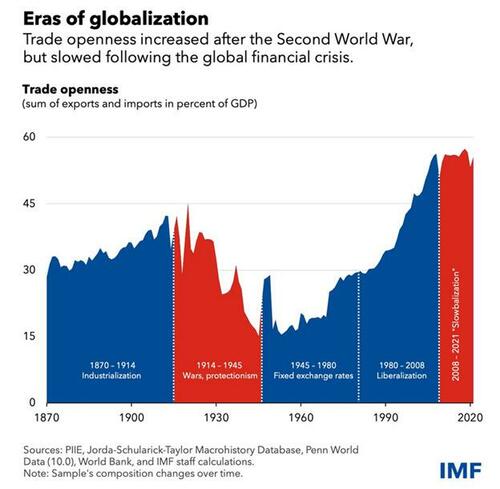
The graph below, courtesy of the IMF, shows that the amount of international trade as a percentage of global GDP is at the highest level since at least 1870. We venture to say it’s the highest ever. The recent upward trend starting in 1944 is the result of the dollar becoming the world’s reserve currency.
Based on data from the World Bank, the following graph shows powerful statistical economic relationships between the US and other nations and economic regions. The number beside each country in the X-axis is their global GDP rank.
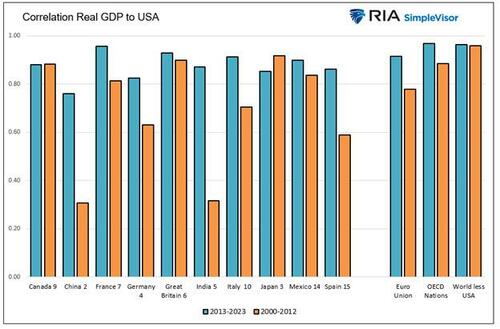
Other than Japan, the correlation between the real GDP of the US and that of every nation and region shown has increased over the last ten years compared to the prior twelve-year period. Equally important, the relationship between the US economy and the European Union, OECD nations, and the rest of the world is incredibly high. Those three aggregates exclude the US in their computations.
The graph below further highlights the strong relationships that globalization has brought upon US economic activity.
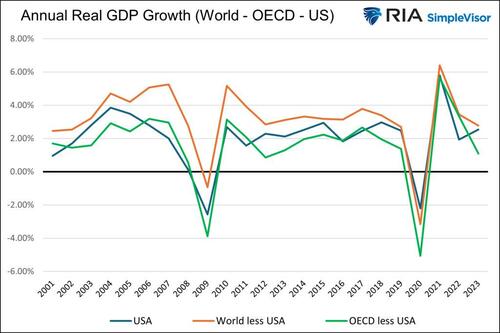
Regression Analysis Confirms Economic Globalization
Lastly, we created a multiple regression model to predict US real GDP based on the real GDP of the ten nations we highlighted in the prior graphs. Our model has an R-square of .886, denoting a significant statistical relationship.
The graph below compares the US real GDP versus the model’s output. The difference between the US GDP and the model averages slightly less than half a percent annually and doesn’t vary beyond +/- 1%.
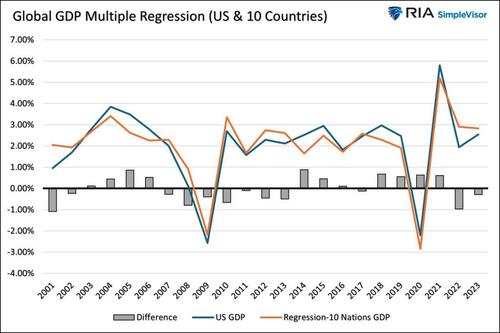
The US economy is tied at the hip to the global economy and economies of leading developed economies. Very short-term divergences occur, but barring a change to the world trade order or another round of massive US stimulus, it’s improbable that recent divergences will last.
Note: The data for the following graphs is through 2023; thus, it does not include 2024. Our discussion of economic divergence between the US and other nations primarily pertains to more recent data.
Britain
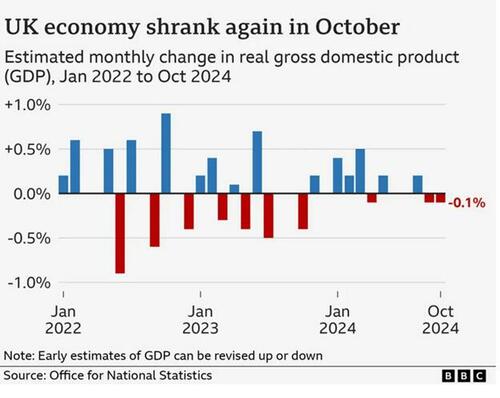
Britain’s real GDP, as shown below, courtesy of the BBC, has contracted for two months in a row. Furthermore, it has shown no growth since June.
Personal consumption is a contributor to weak UK growth. Per Bloomberg:
A big drag on the economy was consumer-facing services, where output tumbled 0.6%, including a 2% decline in pubs and restaurants. It suggests that households tightened their belts, possibly fearing a squeeze from the budget.
Consumer sentiment in Britain is poor. Its citizens are worried about above-average inflation and high interest rates. More recently, consumers appear to be pulling back due to increased proposed fiscal spending that will be funded with higher taxes and borrowing.
As with most nations, the fear of US tariffs weighs on UK consumer and business sentiment.
Lastly, it is worth noting that Britain’s real GDP growth in 2023 was a mere 0.10%. The nation has barely grown in two years!
Europe
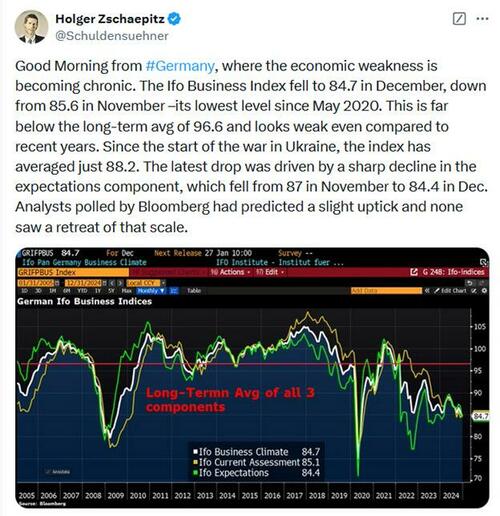
The European Union faces challenges similar to those faced by Britain. Europe’s economic powerhouse, Germany, saw its real GDP decline last year, and contraction will likely continue this year.
One large differentiator between paltry European growth and growth in the US is in the fiscal response to the pandemic. The US flooded its economy with stimulus during and well after the initial sting of the pandemic. Consumers were provided with funds and many other financial benefits, and the CHIPS Act fed infrastructure and manufacturing projects, further bolstering growth. While the European Union and its nations also stimulated economic activity, the amounts were much less. Per the Atlantic:
The UK and Germany spent more than $500 billion. France spent $235 billion, Italy $216 billion. But the United States was in a league of its own, spending an astonishing $5 trillion on pandemic relief. That’s more, even in today’s dollars, than America spent on the New Deal and World War II combined—and, crucially, it’s more than double what most European countries spent on pandemic relief relative to the sizes of their respective economies.
Further, consider that Russia’s invasion of Ukraine and the impact it has on energy prices is also to blame for sluggish growth along with a host of other political and social factors.
China
Before the financial crisis, China had grown its economy by 10-15% yearly. While remarkable, it was unsustainable. Since then, growth has slowed substantially, albeit it’s still high compared to most developed nations. From 2020 to 2023, its real GDP growth was a relatively low 4.1%. It is expected to remain below 5% for the remainder of this year and next year.
The nation is dealing with a credit hangover following decades of significant economic growth driven partly by massive infrastructure investment. Vacant cities and properties across China are leading to a decline in real estate activity, which once accounted for a significant portion of GDP. Construction and related industries have been negatively impacted, as has consumer sentiment.
Simultaneously, the country has a shrinking workforce and an aging population. Moreover, it faces weaker global export demand amid ongoing geopolitical tensions, particularly with the US. Trade restrictions and the post-pandemic redirection of global supply chains away from Chinese manufacturing have negatively impacted key industrial sectors. Lastly, business confidence is eroding due to recent government policies, including regulatory crackdowns on tech firms and mixed signals on private-sector stimulus.
High levels of corporate debt and local government borrowing have further limited fiscal flexibility, making the government’s recent spate of stimulus packages much less effective than prior stimulus. China’s bond investors are taking notice. As shown below, its ten-year sovereign bond yield is now below 2%, the lowest in history.
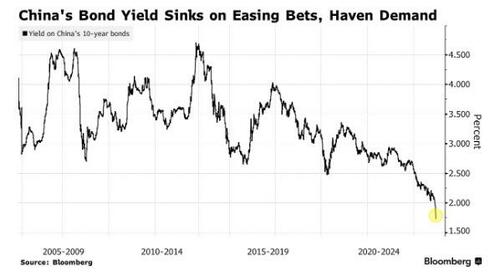
China, once the world’s marginal driver of economic growth, is exporting their economic slowdown across the globe.
Canada
We shared the following paragraph and graph from our recent Commentary on Canada:
On Wednesday, the Bank of Canada cut its key benchmark rate by 50bps. They have now cut by 150 bps in 2024, compared to what will likely be 100 bps for the Fed after next week’s meeting. Unlike the Fed, Canada’s central bank is fighting off a recession. Canadian real GDP for the last four quarters has been below 1%. Its unemployment rate troughed in January 2022 at a fifty-year low of 4.9%. However, since then, it has risen steadily to 6.8%. The Canadian dollar has been trading at its lowest levels compared to the US dollar since 2016 (excluding the pandemic).
We should pay attention because the US economy and Canada are extremely closely linked despite being different. The biggest differentiator is that Canada’s economy relies much more heavily on commodities and manufacturing, while the US is more service-sector-oriented. Despite the differences, there has been a historically tight economic relationship between Canada and the US, as shown below.

High interest rates and sluggish oil prices weigh on Canada’s economic growth. Unlike China, they are experiencing population growth. However, its growth masks economic weakness. Per The Fraser Institute:
Canada’s recent growth record has received so much attention because it is, quite simply, abysmal. One recent analysis noted that due to weak total growth accompanied by a surging population, Canada has actually been in a “per capita” recession for some time. Per-person GDP has declined by 3.4 percent in inflation-adjusted terms between the second quarter of 2022 and the final quarter of 2023.
Summary
We could summarize economic conditions in other developed countries, and in almost all cases, we would provide you with themes similar to those we share above. The takeaway is not necessarily the particulars of each country and region but the recent rare economic growth divergence between the US and the world.
The enormous pandemic and post-pandemic stimulus by the US government is a key factor explaining the difference. The US provided more stimulus on a GDP basis than all major developed economies. The stimulus was in the form of emergency payments, which had limited duration benefits. However, it also came in longer-lasting forms like the CHIPS Act and loan forgiveness programs, which continues to bolster growth.
Indeed, significant federal deficit spending has helped offset much higher interest rates and stubborn inflation. Consumer confidence remains weary, but consumers continue to spend as the labor markets are relatively healthy. While all may seem well, we are growing concerned that headwinds to growth, including the global economy and high interest rates, will weigh on the US economy.
As we wrote earlier, “Very short-term divergences occur, but barring a change to the world trade order or another round of massive US stimulus, it’s improbable that recent divergences will last.”
It’s more likely the US economy will catch down to the global economy!


