The US Budget “Deal” Summarized (In One Cartoon)

Context is key…

A greater-than $1 trillion (spending) budget heralded as a triumph on the basis that they raised $20 billion in additional revenue (oh and spent an additional $63 billion in anti-sequester outflows).

h/t Investors via The Burning Platform blog

And how the deal got done… Mother Jones explains… why military spending is the glue holding the budget deal together…

The House just passed the Ryan-Murray budget deal, signaling an unexpected end to the cycle of budget crises and fiscal hostage-taking. A few weeks ago, such an agreement seemed distant. Sequestration had few friends on the Hill, but the parties could not agree on how to ditch the automatic budget cuts to defense and domestic spending. Republicans had proposed increasing defense spending while taking more money from Obamacare and other social programs, while Democrats said they’d scale back the defense cuts in exchange for additional tax revenue. Those ideas were nonstarters: Following the government shutdown in October, Senate Majority Leader Harry Reid (D-Nevada) called the idea of trading Social Security cuts for bigger defense budgets “stupid.”


Which explains why Rep. Paul Ryan and Sen. Patty Murray’s deal craftily dodged taxes and entitlements while focusing on the one thing most Republicans and Democrats could agree upon: saving the Pentagon budget. Ryan’s budget committee previously declared the sequester “devastating to America’s defense capabilities.” Murray had warned of layoffs for defense workers in her state of Washington as well as cuts to combat training if sequestration stayed in place.

The chart above shows why military spending is the glue holding the budget deal together. It also shows how any remaining opposition to the bill in the Senate may bring together even stranger bedfellows than Ryan and Murray: progressive dove Bernie Sanders (I-Vt.) and sequestration fan Sen. Rand Paul (R-Ky.).


via Zero Hedge http://feedproxy.google.com/~r/zerohedge/feed/~3/ZW1P8e4oTHc/story01.htm Tyler Durden

The US Budget "Deal" Summarized (In One Cartoon)

Context is key…

A greater-than $1 trillion (spending) budget heralded as a triumph on the basis that they raised $20 billion in additional revenue (oh and spent an additional $63 billion in anti-sequester outflows).

h/t Investors via The Burning Platform blog

And how the deal got done… Mother Jones explains… why military spending is the glue holding the budget deal together…

The House just passed the Ryan-Murray budget deal, signaling an unexpected end to the cycle of budget crises and fiscal hostage-taking. A few weeks ago, such an agreement seemed distant. Sequestration had few friends on the Hill, but the parties could not agree on how to ditch the automatic budget cuts to defense and domestic spending. Republicans had proposed increasing defense spending while taking more money from Obamacare and other social programs, while Democrats said they’d scale back the defense cuts in exchange for additional tax revenue. Those ideas were nonstarters: Following the government shutdown in October, Senate Majority Leader Harry Reid (D-Nevada) called the idea of trading Social Security cuts for bigger defense budgets “stupid.”


Which explains why Rep. Paul Ryan and Sen. Patty Murray’s deal craftily dodged taxes and entitlements while focusing on the one thing most Republicans and Democrats could agree upon: saving the Pentagon budget. Ryan’s budget committee previously declared the sequester “devastating to America’s defense capabilities.” Murray had warned of layoffs for defense workers in her state of Washington as well as cuts to combat training if sequestration stayed in place.

The chart above shows why military spending is the glue holding the budget deal together. It also shows how any remaining opposition to the bill in the Senate may bring together even stranger bedfellows than Ryan and Murray: progressive dove Bernie Sanders (I-Vt.) and sequestration fan Sen. Rand Paul (R-Ky.).


via Zero Hedge http://feedproxy.google.com/~r/zerohedge/feed/~3/ZW1P8e4oTHc/story01.htm Tyler Durden

Europe Officially Loses Fight For Ukraine, Russia Wins

Over the past month, an interesting conflict emerged between Putin’s Russia and, well, some unelected person’s Europe. The conflict was over who would be the Ukraine’s big brother, and strategic ally for the future, and whether the Ukraine would snub Europe, i.e. the West, and reorient to its Soviet Union roots, by aligning with Russia. Moments ago, the fight over Ukraine ended. Russia won, and not only pledged $15 billion in future Ukraine investments, but de facto became the lender of last resort for the troubled nation.

  • PUTIN SAYS RUSSIA-UKRAINE TALKS IN MOSCOW WERE CONSTRUCTIVE
  • PUTIN SAYS GAZPROM TO SELL GAS TO UKRAINE AT $268.50
  • PUTIN SAYS UKRAINE BENEFITING FROM DISCOUNT ON RUSSIAN GAS
  • PUTIN: RUSSIA TO USE SOVEREIGN WEALTH FUND TO INVEST IN UKRAINE
  • PUTIN SAYS RUSSIA TO INVEST $15B IN UKRAINIAN SECURITIES
  • PUTIN SAYS UKRAINE’S MEMBERSHIP IN CUSTOMS UNION NOT DISCUSSED
  • SILUANOV SAYS UKRAINE TO SELL $15B BONDS TO RUSSIA IN 2013-14

Europe, like a jilted lover, was sad but understood it had been bested. 

  • GERMANY’S STEINMEIER: EU’S OVERTURE TO UKRAINE FELL SHORT
  • STEINMEIER: EU MAY HAVE UNDERESTIMATED RUSSIA DETERMINATION

Notably, this is the second major geopolitical gambit that Europe has lost this year: first the Syrian escapade, where it tried aggressively to replace Gazprom with Qatar (and failed), and now it has lost Europe’s “bread basket.”

Ukraine bonds welcomed the clarity, and that the nation is now officially once again under Russia’s sphere of influence:

And now, with Ukraine firmly in the pocket of Russia, it remains to be seen how the local opposition and the pro-European protesters will react. They will hardly be enthused.


via Zero Hedge http://feedproxy.google.com/~r/zerohedge/feed/~3/4rlYnZtIhNs/story01.htm Tyler Durden

Homebuilder Confidence Spikes Back To Highest In 8 Years

Despite higher rates, collapsing mortgage applications, lower affordability, and fast money exiting the market, the NAR just won’t back off their exuberant optimism that it will all end well. With the biggest beat of expectations in 7 months, the NAHB sentiment index re-spiked back to 58 – levels not seens since November 2005. Only the NorthEast saw prospective buyer traffic drop notably (we are sto be blamed on the weather) as the survey saw a surge in the single-family-home-sales sub-index.

Yay – 8 year highs in optimism…


Seems a little overdone…


via Zero Hedge http://feedproxy.google.com/~r/zerohedge/feed/~3/L8sBSq6P0pU/story01.htm Tyler Durden

ECB Fails To Sterilize Bond Purchases For Second Time In A Month

Back in November 2011, when the ECB failed to fully sterilize its weekly outstanding amount of bond purchases under its now defunct SMP program (replaced with the even more impotent OMT non-existent “bond buying” program), it caused a plunge in the Euro and sent European stocks reeling over fears what this may mean for European bank liquidity. This happened just as Europe was “turmoiling” and the ECB announced the flooding of the European banking system with hundreds of billions in excess liquidity via the collateral-soaking LTRO 1 and 2. A few hours ago, the very same thing happened after the ECB found only 109 bidders for today’s weekly attempt to sterilize €184 billion in outstanding SMP holdings, and instead got bids for only €152.3 billion of the total leading to a €32 billion shortfall. This happened just a month after another failed ECB sterilization on November 26. The market barely noticed.

Why the completely muted response? Perhaps because it some ways it was expected, since as a result of accelerated LTRO repayments in recent weeks, excess cash in the Eurosystem is now at the lowest level in just about two years, which also means that banks are seen as preferring to hold on to money. In fact, according to IFR, excess liquidity is expected to drop from today’s €171.5 billion to below €150 billion by year end and banks will naturally hold on to dear cash for window dressing purposes and for anything out of the ordinary.

Furthermore, earlier today the Eonia spread (June vs Feb forwards) turned the most negative in months, and certainly since the ECB’s announcement of its refi rate cut in early November.

So if sterilization failures are also added to the New Normal, why should the ECB even pretend to be a prudent sterilizer of monetized bonds? If indeed the European liquidity is so low that finding €184 billion in the system becomes a problem, is this a harbinger that very soon the ECB will proceed with unsterilized monetizations, and is today merely a market test to see how risk responds to the second sterilization failure in a month.

Of course, if indeed that is the case, and Draghi is preparing to launch unsterilized monetizations, then suddenly Asmussen’s recent departure makes far more sense.


via Zero Hedge http://feedproxy.google.com/~r/zerohedge/feed/~3/q2fATrscuy8/story01.htm Tyler Durden

2014 Will Move Us Closer To The End

Originally posted at Monty Pelerin’s World blog,

The fraud that has been the US government and its effects on the Potemkin economy should be obvious by now. Yet our politicians continue to pretend the economy is growing and recovering. It is not. It is in a death spiral that their interventions caused and continue to feed.

The presentation below is another one from Gordon T. Long. This one includes Charles Hugh Smith as his guest. Both are worthwhile listening to, especially in this presentation.


What is discussed is expectations for 2014. The problems that may surface this coming year have their roots decades before. Each problem results from prior government attempts to stop normal economic corrections. Each was designed to stimulate the economy to avoid the necessary adjustments. Their effectiveness short-term was politically acceptable and was achieved by distorting prices, interest rates and lending standards. The intent was to send false signals to economic actors, to encourage them to behave in ways that helped short-term results but were harmful long-term.

For years short-run corrections were avoided or mitigated by this falsifying of economic signals. The cost was to make the economy weaker and less efficient. It also was to burden the economy and its participants with record levels of debt. This economic debauchery produced immediate good feelings in the same manner that excessive drinking does. It makes you feel good during the binge, but the next day is hangover time.

The economy has been wasted. These short-term highs have place it in grave danger. John Maynard Keynes replied to objections to his short-term remedies with the statement that “in the long-run we are all dead.” Keynes is long dead. Perhaps he was thinking only in terms of his lifespan. The rest of us are facing the consequences of such irresponsible policy.

Whether enough of the negatives hit in 2014 to sink the country is doubtful but not impossible. The saddest part about what is happening is that there is no political will to even recognize the path that we are on. From a political standpoint, no one wants to admit we are in trouble. As a result, there are no attempts to remedy our economic and social spiral to ruin, (and probably no way) to reverse the march to collapse.


via Zero Hedge http://feedproxy.google.com/~r/zerohedge/feed/~3/cAUlvNlIZLA/story01.htm Tyler Durden

Gold To Rally Year End As Traders Close Some Of Record Short Positions

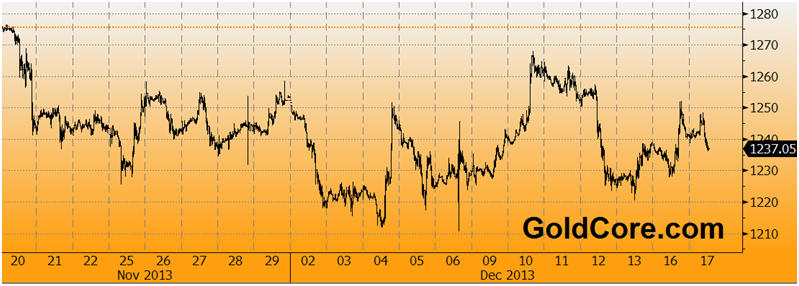
Today’s AM fix was USD 1,237.25, EUR 898.71 and GBP 759.42 per ounce.
Yesterday’s AM fix was USD 1,229.50, EUR 892.62 and GBP 754.57 per ounce.

Gold rose $3.10 or 0.25% yesterday, closing at $1,240.70/oz. Silver climbed $0.26 or 1.32% closing at $19.96/oz. Platinum fell $3.24, or 0.2%, to $1,358.25/oz and palladium rose $0.25 or 0%, to $715.90/oz.


Gold in U.S. Dollars, 30 Days – (Bloomberg)

Gold is marginally lower today after two days of gains as the Fed’s two day policy meeting begins. More positive than expected U.S. data and continuing SPDR outflows may have led to weakness.

Gold’s gains in recent days are likely partly due to a short covering rally. Nervous traders may be closing some of their record short positions ahead of a Federal Reserve policy decision on whether to begin tapering its equity and bond friendly debt monetisation measures.

Most economists believe the Fed will not begin tapering till March of next year, which could be prompt traders to further cover their short positions.

Short positions are at multi year highs and if the Fed does not taper tomorrow we will likely see a large short covering rally going into the New Year as shorts close out positions and balance books at year end.

Bearish bets by hedge funds and money managers in U.S. gold futures and options are close to a 7-1/2 year high, according to data from the Commodity Futures Trading Commission (CFTC).
   
SPDR Gold Trust, the world’s largest gold ETF, said its holdings fell 8.70 tonnes to 818.90 tonnes on Monday – its biggest outflow since Oct 21.
 
Holdings are at their lowest since January 2009 after more than 450 tonnes of outflows this year caused by traders and more speculative investors channelling money towards riskier assets such as equities and bonds which are at record highs in many countries.

Importantly, and little reported on is the fact that the ETF flows have been matched and greatly surpassed by physical gold in China and imports from Hong Kong into China alone.   

Gold has lost 25% of its value this year after 12 years of gains. There are credible allegations that the market was subject to price manipulation with banks manipulating prices lower through massive concentrated selling at times of low liquidity. Allegations that Chinese entities may be manipulating paper gold prices lower in order to buy physical gold on the cheap are gaining credence.

Whatever, the reasons for gold’s price fall it is a healthy development as it has led to the speculative hot money and weak hands being washed out of the market. Gold is on a much more sustainable footing now and is very much in strong hands now, which bodes well for gold in 2014 and 2015.

Download Protecting your Savings In The Coming Bail-In Era (11 pages)

Download From Bail-Outs to Bail-Ins: Risks and Ramifications –  Includes 60 Safest Banks In World  (51 pages)


via Zero Hedge http://feedproxy.google.com/~r/zerohedge/feed/~3/H9DxYutXl4k/story01.htm GoldCore

Jim Grant Slams Steve Liesman "The Fed Can Change How Things Look, But Not What They Are"

"I got up this early to talk, not to listen," Jim Grant berates Fed-apologist Steve Liesman as the two go head-to-head over the fallacy that QE has been a success. "The Fed can change how things look, it cannot change what things are," is the single-sentence summation of the mirage that the Fed's "dangerous monetary manipulation" has created.

Arguing that Grant is wrong because, as we saw this morning with CPI, there is no inflation, Grant blasts back pointing to the massive inflation in asset prices, art, farmland, ferraris as indicative of who the Fed's policies have helped. Grant adds to the list of obvious bubbles and even Joe Kiernan jumps in on his side against Liesman's insistence that the Fed is omnipotent (because the currency hasn't crashed… yet).

150 seconds of perfect disequilibrium at the pretense of central planning…
 

And, as we noted previously, here's why"The Rich Hold Assets, The Poor Have Debt"

This chart from Citi's Matt King pretty much sums it up (and contrary to what Magic Money Tree growers will tell you, debt is not wealth).

Why is it important? Simple – contrary to the Fed's flawed DSGE models, it is the poor who are more likely to consume. And logically with their purchasing power being funneled to the rich with every $85 billion in monthly debt monetization, they purchase less and less. As the slow but steady contraction in the economy over the past five years has proven beyond a reasonable doubt.

But hey: at least Hamptons' houses have never been more expensive and the Russell2000 keeps on hitting daily all time highs. Thank you "wealth effect."


via Zero Hedge http://feedproxy.google.com/~r/zerohedge/feed/~3/Y8u5DZGHlmU/story01.htm Tyler Durden

Jim Grant Slams Steve Liesman “The Fed Can Change How Things Look, But Not What They Are”

"I got up this early to talk, not to listen," Jim Grant berates Fed-apologist Steve Liesman as the two go head-to-head over the fallacy that QE has been a success. "The Fed can change how things look, it cannot change what things are," is the single-sentence summation of the mirage that the Fed's "dangerous monetary manipulation" has created.

Arguing that Grant is wrong because, as we saw this morning with CPI, there is no inflation, Grant blasts back pointing to the massive inflation in asset prices, art, farmland, ferraris as indicative of who the Fed's policies have helped. Grant adds to the list of obvious bubbles and even Joe Kiernan jumps in on his side against Liesman's insistence that the Fed is omnipotent (because the currency hasn't crashed… yet).

150 seconds of perfect disequilibrium at the pretense of central planning…
 

And, as we noted previously, here's why"The Rich Hold Assets, The Poor Have Debt"

This chart from Citi's Matt King pretty much sums it up (and contrary to what Magic Money Tree growers will tell you, debt is not wealth).

Why is it important? Simple – contrary to the Fed's flawed DSGE models, it is the poor who are more likely to consume. And logically with their purchasing power being funneled to the rich with every $85 billion in monthly debt monetization, they purchase less and less. As the slow but steady contraction in the economy over the past five years has proven beyond a reasonable doubt.

But hey: at least Hamptons' houses have never been more expensive and the Russell2000 keeps on hitting daily all time highs. Thank you "wealth effect."


via Zero Hedge http://feedproxy.google.com/~r/zerohedge/feed/~3/Y8u5DZGHlmU/story01.htm Tyler Durden

Headline November Inflation Unchanged, Below Consensus; Core Inflation Higher Than Expected

As we noted earlier today, if there was one piece of news that could tip the scales away from a December taper announcement, it was a November inflation number that came in below expectations. Which it did: the headline November inflation print came in unchanged, on expectations of a 0.1% increase for the month, and up 1.2% for the year, below the 1.3% expected. However, before you BTFATH, note that core inflation – the Fed’s preferred metric – actually was higher than expected, with prices ex food and gas, rising 0.2% in November on expectations of a 0.1% increase. Indeed, looking at the components, the headline inflation number was dragged down by gasoline prices which dipped 1.6% in November and overall Energy costs which fell 1.0%. Also notable: apparel inflation was -0.4% in November – the third consecutive month of declines. However, back to the core number, annual inflation was up 1.7% Y/Y just shy of the Fed’s target, while core service inflation is up 2.4%.


Breakdown by component:

The breakdown of the key components from the report:

Food


The food index rose 0.1 percent in November, the same increase as in October. The index for food at home was unchanged, with major grocery store food groups mixed. The index for fruits and vegetables declined in November, falling 0.7 percent after rising in October. The indexes for meats, poultry, fish, and eggs and for nonalcoholic beverages also declined in November, each falling 0.2 percent. The index for cereals and bakery products, which declined in October, was unchanged in November. The index for other food at home rose in November, increasing 0.5 percent, and the index for dairy and related products rose 0.4 percent in November after falling in October. The food at home index has risen 0.6 percent over the last 12 months, the smallest 12-month increase since June 2010. The index for meats, poultry, fish, and eggs has posted the largest increase of the six major grocery store food groups over the last year, rising 2.8 percent. The index for nonalcoholic beverages has declined the most, falling 1.8 percent. The index for food away from home rose 0.3 percent in November, its largest increase since
April, and has risen 2.1 percent over the last year. 


Energy


The energy index declined 1.0 percent in November after falling 1.7 percent in October. The gasoline index, which fell 2.9 percent in October, declined 1.6 percent in November. (Before seasonal adjustment, gasoline prices fell 3.3 percent in November.) The index for natural gas also declined, falling 1.8 percent in November; this was its fifth decline in the last 6 months. Other energy indexes increased, however. The electricity index rose 0.3 percent in November, its third consecutive  increase. The index for fuel oil rose 0.4 percent in November after declining in October. The energy index has declined 2.4 percent over the last year, with the gasoline index down 5.8 percent and the index for fuel oil decreasing 4.1 percent. The electricity index has risen 2.9 percent over the last year, and the index for natural gas has increased 1.0 percent.


All items less food and energy


The index for all items less food and energy rose 0.2 percent in November after rising 0.1 percent in each of the 3 previous months. The shelter index rose 0.3 percent in November after a 0.1 percent increase in October. The rent index increased 0.2 percent, while the index for owners’ equivalent rent increased 0.3 percent. The index for lodging away from home rose 2.9 percent in November after declining 3.1 percent in October. The index for airline fares continued to rise, advancing 2.6 percent in November after a 3.6 percent increase in October. The recreation index rose 0.2 percent, and the index for used cars and trucks advanced 0.1 percent. The index for medical care was unchanged in November, with both the medical care commodities and medical care services components unchanged. The apparel index continued to decrease, falling 0.4 percent, its third consecutive decline. The index for household furnishings and operations fell 0.2 percent in November, as did the tobacco index. The index for new vehicles declined 0.1 percent for the second consecutive month.


The index for all items less food and energy increased 1.7 percent for the 12 months ending November. Indexes that have increased at a faster rate include airline fares (4.2 percent), shelter (2.4 percent), and medical care (2.2 percent). Indexes that increased more slowly or declined include household furnishings and operations (-1.4 percent), apparel (-0.1 percent), and new vehicles (0.6 percent).

So to summarize: if one looks at the headline CPI number, which the Fed has repeatedly said it does not, Taper may be delayed. If one looks at the Fed’s preferred core number, however, the Taper may still be very much on for December.


< a href="http://da.feedsportal.com/r/184841691153/u/49/f/645423/c/34894/s/34eb1775/sc/22/kg/369/rc/1/rc.htm">

via Zero Hedge http://feedproxy.google.com/~r/zerohedge/feed/~3/d4FxlnFFhXc/story01.htm Tyler Durden