Shiller Worried About "Boom In US Stocks… Bubbles Look Like This"

On the heels of his recent appearance pouring cold water on Jim Cramer's housing recovery exuberance, recent Nobel Prize winner Bob Shiller unloads another round of uncomfortable truthiness (presumably on the basis of his future-proofing tenure guaranteed by the Nobel). "Bubbles look like this," Shiller tells Der Spiegel, adding that he is, "most worried about the boom in US stock prices." As Reuters reports, Shiller is concerned since "the world is still very vulnerable to a bubble," and with stock exchanges around the world at record highs despite an economy that is "still weak," the Nobel winner proclaimed, "this could end badly."


Via Reuters,

[Bob Shiller] believes sharp rises in equity and property prices could lead to a dangerous financial bubble and may end badly, he told a German magazine.


"I am not yet sounding the alarm. But in many countries stock exchanges are at a high level and prices have risen sharply in some property markets," Shiller told Sunday's Der Spiegel magazine. "That could end badly," he said.


"I am most worried about the boom in the U.S. stock market. Also because our economy is still weak and vulnerable," he said, describing the financial and technology sectors as overvalued.


"Bubbles look like this. And the world is still very vulnerable to a bubble," he said.


Bubbles are created when investors do not recognize when rising asset prices get detached from underlying fundamentals.

We tend to agree – bubbles do look like this…

…we observe a variety of other features typically associated with dangerous extremes:

  • unusually rich valuations on a wide variety of metrics that actually have a reliable correlation with subsequent market returns; margin debt at the highest level in history and representing 2.2% of GDP (eclipsed only briefly at the 2000 and 2007 market extremes);
  • a blistering pace of initial public offerings – back to volumes last seen at the 2000 peak – featuring “shooters” that double on the first day of issue;
  • confidence in the narrative that “this time is different” (in this case, the presumption of a fail-safe speculative backstop or “put option” from the Federal Reserve); lopsided bullish sentiment as the number of bearish advisors has plunged to just 15% and bulls rush to one side of the boat;
  • record issuance of covenant-lite debt in the leveraged loan market (which is now spreading to Europe);
  • and a well-defined syndrome of “overvalued, overbought, overbullish, rising-yield” conditions that has appeared exclusively at speculative market peaks – including (exhaustively) 1929, 1972, 1987, 2000, 2007, 2011 (before a market loss of nearly 20% that was truncated by investor faith in a new round of monetary easing), and at three points in 2013: February, May, and today (see A Textbook Pre-Crash Bubble).

Many of us in the financial world know these to be classic features of speculative peaks, but there is career risk in responding to them, so even those who view the situation with revulsion can't seem to tear themselves away.
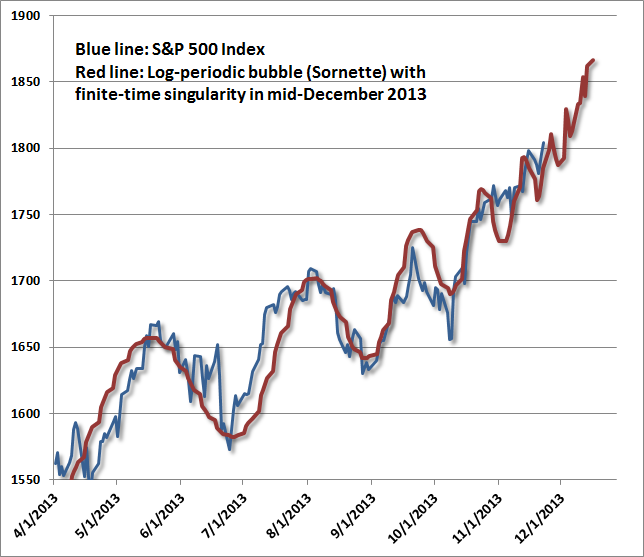


While I have no belief that markets follow any mathematical trajectory, the log-periodic pattern is interesting because it coincides with a kind of “signature” of increasing speculative urgency, seen in other market bubbles across history. The chart above spans the period from 2010 to the present. What’s equally unsettling is that this speculative behavior is beginning to appear “fractal” – that is, self-similar at diminishing time-scales. The chart below spans from April 2013 to the present. On this shorter time-scale, Sornette’s “finite time singularity” pulls a bit closer – to December 2013 rather than January 2014, but the fidelity to this pattern is almost creepy. The point of this exercise is emphatically not to lay out an explicit time path for prices, but rather to demonstrate the pattern of increasingly urgent speculation – the willingness to aggressively buy every dip in prices – that the Federal Reserve has provoked.


via Zero Hedge http://feedproxy.google.com/~r/zerohedge/feed/~3/_DAzCwweo2I/story01.htm Tyler Durden

Shiller Worried About “Boom In US Stocks… Bubbles Look Like This”

On the heels of his recent appearance pouring cold water on Jim Cramer's housing recovery exuberance, recent Nobel Prize winner Bob Shiller unloads another round of uncomfortable truthiness (presumably on the basis of his future-proofing tenure guaranteed by the Nobel). "Bubbles look like this," Shiller tells Der Spiegel, adding that he is, "most worried about the boom in US stock prices." As Reuters reports, Shiller is concerned since "the world is still very vulnerable to a bubble," and with stock exchanges around the world at record highs despite an economy that is "still weak," the Nobel winner proclaimed, "this could end badly."


Via Reuters,

[Bob Shiller] believes sharp rises in equity and property prices could lead to a dangerous financial bubble and may end badly, he told a German magazine.


"I am not yet sounding the alarm. But in many countries stock exchanges are at a high level and prices have risen sharply in some property markets," Shiller told Sunday's Der Spiegel magazine. "That could end badly," he said.


"I am most worried about the boom in the U.S. stock market. Also because our economy is still weak and vulnerable," he said, describing the financial and technology sectors as overvalued.


"Bubbles look like this. And the world is still very vulnerable to a bubble," he said.


Bubbles are created when investors do not recognize when rising asset prices get detached from underlying fundamentals.

We tend to agree – bubbles do look like this…

…we observe a variety of other features typically associated with dangerous extremes:

  • unusually rich valuations on a wide variety of metrics that actually have a reliable correlation with subsequent market returns; margin debt at the highest level in history and representing 2.2% of GDP (eclipsed only briefly at the 2000 and 2007 market extremes);
  • a blistering pace of initial public offerings – back to volumes last seen at the 2000 peak – featuring “shooters” that double on the first day of issue;
  • confidence in the narrative that “this time is different” (in this case, the presumption of a fail-safe speculative backstop or “put option” from the Federal Reserve); lopsided bullish sentiment as the number of bearish advisors has plunged to just 15% and bulls rush to one side of the boat;
  • record issuance of covenant-lite debt in the leveraged loan market (which is now spreading to Europe);
  • and a well-defined syndrome of “overvalued, overbought, overbullish, rising-yield” conditions that has appeared exclusively at speculative market peaks – including (exhaustively) 1929, 1972, 1987, 2000, 2007, 2011 (before a market loss of nearly 20% that was truncated by investor faith in a new round of monetary easing), and at three points in 2013: February, May, and today (see A Textbook Pre-Crash Bubble).

Many of us in the financial world know these to be classic features of speculative peaks, but there is career risk in responding to them, so even those who view the situation with revulsion can't seem to tear themselves away.


While I have no belief that markets follow any mathematical trajectory, the log-periodic pattern is interesting because it coincides with a kind of “signature” of increasing speculative urgency, seen in other market bubbles across history. The chart above spans the period from 2010 to the present. What’s equally unsettling is that this speculative behavior is beginning to appear “fractal” – that is, self-similar at diminishing time-scales. The chart below spans from April 2013 to the present. On this shorter time-scale, Sornette’s “finite time singularity” pulls a bit closer – to December 2013 rather than January 2014, but the fidelity to this pattern is almost creepy. The point of this exercise is emphatically not to lay out an explicit time path for prices, but rather to demonstrate the pattern of increasingly urgent speculation – the willingness to aggressively buy every dip in prices – that the Federal Reserve has provoked.


via Zero Hedge http://feedproxy.google.com/~r/zerohedge/feed/~3/_DAzCwweo2I/story01.htm Tyler Durden

Obama Administration Admits "There Is More Work To Be Done" As Healthcare.gov Relaunches

While even the most naive private sector cyber-experts knew well in advance that an effective rewrite of Obamacare’s 500 million lines of code would take a “little longer” than the month promised by the government in advance of the November 30 fix deadline, the Obama administration went ahead with its much touted healthcare.gov relaunch anyway. The results have been mixed.

The WSJ quotes Obama administration officials who said Sunday there has been “dramatic progress” in fixing HealthCare.gov but acknowledged “there is more work to be done” in improving the site and its underlying technology and that technicians for the site said they will not be able to fix all the glitches by the deadline.

Centers for Medicare and Medicaid Services officials released an eight-page report Sunday morning offering a few details of progress in fixing the site, which crashed shortly after its launch Oct. 1.

The site now allows 50,000 people to use it at the same time, according to the report, and wait times for Internet pages to load have dropped from 8 seconds to less than a second. More than 400 fixes have been made to the site.


“The bottom line, HealthCare.gov on Dec. 1 is night and day from where it was on Oct. 1,” said Jeffrey Zients, the Obama aide tasked with fixing the technical mess, in a call with reporters.

Ironically, if Obamacare ends up being the success Obama has portrayed it as since day one, and traffic to the website surges (as is needed for Obamacare to become financially viable as opposed to just stop showing 404 screens), it is likely that it will crash once again. CMS representative Julie Bataille cautioned, “If there are extraordinary high spikes in traffic, which exceed the site’s capacity, consumers will be put in a new advance queuing system that will give them an expected wait time, or allow them to be notified via email when they can return to the site.” Aka: F5.

That said, assuming the website is indeed finally fixed, it is clear who should be thanked: Google and Oracle. “Contractors and outside engineers from Google Inc. and Oracle Corp. brought in by Obama administration officials have been working overtime over the past five weeks to try to fix the site and its underlying technology, including systems that send information and payments to insurers. Administration officials say they installed fixes this weekend to address erroneous customer data that have been sent to insurers. They won’t know if that issue has been fixed until more consumers get through the enrollment process and more customer data is sent to insurers, said Julie Bataille, a CMS spokeswoman.”

In other words, you have to sign up for Obamacare, to find out not only what’s in it and what your premiums will be, but if it has even been fixed.

Finally, those still confused about the enrollment process, will get some much needed clarity from the flowchart below.


via Zero Hedge http://feedproxy.google.com/~r/zerohedge/feed/~3/FvB3dFzSaUk/story01.htm Tyler Durden

Obama Administration Admits “There Is More Work To Be Done” As Healthcare.gov Relaunches

While even the most naive private sector cyber-experts knew well in advance that an effective rewrite of Obamacare’s 500 million lines of code would take a “little longer” than the month promised by the government in advance of the November 30 fix deadline, the Obama administration went ahead with its much touted healthcare.gov relaunch anyway. The results have been mixed.

The WSJ quotes Obama administration officials who said Sunday there has been “dramatic progress” in fixing HealthCare.gov but acknowledged “there is more work to be done” in improving the site and its underlying technology and that technicians for the site said they will not be able to fix all the glitches by the deadline.

Centers for Medicare and Medicaid Services officials released an eight-page report Sunday morning offering a few details of progress in fixing the site, which crashed shortly after its launch Oct. 1.

The site now allows 50,000 people to use it at the same time, according to the report, and wait times for Internet pages to load have dropped from 8 seconds to less than a second. More than 400 fixes have been made to the site.


“The bottom line, HealthCare.gov on Dec. 1 is night and day from where it was on Oct. 1,” said Jeffrey Zients, the Obama aide tasked with fixing the technical mess, in a call with reporters.

Ironically, if Obamacare ends up being the success Obama has portrayed it as since day one, and traffic to the website surges (as is needed for Obamacare to become financially viable as opposed to just stop showing 404 screens), it is likely that it will crash once again. CMS representative Julie Bataille cautioned, “If there are extraordinary high spikes in traffic, which exceed the site’s capacity, consumers will be put in a new advance queuing system that will give them an expected wait time, or allow them to be notified via email when they can return to the site.” Aka: F5.

That said, assuming the website is indeed finally fixed, it is clear who should be thanked: Google and Oracle. “Contractors and outside engineers from Google Inc. and Oracle Corp. brought in by Obama administration officials have been working overtime over the past five weeks to try to fix the site and its underlying technology, including systems that send information and payments to insurers. Administration officials say they installed fixes this weekend to address erroneous customer data that have been sent to insurers. They won’t know if that issue has been fixed until more consumers get through the enrollment process and more customer data is sent to insurers, said Julie Bataille, a CMS spokeswoman.”

In other words, you have to sign up for Obamacare, to find out not only what’s in it and what your premiums will be, but if it has even been fixed.

Finally, those still confused about the enrollment process, will get some much needed clarity from the flowchart below.


via Zero Hedge http://feedproxy.google.com/~r/zerohedge/feed/~3/FvB3dFzSaUk/story01.htm Tyler Durden

The Markets Have Entered a Blow Off Top


The markets are entering a blow off top.


For five years, by keeping interest rates near zero, the Fed has been hoping to push investors into the stock market. The hope here was that as stock prices rose, investors would feel wealthier (the “wealth effect”) and would be more inclined to start spending more, thereby jump-starting the economy.


This has not been the case.


From 2007-early 2013, individual investors fled stocks for the perceived safety (and more consistent returns) of bonds. During that time, investors have pulled over $405 billion out of stock based mutual funds.


The pace did not slow throughout this period either with investors pulling $90 billion out of stock based mutual funds in 2012: the largest withdrawal since 2008.


In contrast, over the same time period, investors put over $1.14 trillion into bond funds. They brought in $317 billion in 2012, the most since 20008.


Throughout this period, the market rose, largely due to institutional buying. Every time the market started to collapse, “someone” stepped in and propped it up. Consequently, institutional traders were not committed to a collapse, and gradually the market moved higher.


At this point the “mom and pop” crowd was, for the most part, not participating in the rally.


That all changed in early 2013. Suddenly the “crowd” began to get religion about the Fed’s monetary madness and piled into stocks. We’ve now reached truly manic proportions: thus far in 2013, investors have put $277 billion into stock mutual funds.


This is the single largest allocation of investor capital to stock based mutual funds since 2000: at the height of the Tech bubble. That year, investors put $324 billion into stocks. We might actually match that inflow this year as we still have two months left in 2013.

Indeed, investors are reaching a type of mania for stocks. They put $45.5 billion into stock based mutual funds in the first five weeks of October. If they maintain even half of that pace ($22.75 billion) for the remainder of the year, we’ll virtually tie the all-time record for stock fund inflows in a single year.

As a result of this, the market has entered a blow off top from a rising wedge pattern.  You can clearly see the mania beginning to hit in the middle of 2013.


So, we have investor sentiment showing record bullishness, investors are piling into stocks at a pace not seen since 1999-2000: at the height of the Tech Bubble, earnings are generally falling, the global economy is contracting, and the Fed is already buying $85 billion worth of assets per month.


We all know how this bubble will burst: badly. It’s just a question of when. The smart money is either selling into this rally (Fortress and Apollo Group) or sitting on cash (Buffett). They know what’s coming and are waiting.


For a FREE Special Report outlining how to protect your portfolio from a market collapse, swing by: http://phoenixcapitalmarketing.com/special-reports.html


Best Regards

Phoenix Capital Research 


via Zero Hedge http://feedproxy.google.com/~r/zerohedge/feed/~3/CckIcPZUCl4/story01.htm Phoenix Capital Research

Live Stream From Escalating Ukraine Protests As Hundreds Of Thousands Take To The Streets

As reported yesterday, in the aftermath of the violent crackdown on a pro-Europe rally, and the resulting call by the opposition for president Yanukovich’s resignation through nationwide strikes, the situation in the Ukraine is increasingly more unstable. Moments ago Reuters reported that Ukrainian nationalist protesters broke into Kiev’s city hall and were occupying at least part of the building during mass protests that drew several hundred thousands out on the streets to protest the government’s decision to forego an EU deal. Nationalist leader Oleh Tyahniboh told Interfax that representatives of his party had taken over the building. “Today literally 40 minutes ago, our boys took the Kiev Council,” he told crowds on Kiev’s Independence Square.

Some more detail on the rally itself via Reuters:

Hundreds of thousands of Ukrainians shouting “Down with the Gang!” rallied on Sunday against President Viktor Yanukovich’s U-turn on Europe and some used a building excavator to try to break through police lines at his headquarters.


The rally, by far the biggest seen in the Ukrainian capital since the Orange Revolution nine years ago, came a day after a police crackdown on protesters that inflamed demonstrators further after Yanukovich’s policy switch.


Last month Yanukovich – after months of pressure from former Soviet master Russia – backpedalled from signing a landmark deal on closer relations with the European Union in favour of closer ties with Moscow.


To try to defuse tensions before Sunday’s rally, Yanukovich issued a statement saying he would do everything in his power to speed up Ukrainian moves toward the EU.


In a sea of blue and gold, the colours of both the EU and Ukrainian flags, protesters swept into Kiev’s Independence Square to hear heavyweight boxer-turned-opposition politician Vitaly Klitschko call for Yanukovich to resign.


“They stole the dream. If this government does not want to fulfil the will of the people, then there will be no such government, there will be no such president. There will be a new government and a new president,” he said to cheers.


Far-right nationalist Oleh Tyahniboh, another opposition leader, called for a national strike. “From this day, we are starting a strike,” he declared.


“I want my children to live in a country where they don’t beat young people,” said protester Andrey, 33, the manager of a large company, who declined to give his surname for fear of reprisals against him.

At what point will Russia have to step in, either directly or indirectly, to preserve the new post-USSR world order it has so carefully and meticulously achieved so far?

Live webcast from the Ukraine below:

Live streaming video by Ustream


via Zero Hedge http://feedproxy.google.com/~r/zerohedge/feed/~3/SAuLwT5h2A0/story01.htm Tyler Durden

Four Dead, 48 Injured As Train Derails In The Bronx

Shortly after 7 am Eastern time on Sunday, Metropolitan Transportation Authority police confirmed that a Metro-North train derailed near the Hudson river in the Bronx. The accident occurred near Palisade Avenue near the Spuyten Duyvil railroad station. Photos taken of the accident scene show eight cars derailed.  Edwin Valero was in an apartment building above the accident scene when the train derailed, the WSJ reports. He says none of the cars went into a nearby body of water, but at least one ended up a few feet from the edge. Rebecca Schwartz was at a nearby park when the accident occurred. She says she didn’t see or hear the derailment but looked across the water when she heard emergency vehicle sirens. She says numerous emergency vehicles have responded to the scene.

The most recent injury report from NBC has 4 dead and 48 injured in the derailment.

Photos of the accident via Breakingnews:


via Zero Hedge http://feedproxy.google.com/~r/zerohedge/feed/~3/MBnN4PawyLE/story01.htm Tyler Durden

Beware of the Monetary Mobsters!

Last month the IMF came up with a ‘brilliant plan’ to solve the crisis in Europe. As the old continent suffers from record unemployment and a debt pile that has gotten out of control in several (mostly) Southern European countries, the idea is to target savings with a wealth tax.

The IMF came up with the idea, or ‘theoretical exersize’ as the officials like to call it, to introduce a one time off tax levy, or wealth tax, on all savings accounts. Calculations by the IMF had shown that a modest 10% would get European governments out of the woods.

Now of course this ‘theoretical exersize’ got people in Europe furious. And with good reason. At least, so it appears to be. After all: life savings is money that has been taxed,pretty severily already in most parts of Europe. Savings are no more or less the Holy Grail to most and suggesting these life savings aren’t save is like swearing in the church.

The ‘theoretical exersize’ is by no means just what governments and the IMF like us to believe.The plans are out there, leaking this through to the media is no more than a matter of testing the water tempeture.

Let’s not forget: this legal robbery by a government has already been taking place in Cyprus. Consumers on this tiny island were confronted, on a friday night of course, by bank accounts being unaccessable, ATM’s without euro’s, restrictions on making payments abroad and a one off tax levy on all bank accounts.

And although people got angry, and scared, no big riots broke out!

Cyprus was the first test, a blue print or template for what’s coming for the rest of the Eurozone. Not today or tomorrow, consumers are on the edge for now as the IMF report was publiced fairly recently, but at one point in the near future savings will be the target for a wealth tax. That’s only a matter of time.

Now one could argue about the fairness of this wealth tax. After all, people that were smart enough to put some money aside get punished for doing so. People that spent all their money would dodge the bullet.

This is of course a complet dossier.Governments in Europe strongly prefer Europeans to put their savings to work. Either by investing their money, or by spending it to give the economy a boost. At this point in time, people who are saving money, are part of the problem. It maybe a shocker, but for the first time we would like to say: listen to your government, invest your worthless cash in real assets… before they come and collect.

Europe is in some ways different from the USA. Perhaps one of the most important differences is the Fed. Europe has of course it’s own central bank: the ECB. But contrairy to the way the Fed acts with printing dollars like at high speed and ballooning it’s balance sheet, the ECB has a very different appraoch. The balance sheet has been shrinking for quite some time and the desire to print euro’s to fix the fragile economy just isn’t there. Germany, effectively the Eurozone’s ‘paymaster’, will never agree on quantitative easing, Fed-style.

This all leaves Europe with very few options. The debt level within the Eurozone has risen to a level which is unsustainable. Debt rises with €100 million… per hour. The debt-to-GDP ratio has already surpassed the 90% level and will inevitibly reach the 100% plus in a few years.

debt to gpd US versus Europe

Now debt by government is of course not just the government’s problem, but a problem for all consumers living within the Eurozone. As the most health way to get out of the woods, a strong economic recovery, is far out of site, something else and drastic has to happen to get out of the woods.

One of the few ways out of this economic mess, will be a wealth tax. Will this be a one time thing? We highly doubt it, as it won’t stop European governments from over spending. Lessons learned? Again, highly unlikely. The people responsible for (over)spending in the last couple of decades will still be in charge, after all Europeans take a hit on their savings.

Will the wealth tax do the trick? That is also higly unlikely. It will help bring the debt levels back to a more sustainable level, creating some room for the battered European economies to grow, but it won’t be enough. So this means after taking a chunk out of people’s savings, the next step for European governments will be confiscate a big part, or even all?! At this point, Europe looks like a dying continent and a sitting duck for the monetary mobsters…  

Prepare yourself for the next phase of the Global Debt Crisis!

Want to know more? Download Sprout Money’s Free Guide to Gold


Sprout Money offers a fresh look at investing. We analyze long lasting cycles, coupled with a collection of strategic investments and concrete tips for different types of assets. The methods and strategies from Sprout Money are transformed into the Gold & Silver Report and the Technology Report.


via Zero Hedge http://feedproxy.google.com/~r/zerohedge/feed/~3/p5bN_dpQuFM/story01.htm Sprout Money

The "Anti-Widowmaker" Trade: Get Paid To Wait For The Japanese House Of Card To Collapse

So many traders think the key to investment riches lies in buying at the bottom or selling at the top: Such a fine but misguided notion. The cold reality is that unless one has (illegal) inside information, you will only transact at these locations by pure happenstance. The best managers can enter a position in a zip code near the bottom or top, but not precisely. This is why the most successful investors recognize that sizing is the critical concept. A position that is too small will not justify the effort involved in discovering a valuable idea. Even worse, a position that is too large may force a “stop out” before a brilliant theme reaches its denouement. This Commentary reveals a way to gain exposure to a popular idea, but in a manner that will allow one to hang on for the long ride it may take for full realization.

The lesson here is that being “right” is just not good enough to claim investment victory, one must find a way maintain exposure to the investment premise long enough to earn a profit. So let’s turn our focus to what may surely be the next “big investment theme” that has so far only succeeded in gaining the moniker of “The Widow-Maker”. If you guessed wagering upon when the Helicopter Economy of Japan will finally lose altitude, you would be correct.


In a tree saving effort, let me boil my argument down to this: “It is never different this time.”

Harley Bassman, Credit Suisse      

That Japan’s economy is doomed (as best seen in this chart), as are its government bonds, is unquestionable. There is simply no way the country, faced with an inescapable demographic collapse… 

…can crawl its back to viability without imploding in an eventual deflationary singularity, from which, however, courtesy of the BOJ’s epic printathon, it may eventually inflate away its debt, but not before crucifying its currency, and the living standards of its population. In other words, there is no realistic escape.

This is not news. The problem is that for many – especially the Japanese experts – this has not been news for years and years, yet anyone and everyone who has so far bet on the collapse of the Japanese house of cards, has lost money if not gone bankrupt due to the negative carry or the time decay of any short options. Hence the name: the “widow-maker” trade.

There may, however, be a loophole for all those who, correctly, know that the end of the line for Japan is just a matter of time. The trade in question is described by the “convexity maven” – Credit Suisse’s Harley Bassman:

The Trade

Taking a “short position” in either Japanese interest rates or their currency is a fundamentally sound idea; however it may take three to seven years for the “Macro-profits” to be fully realized. Over that time, a short position will demand a cost, either in the terms of the negative carry of a spot position or the time decay of a short-dated option. Additionally, since it is unlikely you will enter the trade at the extreme, there could be some mark-to-market vibrations that may breach your risk limits.

To the rescue is the strange circumstance of a widening USD vs. JPY Rate differential in conjunction with a flattening Volatility Term Surface. Below is a table of mid-market values for Par Strike USD call // JPY put options with expiries from one-year to ten-years. The critical observation is that a five-year option costs more than a ten-year option; thus the weird dynamic of owning an option with (effectively) positive “theta”: You are paid to own an option !

This is neither financial “magic” nor an “option special”; these are all plain vanilla options than can be priced using Bloomberg’s OVDV screen. Rather, it is merely the interesting mathematical paradox between the Rate process which is Linear and the Time process which is Logarithmic.

In a nutshell, net interest income is linear to time so two years of coupon payments are twice the size as a single year’s value. In contrast, an option’s price increases with the square root of time, so a two-year option is only 1.4 times greater in price than a one-year option.

The easy execution of this idea is just to buy a ten-year call option and put it away for five years:

Strike = 100; Price ~~ Customer pays 7.375%
Strike = 110; Price ~~ Customer pays 5.375%
Strike = 120; Price ~~ Customer pays 4.125%

The more interesting trade might be to execute a five-year vs. ten-year calendar:

Sell five-year vs. Buy ten-year, Strikes = 100; Client receives 0.50%
Sell five-year vs. Buy ten-year, Strikes = 110; Client pays 0.750%
Sell five-year vs. Buy ten-year, Strikes = 120; Client pays 1.375%

Summary

1) The maximum loss for an out-right purchase is limited to the fee paid;
2) The “net” option decay is positive for longer-dated options;
3) Provides the time required to capture the “event risk” of the premise;
4) JPY rates should likely increase at a faster pace than USD rates when Japan finally needs to externally fund itself. Thus one owns a “rates kicker” since the steep negative slope of the forward currency spread will collapse (and may ultimately invert). This would greatly benefit the calendar spread execution.

The lesson from so many of the great Macro Investments Themes is that it sometimes takes the “fullness of time” to realize the largest profits. Unfortunately, the current environment has less patience to tolerate investment costs, as such a “Positive Carry” long option position should be quite interesting.

The Japanese financial situation will normalize at some point; being “paid to wait” for the first five years solves the thorny problem of trying to time that date.


via Zero Hedge http://feedproxy.google.com/~r/zerohedge/feed/~3/aRQK2WumREA/story01.htm Tyler Durden

The “Anti-Widowmaker” Trade: Get Paid To Wait For The Japanese House Of Card To Collapse

So many traders think the key to investment riches lies in buying at the bottom or selling at the top: Such a fine but misguided notion. The cold reality is that unless one has (illegal) inside information, you will only transact at these locations by pure happenstance. The best managers can enter a position in a zip code near the bottom or top, but not precisely. This is why the most successful investors recognize that sizing is the critical concept. A position that is too small will not justify the effort involved in discovering a valuable idea. Even worse, a position that is too large may force a “stop out” before a brilliant theme reaches its denouement. This Commentary reveals a way to gain exposure to a popular idea, but in a manner that will allow one to hang on for the long ride it may take for full realization.

The lesson here is that being “right” is just not good enough to claim investment victory, one must find a way maintain exposure to the investment premise long enough to earn a profit. So let’s turn our focus to what may surely be the next “big investment theme” that has so far only succeeded in gaining the moniker of “The Widow-Maker”. If you guessed wagering upon when the Helicopter Economy of Japan will finally lose altitude, you would be correct.


In a tree saving effort, let me boil my argument down to this: “It is never different this time.”

Harley Bassman, Credit Suisse      

That Japan’s economy is doomed (as best seen in this chart), as are its government bonds, is unquestionable. There is simply no way the country, faced with an inescapable demographic collapse… 

…can crawl its back to viability without imploding in an eventual deflationary singularity, from which, however, courtesy of the BOJ’s epic printathon, it may eventually inflate away its debt, but not before crucifying its currency, and the living standards of its population. In other words, there is no realistic escape.

This is not news. The problem is that for many – especially the Japanese experts – this has not been news for years and years, yet anyone and everyone who has so far bet on the collapse of the Japanese house of cards, has lost money if not gone bankrupt due to the negative carry or the time decay of any short options. Hence the name: the “widow-maker” trade.

There may, however, be a loophole for all those who, correctly, know that the end of the line for Japan is just a matter of time. The trade in question is described by the “convexity maven” – Credit Suisse’s Harley Bassman:

The Trade

Taking a “short position” in either Japanese interest rates or their currency is a fundamentally sound idea; however it may take three to seven years for the “Macro-profits” to be fully realized. Over that time, a short position will demand a cost, either in the terms of the negative carry of a spot position or the time decay of a short-dated option. Additionally, since it is unlikely you will enter the trade at the extreme, there could be some mark-to-market vibrations that may breach your risk limits.

To the rescue is the strange circumstance of a widening USD vs. JPY Rate differential in conjunction with a flattening Volatility Term Surface. Below is a table of mid-market values for Par Strike USD call // JPY put options with expiries from one-year to ten-years. The critical observation is that a five-year option costs more than a ten-year option; thus the weird dynamic of owning an option with (effectively) positive “theta”: You are paid to own an option !

This is neither financial “magic” nor an “option special”; these are all plain vanilla options than can be priced using Bloomberg’s OVDV screen. Rather, it is merely the interesting mathematical paradox between the Rate process which is Linear and the Time process which is Logarithmic.

In a nutshell, net interest income is linear to time so two years of coupon payments are twice the size as a single year’s value. In contrast, an option’s price increases with the square root of time, so a two-year option is only 1.4 times greater in price than a one-year option.

The easy execution of this idea is just to buy a ten-year call option and put it away for five years:

Strike = 100; Price ~~ Customer pays 7.375%
Strike = 110; Price ~~ Customer pays 5.375%
Strike = 120; Price ~~ Customer pays 4.125%

The more interesting trade might be to execute a five-year vs. ten-year calendar:

Sell five-year vs. Buy ten-year, Strikes = 100; Client receives 0.50%
Sell five-year vs. Buy ten-year, Strikes = 110; Client pays 0.750%
Sell five-year vs. Buy ten-year, Strikes = 120; Client pays 1.375%

Summary

1) The maximum loss for an out-right purchase is limited to the fee paid;
2) The “net” option decay is positive for longer-dated options;
3) Provides the time required to capture the “event risk” of the premise;
4) JPY rates should likely increase at a faster pace than USD rates when Japan finally needs to externally fund itself. Thus one owns a “rates kicker” since the steep negative slope of the forward currency spread will collapse (and may ultimately invert). This would greatly benefit the calendar spread execution.

The lesson from so many of the great Macro Investments Themes is that it sometimes takes the “fullness of time” to realize the largest profits. Unfortunately, the current environment has less patience to tolerate investment costs, as such a “Positive Carry” long option position should be quite interesting.

The Japanese financial situation will normalize at some point; being “paid to wait” for the first five years solves the thorny problem of trying to time that date.


via Zero Hedge http://feedproxy.google.com/~r/zerohedge/feed/~3/aRQK2WumREA/story01.htm Tyler Durden