Today’s AM fix was USD 1,228.50, EUR 895.60 and GBP 749.95 per ounce.
Friday’s AM fix was USD 1,230.75, EUR 900.59 and GBP 752.38 per ounce.
Gold rose $4.56 or 0.4% Friday, closing at $1,229.06/oz. Silver climbed $0.11 or 0.6% closing at $19.44/oz. Platinum fell $3.25, or 0.2%, to $1,354.74/oz and palladium dropped $0.64 or 0.1%, to $731.50/oz. Gold and silver were down 1.7% and 2.6% for the week respectively.
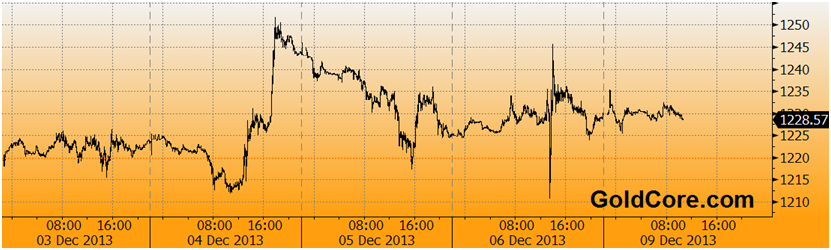
Gold in U.S. Dollars, 5 Day – (Bloomberg)
Gold was flat on Monday after volatile trading last week led to slight losses. Very tentative signs of improving U.S. economic growth kept prices in the red as technical and momentum traders remain negative on gold.
On Friday, gold closed with a decline of nearly 2% for the week, as traders had to wade through a week of mostly upbeat economic numbers, including a stronger-than-expected U.S. jobs report for November on Friday. Short-covering by traders and physical demand offered some support.
More speculative market participants and traders continue to fret over whether the United States will begin tapering its $20 billion a week debt monetisation programme. Also, stronger equities is attracting hot money flows from those seeking to make quick capital gains. This tends to end on tears as late comers to the party buy at record highs.
Chinese gold bullion demand remains voracious and will likely pick up after the recent price falls and ahead of Chinese New Year. October saw China’s second highest month for gold imports ever, according to Hong Kong customs data.
China imported 148 tons in October, the second highest recorded level. The record was in March 2013 when China imported 224 tons. October marked China’s 26th consecutive month of being a substantial net gold importer.
These numbers are solely demand that is going through Hong Kong. There are also sizeable shipments directly to China from Australia, the UK, the U.S. and South Africa. There may also be exports from elsewhere in Africa that is not showing up in the data.

Meanwhile, the SPDR Gold Trust, the world’s largest gold exchange-traded fund, said its holdings fell 3 tonnes to 835.71 tonnes on Friday as gold continues to flow from west to east.
Another bullish contrarian indicator is the fact that hedge funds raised their bearish bets in U.S. gold futures and options close to a 7 and a 1/2 year high in the week to December 3, data from the Commodity Futures Trading Commission (CFTC) showed Friday. Speculators turned silver into a net short position for the first time since late June.

Managed Money Long Golf Bets At Lowest Since July 2012 – Bloomberg Industries
What Are Bail-Ins?
A bail-in is when regulators or governments have statutory powers to restructure the liabilities of a distressed financial institution and impose losses on both bondholders & depositors.
Simply stated, a bank bail-in is an attempt to resolve and restructure a bank as a going concern, by creating additional bank capital (recapitalisation) via forced conversion of the bank’s creditors’ claims (potentially bonds and deposits) into newly created share capital (common shares of the bank).
The bail-in is undertaken by a regulatory authority that is vested with powers to execute a previously agreed bailin plan in a very short space of time, possibly over a weekend, so as to keep the bank functioning, and to preserve financial stability as far as possible.
To understand what the bail-in concept of a troubled bank is, it is important to understand what a bank balance sheet is, and what the balance sheet consists of. Simply put, a bank’s balance sheet consists of sources of financing and uses of this financing. At a high level, the sources are shareholders’ equity (shares) and the bank’s liabilities, which consist of lending to the bank by bondholders (bonds) and lending to the bank by depositors (deposits).
The shareholders are the bank’s owners, while the bondholders and depositors are the bank’s creditors. These components constitute the bank’s capital, and in total are known as its capital structure. The bank then lends out and invests its liabilities and refers to them as assets.
Previously, during bank bail-outs, when a bank was failing and the government stepped in, the losses were absorbed by the sovereign states and the risk was transferred to the taxpayer. In a bail-in, during the resolution of the problematic bank, the risk is pushed back to the bank’s shareholders and creditors.
In a bank’s capital structure, the various sources of financing exist in a hierarchy of claims. This is both a hierarchy for repayment when the bank is a going concern, and also in liquidation. Debt resides at the top of the hierarchy for repayment, since bondholders get repaid ahead of equity holders. In a liquidation, the company’s assets are sold and proceeds are paid to senior creditors, subordinated creditors, and then shareholders, in that specific order. If senior creditors take a hit, subordinated creditors get nothing, nor do shareholders, who get wiped out. If subordinated creditors take a hit, shareholders are wiped out.
There is normally a stratum of seniority within debt holders, for example, from top to bottom, running from super senior debt, to senior debt, to subordinated debt, then to junior debt. Senior debt can include secured and unsecured bonds, depositors, and in some cases wholesale money market borrowing. Secured bonds are ‘backed’ by specific assets or collateral and rank higher in the repayment hierarchy than unsecured bonds. Below debt in the hierarchy sits equity, such as preferred equity, and at the bottom, common equity (shares).
In a direct bail-in regime, as proposed by the Financial Stability Board and associated monetary authorities, there is also a hierarchy of first to be bailed-in (converted to bank shares), but it differs from the liquidation creditor hierarchy since in a bail-in, shareholders do not get wiped out, they get diluted. The more the bank’s assets are impaired, the more categories of bank liabilities get converted to shares.
This impacts the shareholders since their shareholdings become diluted as entities who were previously creditors become shareholders. So a bail-in differs from a liquidation in that although creditors take a loss, existing shareholders survive but own less of the overall share capital.
In Cyprus, bondholders (including senior bond holders) and depositors over €100,000 were bailed-in. Their money was seized, and in return they were given shares in the problematic banks, thereby becoming shareholders of these struggling banks.
Usually, only bonds with a conversion option, called convertible bonds, ever have the potential for getting converted into equity. However, there is another class of convertible bonds called contingent convertible bonds that can be converted into equity depending on particular outcomes or scenarios.
Given that the bail-in regime can force bondholders and depositors to be converted into shareholders, a new thinking is evolvi
ng in which unsecured bonds and bank deposits should now be viewed as contingent capital.
This is really the crux of the Cyprus template as proposed by international monetary authorities , i.e. that depositors internationally now have to think of their uninsured deposits as liable to potentially being confiscated and transformed into bank shares.
Bank depositors have traditionally viewed their bank deposits as 100% secure, with an inalienable right to have their deposits returned in full. However, this has never been the case in legal terms. A bank depositor is just an unsecured creditor of the bank.
In other words, the depositor is a lender who has loaned their deposit to the bank. If the bank became insolvent, depositors would have to line up with the other creditors in the hierarchy of claims and wait to see if their money was returned.
In light of the above hierarchy and the essential unsecured creditor nature of bank deposits, it’s useful to look at some formal definitions of bail-ins as applied to Systematically Important Financial Institutions (SIFIs).
A 2012 IMF Staff Paper defined a bail-in as:
A statutory power to restructure the liabilities of a distressed SIFI by converting and/or writing down unsecured debt on a “going concern basis.” In bail-in, the concerned SIFI remains open and its existence as an on-going legal entity is maintained. The idea is to eliminate insolvency risk by restoring a distressed financial institution to viability through the restructuring of its liabilities and without having to inject public funds….The aim is to have a private-sector solution as an alternative to government-funded rescues of SIFIs.
The Systematically Important Financial Institution concept is similar to the Too Big To Fail (TBTF) doctrine which was used to bail-out a number of large international banks during the financial crisis in 2008. The ‘TBTF’ concept maintains that when a financial institution is so big and interconnected into an economy that if it failed it would be disastrous to that economy, then it has to be supported by the relevant government or authority.
In October 2012, in a speech to the International Association of Depositor Insurers (IADI) annual conference, Paul Tucker, a deputy governor of the Bank of England, explained the central bank view on bail-ins:
“The central principle running through this whole endeavour is that after equity is exhausted, losses should fall next on uninsured debt holders, in the order they would take losses in a standard bankruptcy or liquidation process. Although all resolution strategies have that effect, it is the particular focus of what has come to be called ‘bail-in’. I should perhaps say that bail-in isn’t about identifying a special type of bond that can be written down or converted. ‘Bail-in’ is a verb not a noun. It’s about giving the authorities the tools, the powers, to affect a restructuring of the capital and liabilities of a bank that isn’t toxic all the way through.”
For large institutions, there are two main approaches to a bail-in, the first being ‘single point of entry resolution’ where the bail-in occurs in the holding company at the top of the group, and the second being ‘multiple point of entry resolution’ where, given that a banking group may be operating across lots of regions
Who Is Driving The Bail-In Regime?
It is revealing to examine the genesis and evolution of the centrally planned bail-in regime as discussed by central banks and international policymakers, since it highlights that the planning and preparation for a global bank “Bail-In Regime” has been on-going internationally at a high level for a number of years now, primarily under the auspices of the Financial Stability Board (FSB).

The Financial Stability Board emerged from the Financial Stability Forum (FSF), which was a group of finance ministries, central bankers and international financial bodies, founded in 1999 after discussions among Finance Ministers and Central Bank Governors of the G7 countries. The FSF facilitated discussion and co-operation on supervision and surveillance of financial institutions, transactions and events. The FSF was managed by a small secretariat housed at the Bank for International Settlements in Basel, Switzerland.
The FSB was officially founded at a Group of Twenty Finance Ministers and Central Bankers (G20) meeting in London in April 2009. The FSB coordinates national and supra-national regulatory and supervisory bodies on financial sector stability.
The FSB’s first chairman was Mario Draghi, current President of the European Central Bank, while its current chairman is Mark Carney, Governor of the Bank of England.
FSB members now include monetary authorities and security market regulators from the US, the UK, Canada, Australia, France, Italy, the Netherlands, Germany, Switzerland, Japan, Hong Kong, Singapore, Brazil, Russia, India, China and South Africa, as well as the European Commission, IMF, OECD, World Bank, and the Bank for International Settlements (BIS).
The Key Attributes Of A Bail-In Regime
In October 2011, the Financial Stability Board (FSB) published a seminal report on the bail-in regime titled “Key Attributes of Effective Resolution Regimes for Financial Institutions”. 8
This report set out a high-level framework for responding to and resolving failures at banks and other financial institutions, and was officially endorsed by the G20 at a summit in Cannes in November 2011 “as the international standard for resolution regime”.
The intent is to “allow authorities to resolve financial institutions in an orderly manner without taxpayer exposure to loss from solvency support, while maintaining continuity of their vital economic functions”. Essentially this means addressing the funding of firms in resolution, as well as recovery and resolution planning.
The Key Attributes include a number of noteworthy pronouncements on an effective resolution regime such as:
• Allocating losses to firm owners (shareholders) and unsecured and uninsured creditors in a manner that respects the hierarchy of claims.
• Not relying on public solvency support and not creating an expectation that such support will be available.
• Where covered by schemes and arrangements, protecting depositors that are covered by such schemes and arrangements, and ensuring the rapid return of segregated client assets.
The inclusion of Financial Market Infrastructures means that large parts of the global financial system is susceptible to bail-in and could potentially be bailed-in.
The scope of this planned bail-in regime for participating countries is not just limited to large domestic banks. In addition to these “systemically significant or critical” financial institutions, the scope also applies to two further categories of institutions, a) Global SIFIs, in other words, cross-border banks which happen to be incorporated domestically in a country that is implementing the bail-in regime, and b) ”Financial Market Infrastructures (FMIs)”, such as clearing houses.
The inclusion of Financial Market Infrastructures in potential bail-ins is in itself a major departure.
The FSB defines these market infrastructures to include multilateral securities and derivatives clearing and settlement systems, and a whole host of exchange and transaction systems, such as payment systems, central securities depositories, and trade depositories. This would mean that an unsecured creditor claim to, for example, a clearing house institution, or to a stock exchange, could in theory be affected if such an institution needed to be bailed-in.
As Paul Tucker phrased it at the IADI conference: “resolution isn’t just about banks, and so we are planning to elaborate on how the Key Attrib
utes should be applied to, for example, central counterparties, insurers, and the client assets held by prime brokers, custodians and others.”
The inclusion of Financial Market Infrastructures means that large parts of the global financial system is susceptible to bail-in and could potentially be bailed-in
According to the FSB report, the implementation of the bail-ins should be undertaken by a resolution authority in each country with statutory resolution powers to enforce bail-ins.
These powers would include powers to:
• Override rights of shareholders of the firm in resolution.
• Transfer or sell assets and liabilities, legal rights and obligations, including deposit liabilities and ownership in shares to a solvent third party.
• Carry out bail-in within resolution.
• Impose a moratorium with a suspension of payments to unsecured creditors.
• Effect the closure and orderly wind down (liquidation) of the whole or part of a failing firm with timely payout or transfer of insured deposits.
Following on from the release of the FSB Key Attributes report in 2011, it became apparent that national monetary authorities and regulators had been actively working for some time on national bail-in preparedness and their own versions of the Key Attributes.
Download our Bail-In Guide: Protecting your Savings In The Coming Bail-In Era(11 pages)
Download our Bail-In Research: From Bail-Outs to Bail-Ins: Risks and Ramifications –
Including 60 Safest Banks In The World List (51 pages)


via Zero Hedge http://feedproxy.google.com/~r/zerohedge/feed/~3/RfGhrbLIJ5g/story01.htm GoldCore